Chapter 03 – Demand, Supply, and Market Equilibrium (+ Appendix)
3A-1
Chapter 03 Demand, Supply, and Market Equilibrium (+ Appendix)
APPENDIX QUESTIONS
1. Why are shortages or surpluses more likely with preset prices, such as those on tickets, than
flexible prices, such as those on gasoline? LO6
Answer: Preset prices, rather than responding to demand conditions, attempt to predict
the level of demand that will produce an equilibrium quantity. If these predictions are
2. Most scalping laws make it illegal to sell—but not to buy—tickets at prices above those printed
on the tickets. Assuming that is the case, use supply and demand analysis to explain why the
equilibrium ticket price in an illegal secondary market tends to be higher than in a legal secondary
market. LO6
Answer: Ticket prices tend to be higher in illegal secondary markets because sellers face
3. Go to the Web site of the Energy Information Administration, http://www.eia.doe.gov, and
follow the links to find the current retail price of gasoline. How does the current price of regular
gasoline compare with the price a year ago? What must have happened to either supply, demand,
or both to explain the observed price change? LO6
4. Suppose the supply of apples sharply increases because of perfect weather conditions
throughout the growing season. Assuming no change in demand, explain the effect on the
equilibrium price and quantity of apples. Explain why quantity demanded increases even though
demand does not change. LO6
Answer: The increase in supply will lower the equilibrium price and increase the
Chapter 03 – Demand, Supply, and Market Equilibrium (+ Appendix)
3A-2
5. Assume the demand for lumber suddenly rises because of a rapid growth of demand for new
housing. Assume no change in supply. Why does the equilibrium price of lumber rise? What
would happen if the price did not rise under the demand and supply circumstances described?
LO6
Answer: Buyers are willing to purchase more new housing, causing price and quantity to
increase in that market. In order to satisfy the increased demand for new housing, more
6. Suppose both the demand for olives and the supply of olives decline by equal amounts over
some time period. Use graphical analysis to show the effect on equilibrium price and quantity.
LO6
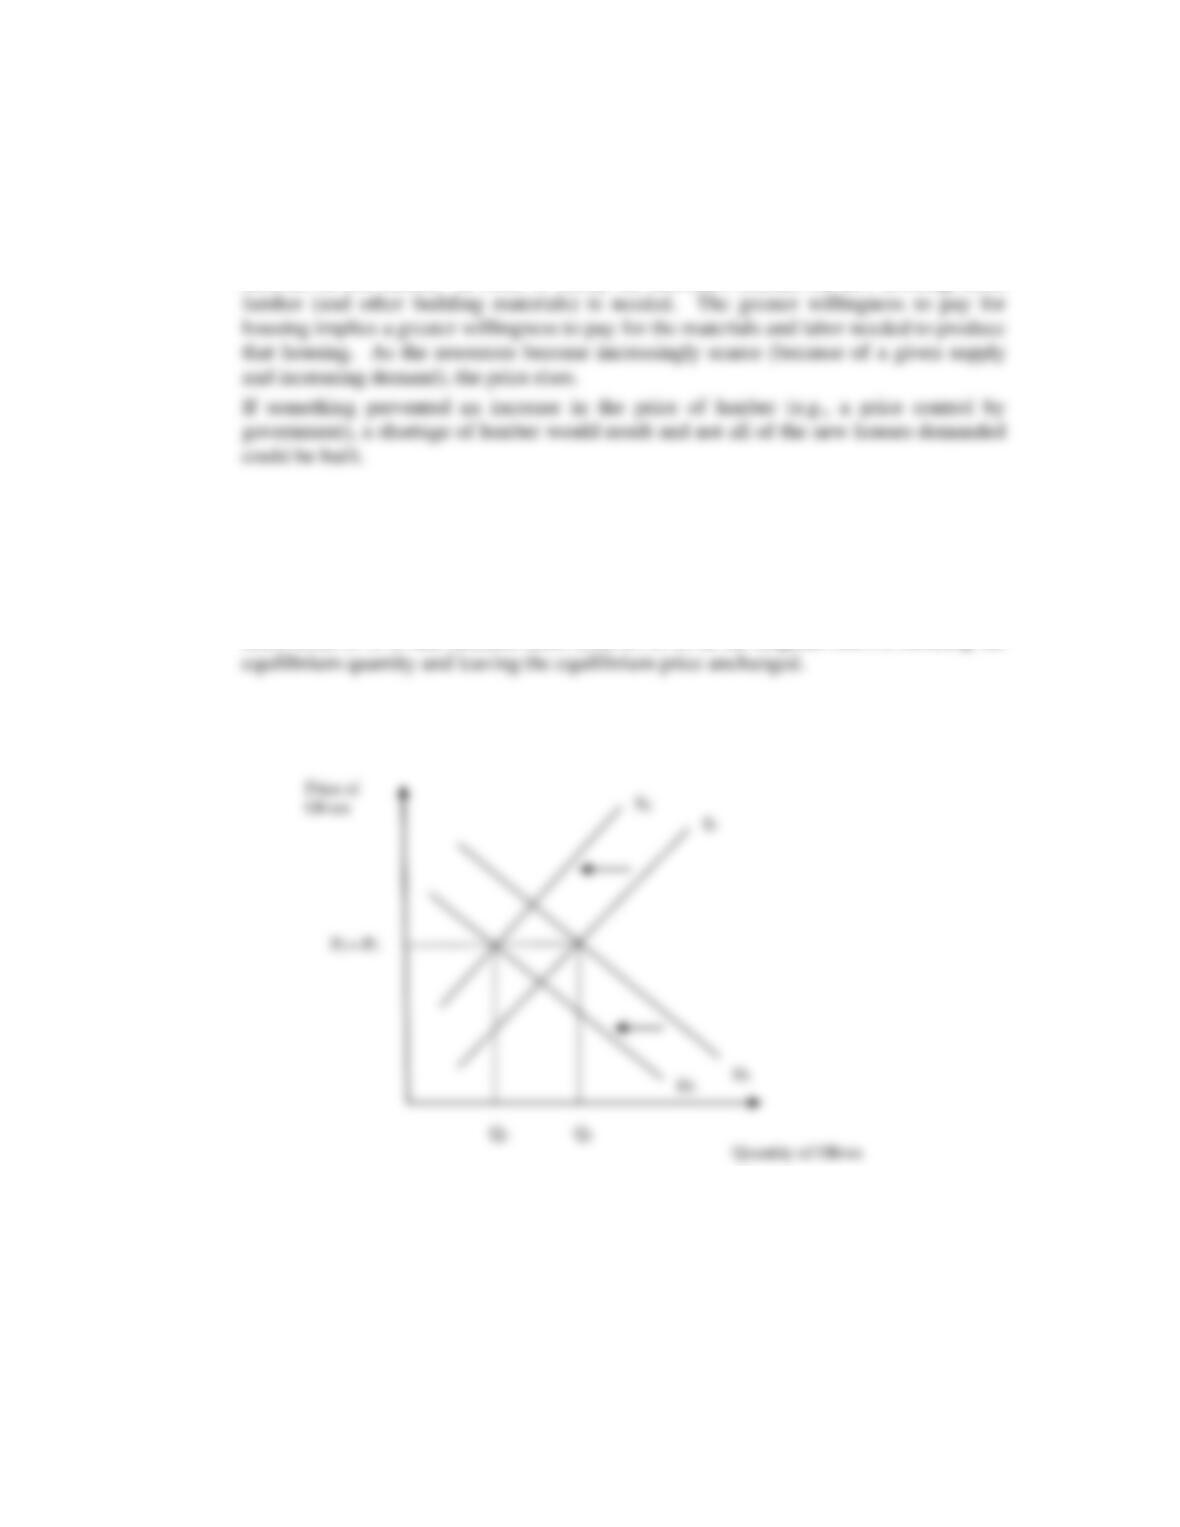
Answer: The supply and demand curves would shift left by an equal amount (supply
shifts from S1 to S2 and demand shifts from D1 to D2 in the diagram below), reducing the
Chapter 03 – Demand, Supply, and Market Equilibrium (+ Appendix)
3A-3
7. Assume that both the supply of bottled water and the demand for bottled water rise during the
summer but that supply increases more rapidly than demand. What can you conclude about the
directions of the impacts on equilibrium price and equilibrium quantity? LO6
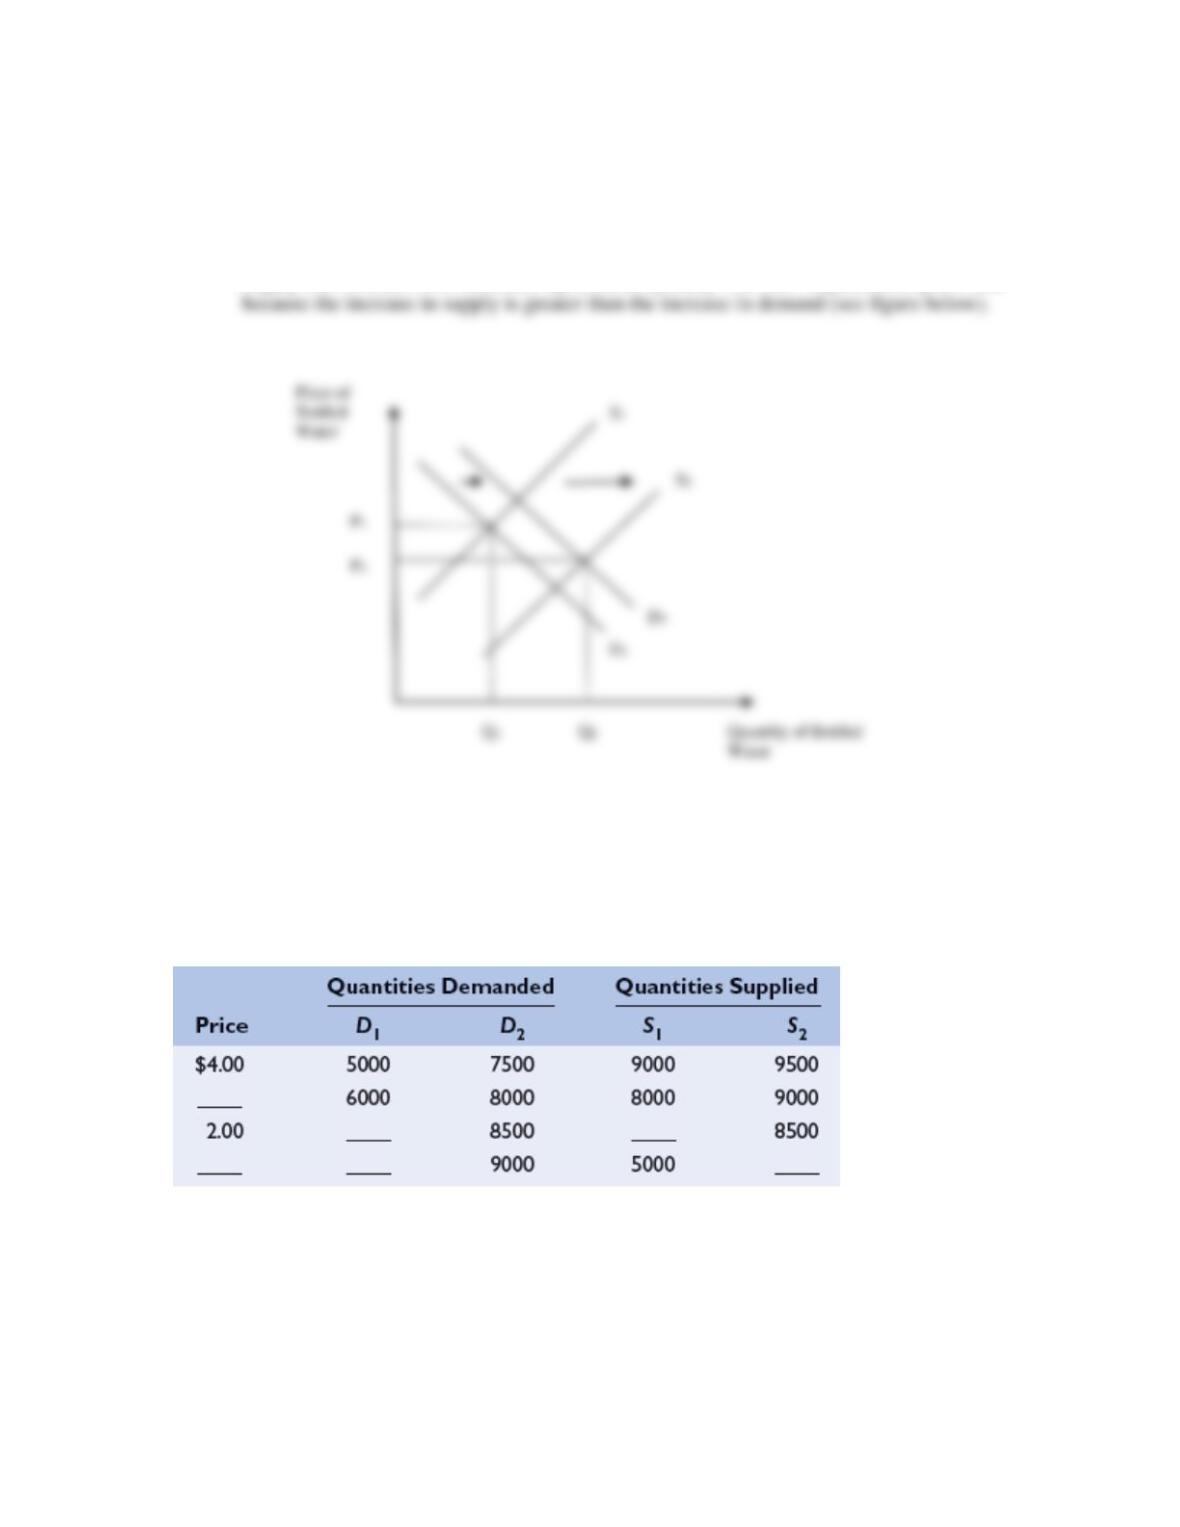
Answer: The equilibrium price will fall and the equilibrium quantity will rise. Whenever
supply and demand both increase, equilibrium quantity will rise. Equilibrium price falls
APPENDIX PROBLEMS
1. Demand and supply often shift in the retail market for gasoline. Here are two demand curves
and two supply curves for gallons of gasoline in the month of May in a small town in Maine.
Some of the data is missing. LO6
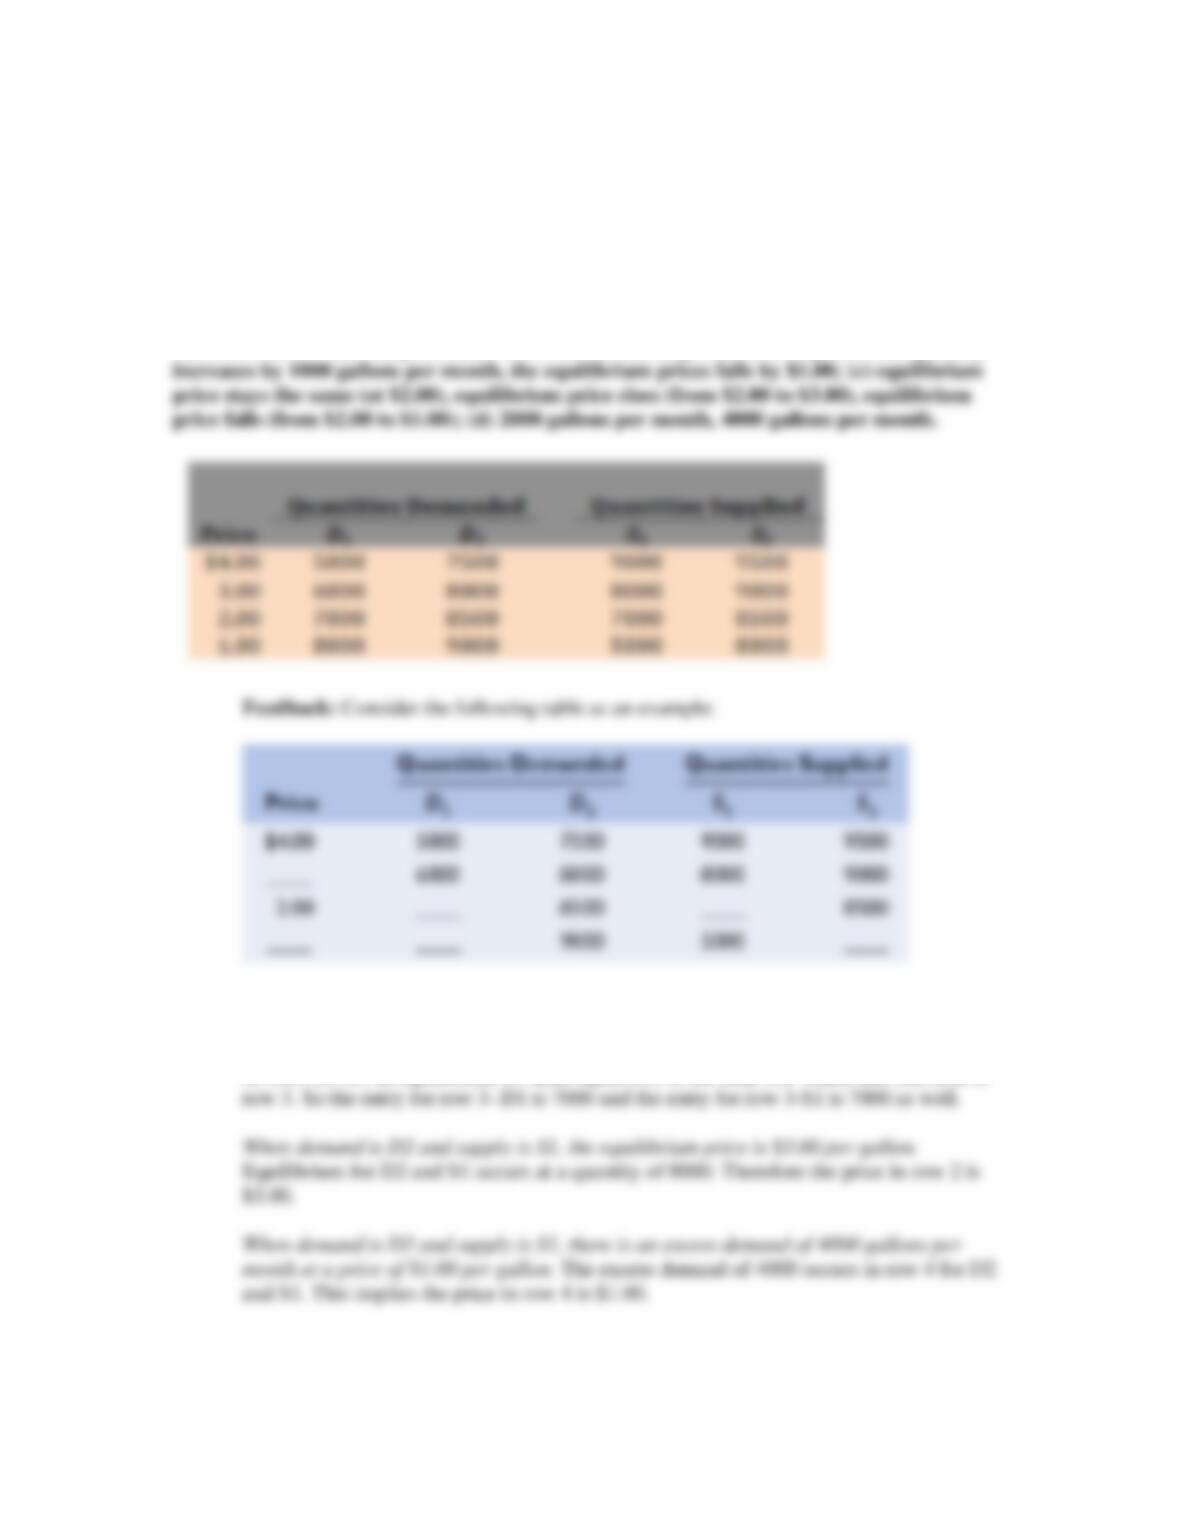
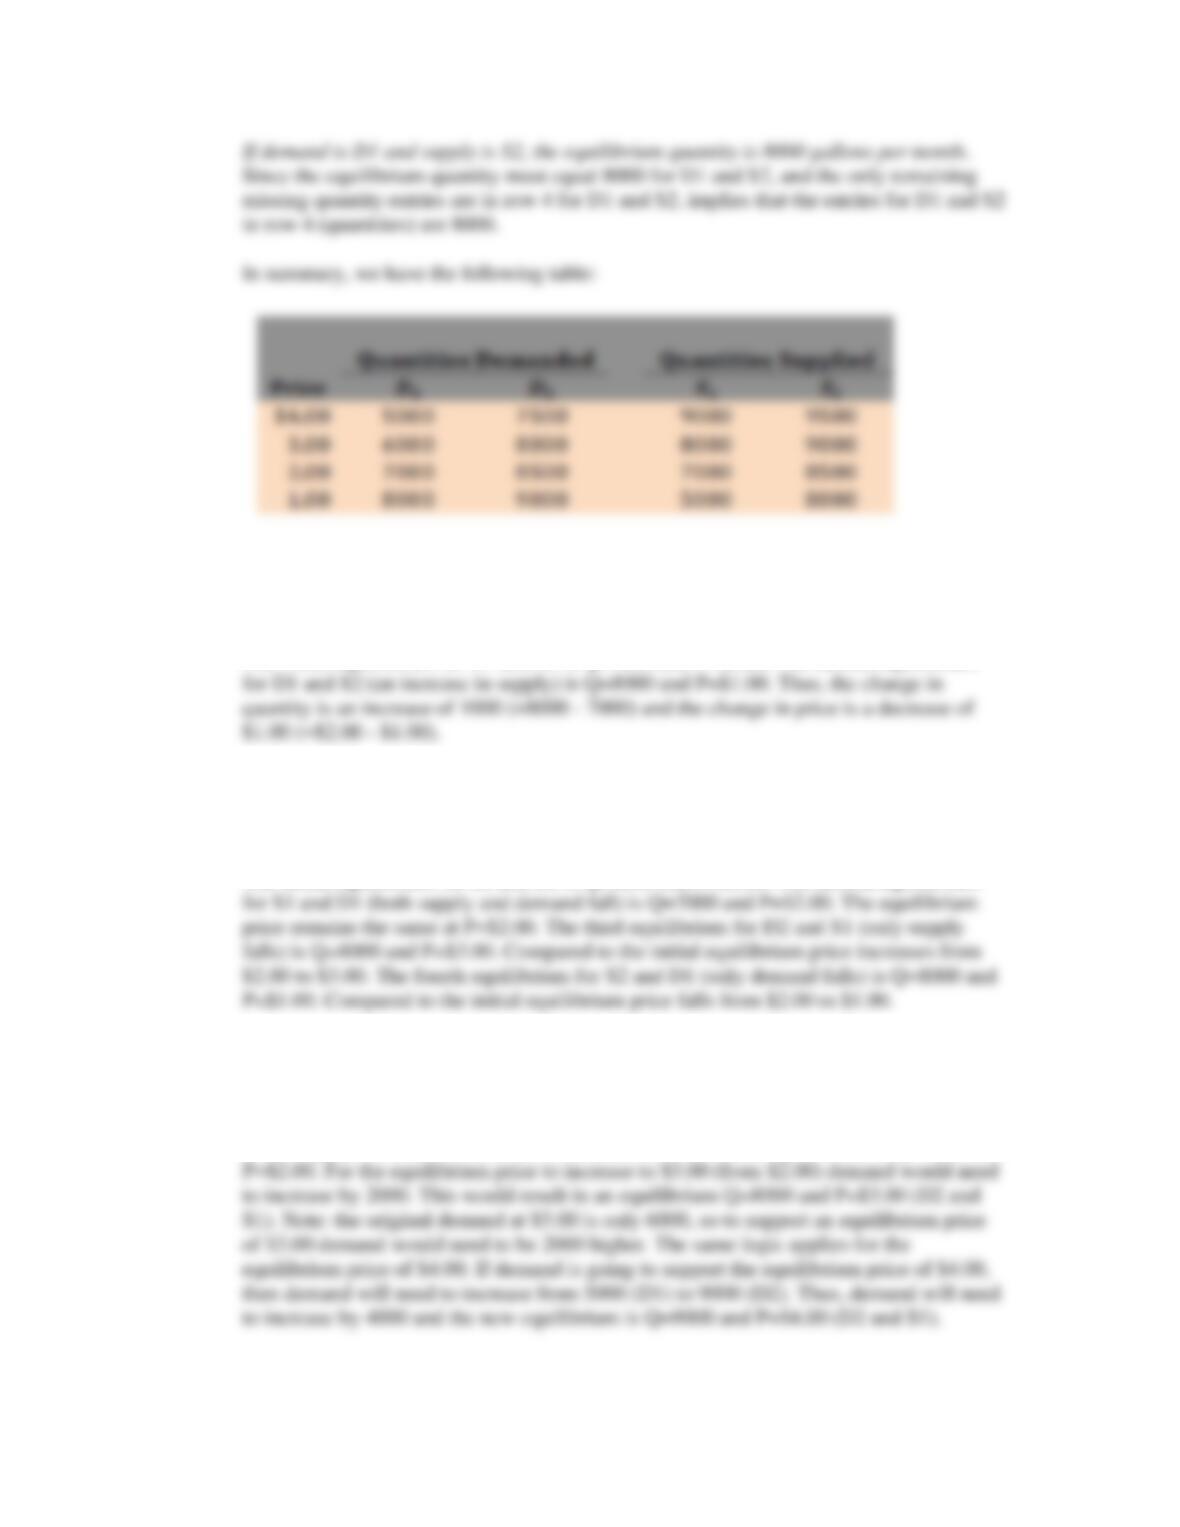
a. Use the following facts to fill in the missing data in the table. If demand is D1 and Supply is
S1, the equilibrium quantity is 7000 gallons per month. When demand is D2 and supply is S1, the
equilibrium price is $3.00 per gallon. When demand is D2 and supply is S1, there is an excess
demand of 4000 gallons per month at a price of $1.00 per gallon. If demand is D1 and supply is
S2, the equilibrium quantity is 8000 gallons per month.
Chapter 03 – Demand, Supply, and Market Equilibrium (+ Appendix)
3A-4
b. Compare two equilibriums. In the first, demand is D1 and supply is S1. In the second, demand
is D1 and supply is S2. By how much does the equilibrium quantity change? By how much does
the equilibrium price change?
c. If supply falls from S2 to S1 while demand declines from D2 to D1, does the equilibrium price
rise or fall or stay the same? What if only supply falls? What if only demand falls?
d. Suppose that supply is fixed at S1 and that demand starts at D1. By how many gallons per
month would demand have to increase at each price level such that the equilibrium price per
gallon would be $3.00? $4.00?
Answers: (a) See the complete table below for the missing values; (b) equilibrium quantity
Part a: If demand is D1 and Supply is S1, the equilibrium quantity is 7000 gallons per
month. We can eliminate all rows except the third row in the table above because we
actually have values for the first two rows for D1 and S1 and the fourth row has a value
of 5000 for S1. In equilibrium S1 must equal D1, so the only row where this can hold is
Chapter 03 – Demand, Supply, and Market Equilibrium (+ Appendix)
3A-5
Part b: Compare two equilibriums. In the first, demand is D1 and supply is S1. In the
second, demand is D1 and supply is S2. By how much does the equilibrium quantity
change? By how much does the equilibrium price change?
The initial equilibrium for D1 and S1 is Q=7000 and P=$2.00. The second equilibrium
Part c: If supply falls from S2 to S1 while demand declines from D2 to D1, does the
equilibrium price rise or fall or stay the same? What if only supply falls? What if only
demand falls?
The initial equilibrium for S2 and D2 is Q=8500 and P=$2.00. The second equilibrium
Part d: Suppose that supply is fixed at S1 and that demand starts at D1. By how many
gallons per month would demand have to increase at each price level such that the
equilibrium price per gallon would be $3.00? $4.00?
Since supply is fixed at S1 and demand starts at D1 the initial equilibrium is Q=7000 and
Chapter 03 – Demand, Supply, and Market Equilibrium (+ Appendix)
3A-6
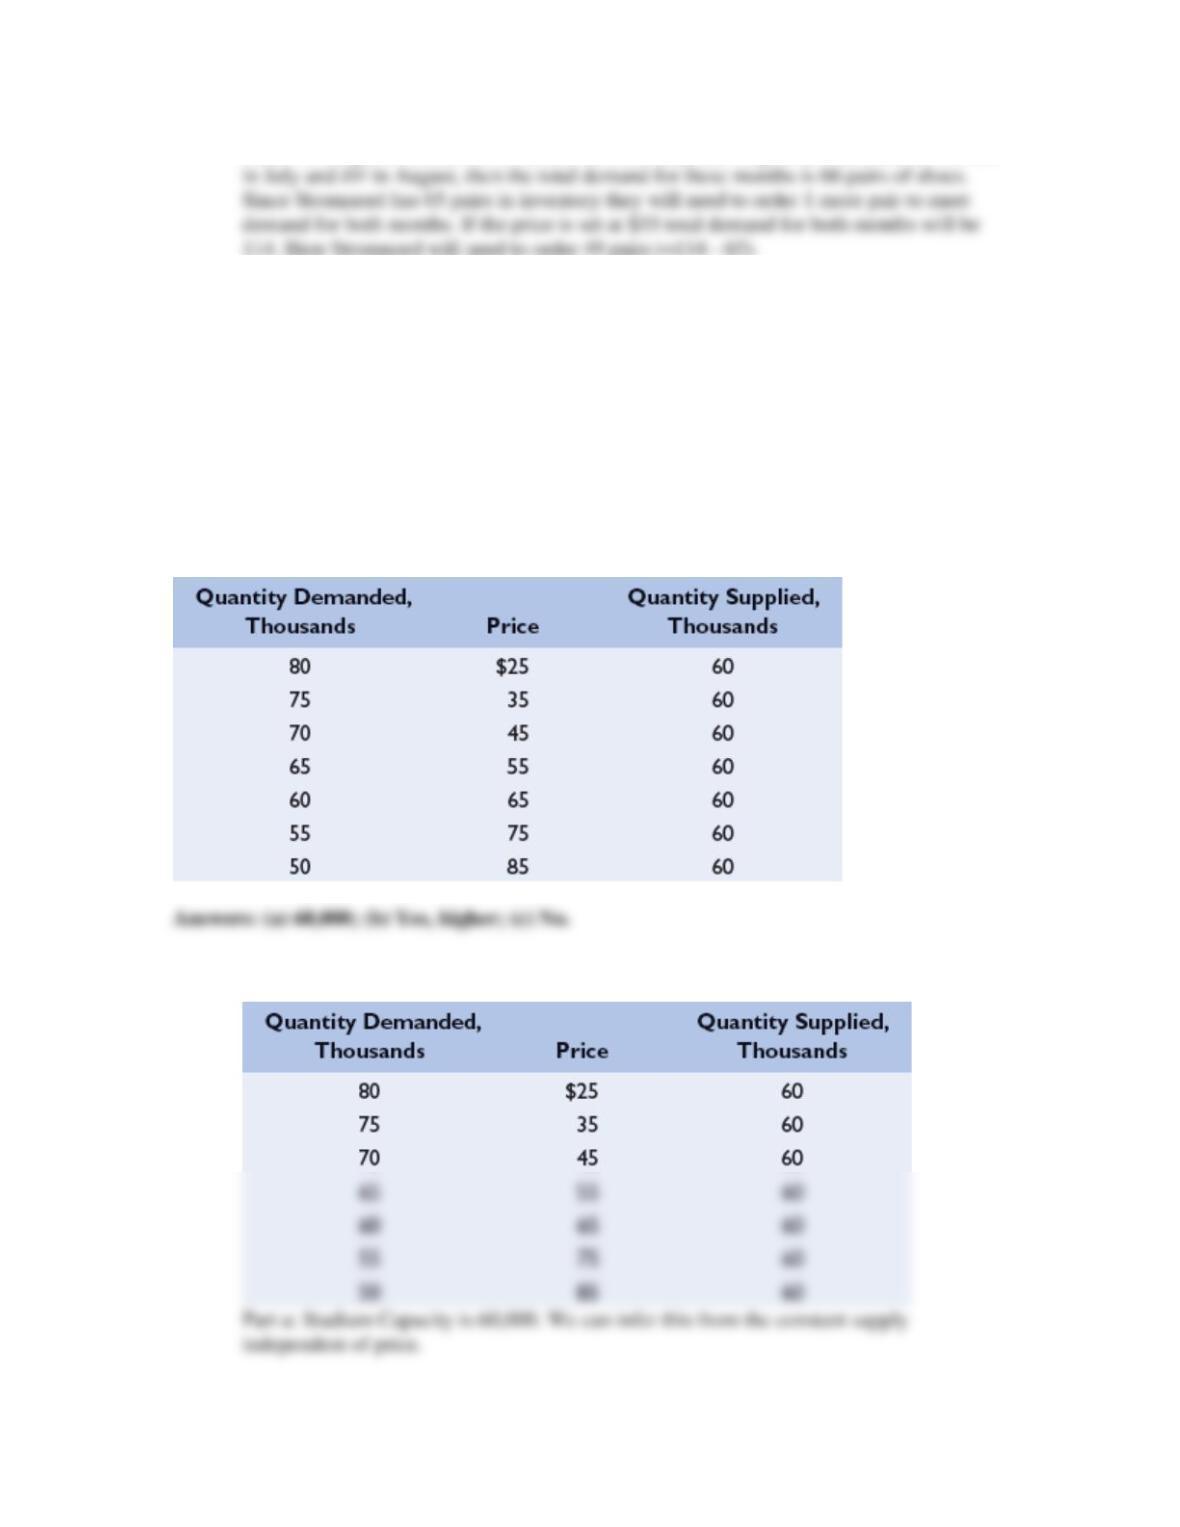
2. The table below shows two demand schedules for a given style of men’s shoes—that is, how
many pairs per month will be demanded at various prices at a men’s clothing store in Seattle
called Stromnord.
Suppose that Stromnord has exactly 65 pairs of this style of shoe in inventory at the start of the
month of July and will not receive any more pairs of this style until at least August first. LO6
a. If demand is D1, what is the lowest price that Stromnord can charge so that it will not run out
of this model of shoes in the month of July? What if demand is D2?
b. If the price of shoes is set at $75 for both July and August and demand will be D2 in July and
D1 in August, how many pairs of shoes should Stromnord order if it wants to end the month of
August with exactly zero pairs of shoes in its inventory? What if the price is set at $55 for both
months?
Feedback: Consider the following table and information as an example:
Stromnord has exactly 65 pairs of this style of shoe in inventory at the start of the month
of July and will not receive any more pairs of this style until at least August first.
Part a: If demand is D1, the lowest price Stromnord can charge $70 if it does not want to
run out of shoes in the month of July. A price of $65 would result in a demand of 68 pairs
Chapter 03 – Demand, Supply, and Market Equilibrium (+ Appendix)
3A-7
Part b: If the price of shoes is set at $75 for both July and August and demand will be D2
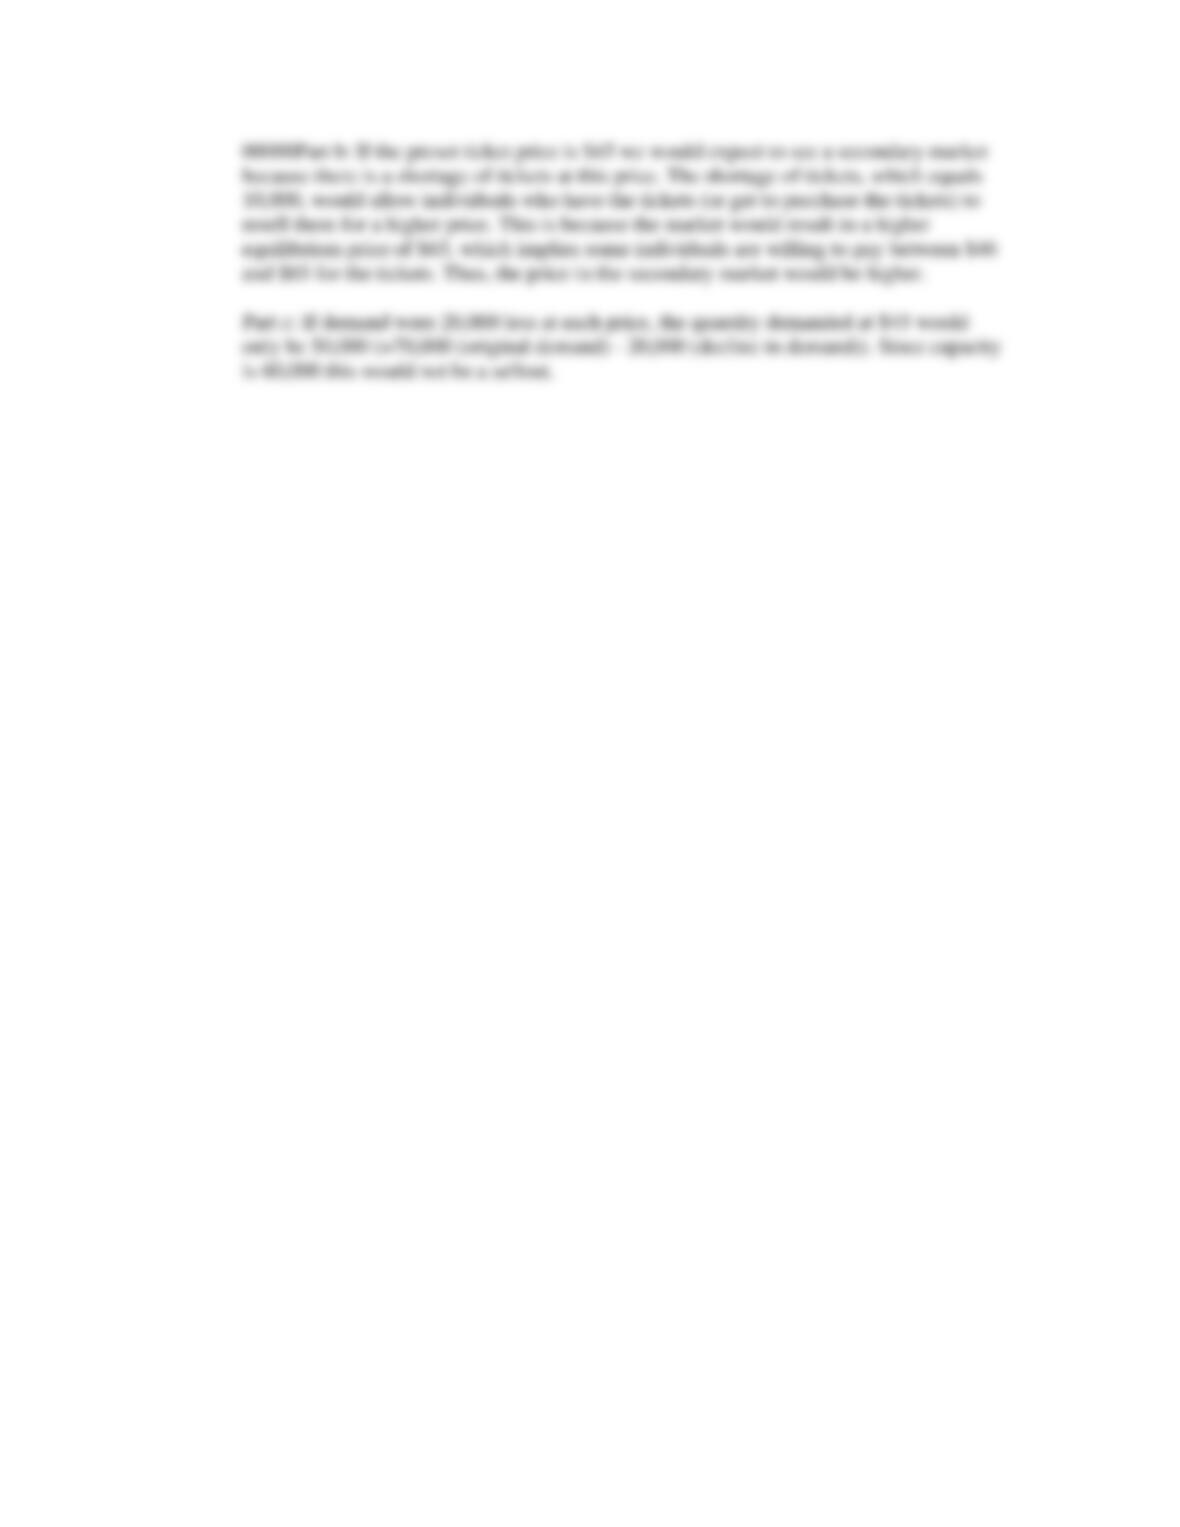
3. Use the table below to answer the questions that follow: LO6
a. If this table reflects the supply of and demand for tickets to a particular World Cup soccer
game, what is the stadium capacity?
b. If the preset ticket price is $45, would we expect to see a secondary market for tickets? Would
the price of a ticket in the secondary market be higher than, the same as, or lower than the price in
the primary (original) market?
c. Suppose for some other World Cup game the quantities of tickets demanded are 20,000 lower
at each ticket price than shown in the table. If the ticket price remains $45, would the event be a
sellout?
Feedback: Consider the following table as an example:
Chapter 03 – Demand, Supply, and Market Equilibrium (+ Appendix)
3A-8