Chapter 3
Demand and Supply
◼ Overview
This chapter introduces one of the major analytical areas of economics, demand and supply, that forms
the basis for much of theoretical analysis used throughout the text. The concepts of the difference
between money price and relative price, the law of demand, income and substitution effects, the
◼ Learning Objectives
After studying this chapter students should be able to:
• 3.1 Explain the law of demand
• 3.2 Distinguish between changes in demand and changes in quantity demanded
◼ Outline
I. Demand: A schedule showing how much of a good or service people will purchase at any price
during a specified time period, other things being equal
A. The Law of Demand: The observation that there is a negative or inverse relationship between
the price of any good and the quantity demanded, holding other factors constant
B. Relative Prices versus Money Prices: Relative price is the price of a good or service in terms
of another. It is the money price of one commodity divided by the price of another or the number
of units of one commodity that must be sacrificed to purchase one unit of another commodity.
Money price is the price that is observed in terms of today’s dollars. (See Table 3-1.)
2. Comparing Relative Prices of Digital Storage Devices: Although the money prices of
Chapter 3 Demand and Supply 33
C. The Demand Schedule: The demand schedule is a numerical representation of the inverse
relationship between specific prices and quantities demanded of a good measured in terms of
constant quality units in a given time period. (See Figure 3-1(a).)
1. The Demand Curve: The demand curve is a graphic representation of the demand
II. Shifts in Demand: A shift of the entire demand curve so that at each price the quantity demanded
changes. A leftward shift of the demand curve means the quantity demanded at each price
decreases, while a rightward shift of the demand curve means the quantity demanded at each price
increases. (See Figure 3-4.)
A. The Other Determinants of Demand: These are nonprice factors that determine how much
will be bought, other things held constant. A change in any one of these factors will cause a
change in demand.
1. Income: For a normal good, an increase in income leads to an increase in demand, while
2. Tastes and Preferences: If consumer tastes change in favor of a good, then there is an
3. Prices of Related Goods: Substitutes and Complements: When two goods are related, a
change in the price of one of them changes the demand for the other. Substitutes are goods
4. Expectations: Expectations of future increases in the price of a good, increases in income,
5. Market Size (Number of Potential Buyers): An increase in the number of buyers in the
B. Changes in Demand versus Changes in Quantity Demanded: A change in demand refers to
III. Supply: A schedule showing the relationship between price and quantity supplied at different
prices in a specified time period, other things being equal.
A. The Law of Supply: The observation that the higher the price of a good, the larger the quantity
sellers will make available over a specified time, other things being equal.
34 Miller • Economics Today, Nineteenth Edition
B. The Supply Schedule: A table that shows a direct relationship between price and quantity
supplied at each price in a given time period. (See Figure 3-7(a).)
1. Supply Curve: The graphical representation of the supply schedule, which is a curve that
IV. Shifts in Supply: A change in supply is a shift of the entire supply curve so that at each price the
quantity supplied changes. A leftward shift of the supply curve means that the quantity supplied
at each price decreases and is called a decrease in supply, while a rightward shift of the supply
curve means that quantity supplied at each price increases and is called an increase in supply.
(See Figure 3-10.)
A. The Other Determinants of Supply: These are factors other than price that determine how
much will be produced and are held constant when identifying supply. A change in one of these
factors will cause the supply curve to shift.
2. Cost of Inputs Used to Produce the Product: An increase (decrease) in the price of one
or more inputs will cause a decrease (increase) in supply.
B. Changes in Supply versus Changes in Quantity Supplied: A change in quantity supplied
refers to a movement along a given supply curve caused by a change in price. A change in
V. Putting Demand and Supply Together: The intersection of demand and supply determines the
prices that prevail in the U.S. economy and other economies.
A. Demand and Supply Schedules Combined: When the supply and demand schedules are
combined, an equilibrium or market-clearing price is determined. This is a price at which
B. Equilibrium: Equilibrium is a stable point. When equilibrium is reached, there is no tendency for
change unless supply and/or demand change. Equilibrium is a situation where quantity supplied
equals quantity demanded at a particular price. Equilibrium occurs where the supply and
demand curves intersect. (See Figure 3-11.)
C. Shortages: A shortage is a situation in which quantity demanded is greater than quantity
D. Surpluses: A surplus is a situation in which quantity demanded is less than quantity supplied at a
Chapter 3 Demand and Supply 35
◼ Points to Emphasize
Relative and Money Price
In the discussion of the law of demand, the inverse relationship is between relative price and quantity
demanded, not between money price and quantity demanded. The distinction between relative and money
price is difficult to understand. Because incomes can be related to price level, the use of the example of a
Constant Quality Units
It is important to recognize that the units of the good or service being examined in supply and demand
Changes in Relative Prices
Consumers will substitute relatively less expensive goods for relatively more expensive ones. When the
money price of a can of Coke increases by less than the price of a can of Pepsi increases, then buyers will
drink more Coke and fewer Pepsi. Suppose that the money price of both Pepsi and Coke is $0.50 per can.
Shifts in Demand (Supply) versus Changes in Quantity Demanded (Supplied)
A shift in a demand (supply) curve can only occur if there is a change in a determinant of demand
(supply) other than price. Also, the entire curve moves so that at each price the quantity demanded
Price
$
Quantity
Demanded 1
Quantity
Demanded 2
Quantity
Supplied
5
10
25
40
2
40
55
25
36 Miller • Economics Today, Nineteenth Edition
Equilibrium or Market-Clearing Price
Equilibrium price is stable because it is a price at which plans or intentions are realized. Demand refers
to planned rates of purchase at different prices, other things being equal, while supply refers to planned
rates of production that producers expect to sell at different prices, other things being equal. Equilibrium
When price is above equilibrium, a surplus exists. In this case, buyers’ plans are realized, but producers
cannot sell all they are producing and do not realize their plans. Producers react by reducing price and
quantity supplied. At a lower price, quantity supplied decreases, while the quantity demanded increases.
◼ For Those Who Wish to Stress Theory
Demand and Marginal Utility
The law of demand can be approached from the point of view of diminishing marginal utility. Since a
buyer gets less and less additional utility or satisfaction as successive additional units are consumed per
Chapter 3 Demand and Supply 37
Supply and Marginal Costs
The law of supply can be explained by increasing marginal costs and by an explanation of incentives.
A discussion of rising marginal costs requires the introduction of the law of diminishing returns. As
more units of labor are employed in the short run, the marginal product of labor begins to fall after some
◼ Further Questions for Class Discussion
1. “If price rises, then demand decreases. But if demand decreases, then equilibrium price will fall.
Therefore one cannot say with certainty what the net effect of an initial increase in price will be.”
Have students evaluate this statement. The word “demand” is used incorrectly in the first sentence.
2. A video outlet rents DVDs of old movies for $0.99 for 48 hours. It typically rents 200 DVDs per
day. The outlet gets in multiple copies of a smash hit movie and charges $2.50 to rent it for 24 hours.
Total rentals rise to 250 videos per day even though the average price of videos is higher. Does this
3. After Hurricane Katrina, the price of gasoline increased because of extensive damage to refineries
on the Gulf Coast. How would an economist use supply-and-demand analysis to explain the
4. A major political issue in the United States since the BP oil spill in the Gulf of Mexico is whether
or not to allow drilling for oil offshore in deep water to continue. Large deposits of oil are believed
5. In recent years the price of natural gas has decreased relative to the price of coal. Both of these fuels
are used to produce electricity. What would the supply and demand model predict would have
happened to the demand for coal used to produce electricity? Are coal and natural gas substitutes or
6. Oilman T. Boone Pickins has proposed a plan to build wind farms in the center of the United States
to produce about 20 percent of the electricity consumed in the United States to replace that same
percentage of electricity currently produced by natural gas. The natural gas saved would be used to
replace gasoline to run cars and light trucks. According to Pickins, oil imports could be reduced by
◼ Answers to Questions for Critical Analysis
The Law of Demand in the Market for Cable TV Subscription (p. 51)
Is there an inverse relationship between the price of cable TV subscriptions and the number of
subscriptions that people purchase? Explain.
There is an inverse relationship between the price of cable TV subscriptions and the number of
Tips and Quality-Adjusted Prices (p. 52)
How could laws that ban tips cause a reduction in the quality of the delivery of services?
Altered Tastes and Preferences Generate Lower Demand for Chewing Gum
(p. 57)
What has happened to the position of the U.S. market demand curve for chewing gum? Explain
briefly.
gum.
A Global Substitution from Coal to Natural Gas as an Energy Source (p. 57)
What do you suppose has happened since 2008 to the demand for nuclear energy in Europe, the
United States, and China, other things being equal?
Policies Generate Higher Water Input Costs and Cut Agricultural Commodity
Supplies (p. 64)
What do you suppose has happened to the positions of the supply curves in the markets for
commodities such as almonds, apples, cotton, oranges, grapes, lemons, rice, and walnuts?
Chapter 3 Demand and Supply 39
An Increase in the Supply of Automobiles in China (p. 64)
Has the market supply curve in China shifted rightward or leftward? Explain.
Long Lines at Restaurants Specializing in Barbecued Brisket Signal a Shortage (p. 67)
Why do you suppose that prices of barbecued brisket have been rising in many U.S. cities?
Should Shortages in the Ticket Market Be Solved by Scalpers? (p. 68)
What happens to ticket scalpers who are still holding tickets after an event has started?
◼ You Are There
The Breakfast Cereal Industry Confronts Changing Tastes and Preferences (p. 69)
1. What has been the direction of the shift in the demand for breakfast cereals?
2. What direction might the supply of breakfast cereals have shifted to help explain why the
market prices of these cereals have not changed very much during the past few years?
◼ Issues & Applications
The U.S. Oil Gusher Produces Shortages of Oil Storage Space (p. 70)
1. What do you predict has happened to oil storage prices whenever shortages of storage space
have arisen?
2. Why might increases in oil storage prices be required to induce owners of aged storage tanks
to increase the quantity of tank storage space supplied? (Hint: Owners must incur expenses to
refurbish storage tanks.)
Because aged oil storage tanks cannot readily be filled to capacity, an increase in quantity of oil
40 Miller • Economics Today, Nineteenth Edition
◼ Research Project
1. Learn more about the U.S. government’s estimates of the nation’s oil storage capabilities in the
◼ Answers to Problems
3-1. Suppose that in a recent market period, the following relationship existed between the price of
tablet devices and the quantity supplied and quantity demanded.
Price
Quantity Demanded
Quantity Supplied
$330
100 million
40 million
$340
90 million
60 million
$360
70 million
100 million
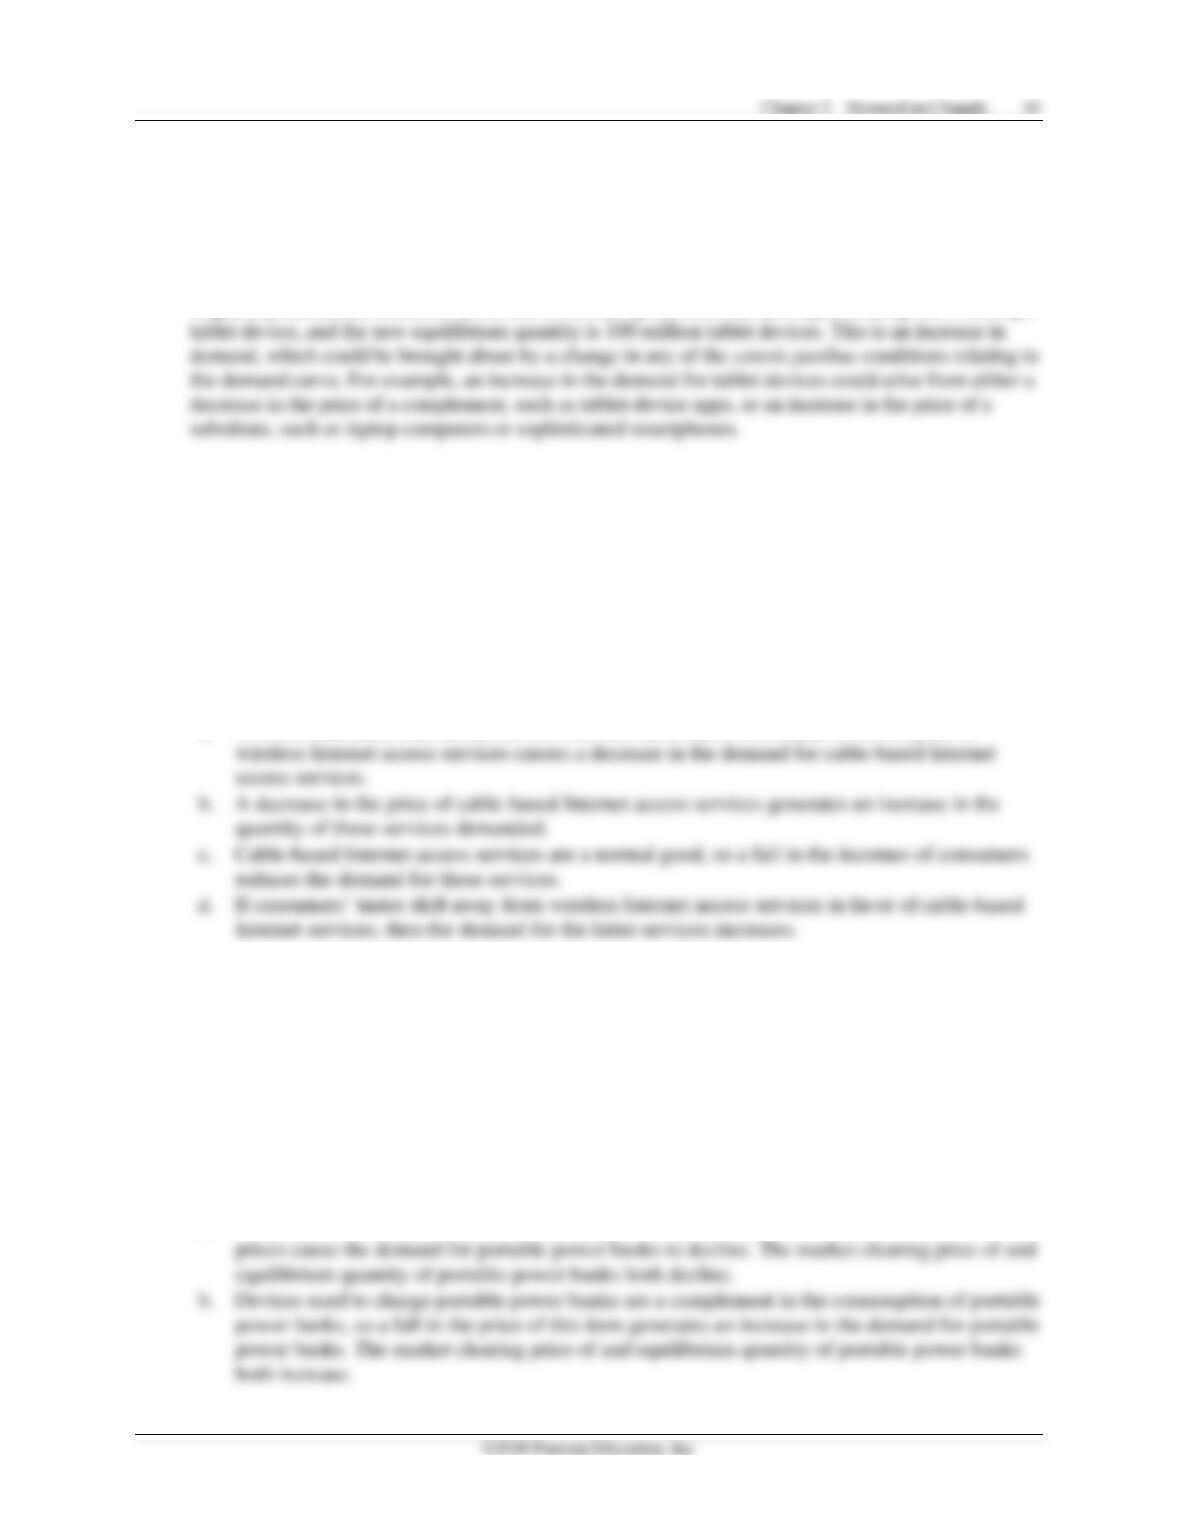
Graph the supply and demand curves for tablet devices using the information in the table.
What are the equilibrium price and quantity? If the industry price is $340, is there a shortage
or surplus of tablet devices? How much is the shortage or surplus?
The equilibrium price is $350 per tablet device, and the equilibrium quantity is 80 million tablet
3-2. Suppose that in a later market period, the quantities supplied in the table in Problem 3-1 are
unchanged. The amount demanded, however, has increased by 30 million at each price.
Construct the resulting demand curve in the illustration you made for Problem 3-1. Is this an
increase or a decrease in demand? What are the new equilibrium quantity and the new market
price? Give two examples of changes in ceteris paribus conditions that might cause such a change.
If quantity demanded increases by 30 million at each price, then the new equilibrium price is $360 per
3-3. Consider the market for cable-based Internet access service, which is a normal good. Explain
whether the following events would cause an increase or a decrease in demand or an increase
or a decrease in the quantity demanded.
a. Firms providing wireless (an alternative to cable) Internet access services reduce their prices.
b. Firms providing cable-based Internet access services reduce their prices.
c. There is a decrease in the incomes earned by consumers of cable-based Internet access
services.
d. Consumers’ tastes shift away from using wireless Internet access in favor of cable-based
Internet access services.
a. Wireless and cable Internet access services are substitutes, so a reduction in the price of
3-4. In the market for portable power banks (a normal good), explain whether the following events
would cause an increase or a decrease in demand or an increase or a decrease in the quantity
demanded. Also explain what happens to the equilibrium quantity and the market clearing price.
a. There are increases in carry cases for portable power banks.
b. There is a decrease in the price of devices used to charge portable power banks.
c. There is an increase in the number of consumers of portable power banks.
d. A booming economy increases the income of the typical buyer of portable power banks.
e. Consumers of portable power banks anticipate that the price of this good will decline in
the future.
a. Carry cases are complements in the consumption of portable power banks, so increases in their
42 Miller • Economics Today, Nineteenth Edition
c. An increase in number of consumers of portable power banks generates an increase in the
3-5. Give an example of a complement and a substitute in consumption for each of the following
items.
a. Bacon
b. Tennis racquets
c. Coffee
d. Automobiles
3-6. For each of the following shifts in the demand curve and associated price change of a
complement or substitute item, explain whether the price of the complement or substitute
must have increased or a decreased.
a. A rise in the demand for a dashboard global-positioning-system device follows a change
in the price of automobiles, which are complements.
b. A fall in the demand for e-book readers follows a change in the price of e-books, which
are complements.
c. A rise in the demand for tablet devices follows a change in the price of ultrathin laptop
computers, which are substitutes.
d. A fall in the demand for physical books follows a change in the price of e-books, which
are substitutes.
3-7. Identify which of the following would generate an increase in the market demand for tablet
devices, which are a normal good.
a. A decrease in the incomes of consumers of tablet devices
b. An increase in the price of ultrathin computers, which are substitutes
c. An increase in the price of online apps, which are complements
d. An increase in the number of consumers in the market for tablet devices
3-8. Identify which of the following would generate a decrease in the market demand for e-book
readers, which are a normal good.
a. An increase in the price of downloadable apps utilized to enhance the e-book reading
experience, which are complements
b. An increase in the number of consumers in the market for e-book readers
c. A decrease in the price of tablet devices, which are substitutes
d. A reduction in the incomes of consumers of e-book readers
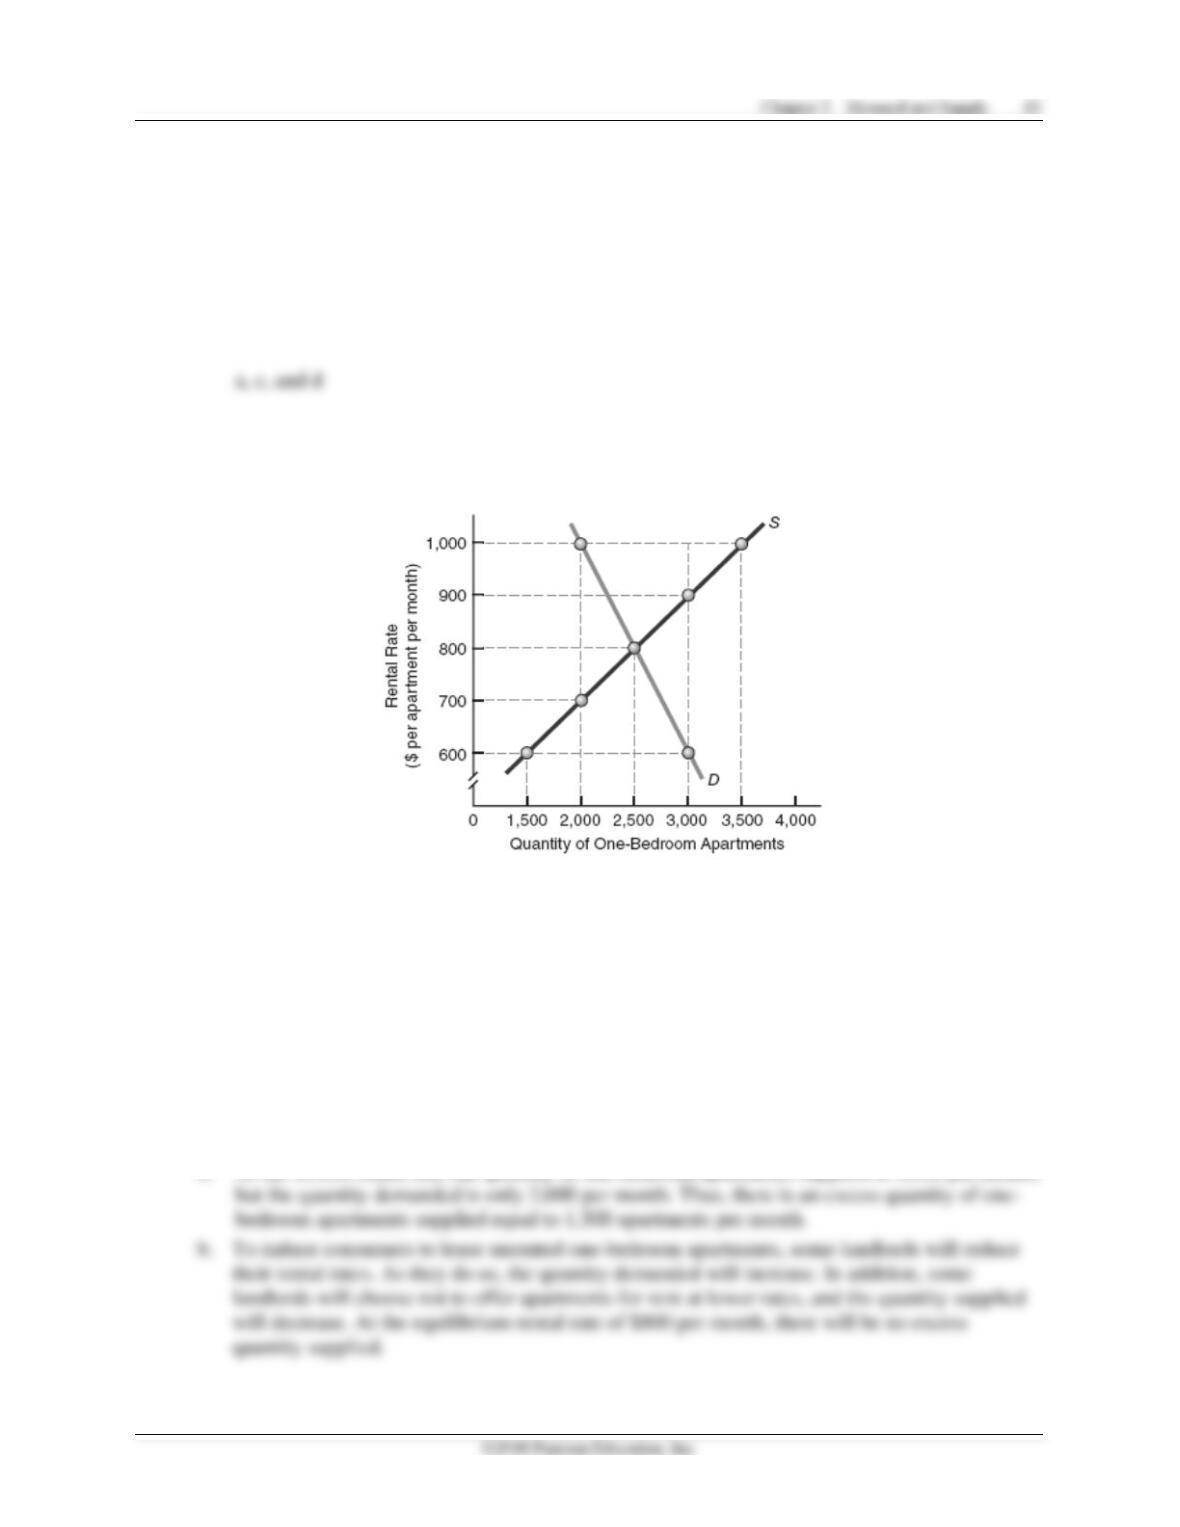
3-9. Consider the following diagram of a market for one–bedroom rental apartments in a college
community.
a. At a rental rate of $1,000 per month, is there an excess quantity supplied, or is there an
excess quantity demanded? What is the amount of the excess quantity supplied or
demanded?
b. If the present rental rate of one-bedroom apartments is $1,000 per month, through what
mechanism will the rental rate adjust to the equilibrium rental rate of $800?
c. At a rental rate of $600 per month, is there an excess quantity supplied, or is there an
excess quantity demanded? What is the amount of the excess quantity supplied or
demanded?
d. If the present rental rate of one-bedroom apartments is $600 per month, through what
mechanism will the rental rate adjust to the equilibrium rental rate of $800?
a. At the $1,000 rental rate, the quantity of one-bedroom apartments supplied is 3,500 per month,
3-10. Consider the market for paperbound economics textbooks. Explain whether the following
events would cause an increase or a decrease in supply or an increase or a decrease in the
quantity supplied.
a. The market price of paper increases.
b. The market price of economics textbooks increases.
c. The number of publishers of economics textbooks increases.
d. Publishers expect that the market price of economics textbooks will increase next month.
3-11. Consider the market for smartphones. Explain whether the following events would cause an
increase or a decrease in supply or an increase or a decrease in the quantity supplied.
Illustrate each, and show what would happen to the equilibrium quantity and the market
price.
a. The price of touch screens used in smartphones declines.
b. The price of machinery used to produce smartphones increases.
c. The number of manufacturers of smartphones increases.
d. There is a decrease in the market demand for smartphones.
a. Because touchscreens are an input in the production of smartphones, a decrease in the price
3-12. If the price of flash memory chips used in manufacturing smartphones decreases, what will
happen in the market for smartphones? How will the equilibrium price and equilibrium
quantity of smartphones change?
3-13. Assume that the cost of aluminum used by soft-drink companies increases. Which of the
following correctly describes the resulting effects in the market for soft drinks distributed in
aluminum cans? (More than one statement may be correct.)
a. The demand for soft drinks decreases.
b. The quantity of soft drinks demanded decreases.
c. The supply of soft drinks decreases.
d. The quantity of soft drinks supplied decreases.
3-14. In Figure 3-2, what are the effects of a price decrease from $4 per portable power bank to
$2 per portable power bank on the quantities of portable power banks demanded by buyer
1 and by buyer 2 individually and combined?
3-15. In Figure 3-2, what are the effects of a price increase from $1 per portable power bank
to $3 per portable power bank on the quantities demanded by buyer 1 and by buyer 2
individually and combined?
3-16. In figure 3-4, the current position of the demand curve is D1, and the price of a portable
power bank is $3. If there is an increase in the price of tablet devices that are complements to
portable power banks, will the demand curve shift to D2 or to D3? What is the change in the
amount of portable power bank demanded?
3-17. In figure 3-4, the current position of the demand curve is D1, and the price of a portable
power bank, which is a normal good, is $3. If there is an increase in consumer incomes, will
the demand curve shift to D2 or to D3? What is the change in the amount of portable power
banks demanded?
3-18. In Figure 3-7, what are the effects of a price decrease from $5 per portable power bank to
$3 per portable bank on the quantities supplied by supplier 1 and by supplier 2 individually
and combined?
3-19. In Figure 3-7, what are the effects of a price increase from $2 per portable power bank to
$4 per portable power bank on the quantities supplied by supplier 1 and by supplier 2
individually and combined?
3-20. In Figure 3-9, the current position of the supply curve is S1, and the price of a portable power
bank is $3. If suppliers anticipate a higher price of portable power banks in the future, will
the supply curve shift to S2 or to S3? What is the change in the amount of portable power
banks supplied?
3-21. In Figure 3-9, the current position of the supply curve is S1, and the price of a portable power
bank is $3. If the cost of inputs that suppliers utilize to produce portable power banks
decreases, will the supply curve shift to S2 or to S3? What is the change in the amount of
portable power banks supplied?

Chapter 3 Demand and Supply 47
◼ Selected References
Friedman, Milton, Capitalism and Freedom, The Heritage Foundation, 1979.