Answers and Solutions: 3 – 1
Chapter 3
Analysis of Financial Statements
ANSWERS TO END-OF-CHAPTER QUESTIONS
3-1 a. A liquidity ratio is a ratio that shows the relationship of a firm’s cash and other
current assets to its current liabilities. The current ratio is found by dividing current
assets by current liabilities. It indicates the extent to which current liabilities are
covered by those assets expected to be converted to cash in the near future. The
quick, or acid test, ratio is found by taking current assets less inventories and then
dividing by current liabilities.
b. Asset management ratios are a set of ratios that measure how effectively a firm is
c. Financial leverage ratios measure the use of debt financing. The debt ratio is the ratio
of total debt, which usually is the sum of notes payable and long-term bonds, to total
assets, it measures the percentage of assets financed by debtholders. The debt-to–
equity ratio is the total debt divided by the total common equity. The times-interest-
earned ratio is determined by dividing earnings before interest and taxes by the
interest charges. This ratio measures the extent to which operating income can
decline before the firm is unable to meet its annual interest costs. The EBITDA
coverage ratio is similar to the times-interest-earned ratio, but it recognizes that many
firms lease assets and also must make sinking fund payments. It is found by adding
EBITDA and lease payments then dividing this total by interest charges, lease
payments, and sinking fund payments over one minus the tax rate.
Answers and Solutions: 3 – 2
e. Market value ratios relate the firm’s stock price to its earnings and book value per
share. The price/earnings ratio is calculated by dividing price per share by earnings
g. The Du Pont equation is a formula, which shows that the rate of return on assets can
be found as the product of the profit margin times the total assets turnover. Window
dressing is a technique employed by firms to make their financial statements look
better than they really are. Seasonal factors can distort ratio analysis. At certain
times of the year a firm may have excessive inventories in preparation of a “season”
3-2 The emphasis of the various types of analysts is by no means uniform nor should it be.
Management is interested in all types of ratios for two reasons. First, the ratios point out
weaknesses that should be strengthened; second, management recognizes that the other
3-3 Given that sales have not changed, a decrease in the total assets turnover means that the
company’s assets have increased. Also, the fact that the fixed assets turnover ratio
remained constant implies that the company increased its current assets. Since the
company’s current ratio increased, and yet, its quick ratio is unchanged means that the
company has increased its inventories.
3-4 Differences in the amounts of assets necessary to generate a dollar of sales cause asset
turnover ratios to vary among industries. For example, a steel company needs a greater
3-5 a. Cash, receivables, and inventories, as well as current liabilities, vary over the year for
firms with seasonal sales patterns. Therefore, those ratios that examine balance sheet
figures will vary unless averages (monthly ones are best) are used.
3-6 Firms within the same industry may employ different accounting techniques, which make
it difficult to compare financial ratios. More fundamentally, comparisons may be
SOLUTIONS TO END-OF-CHAPTER PROBLEMS
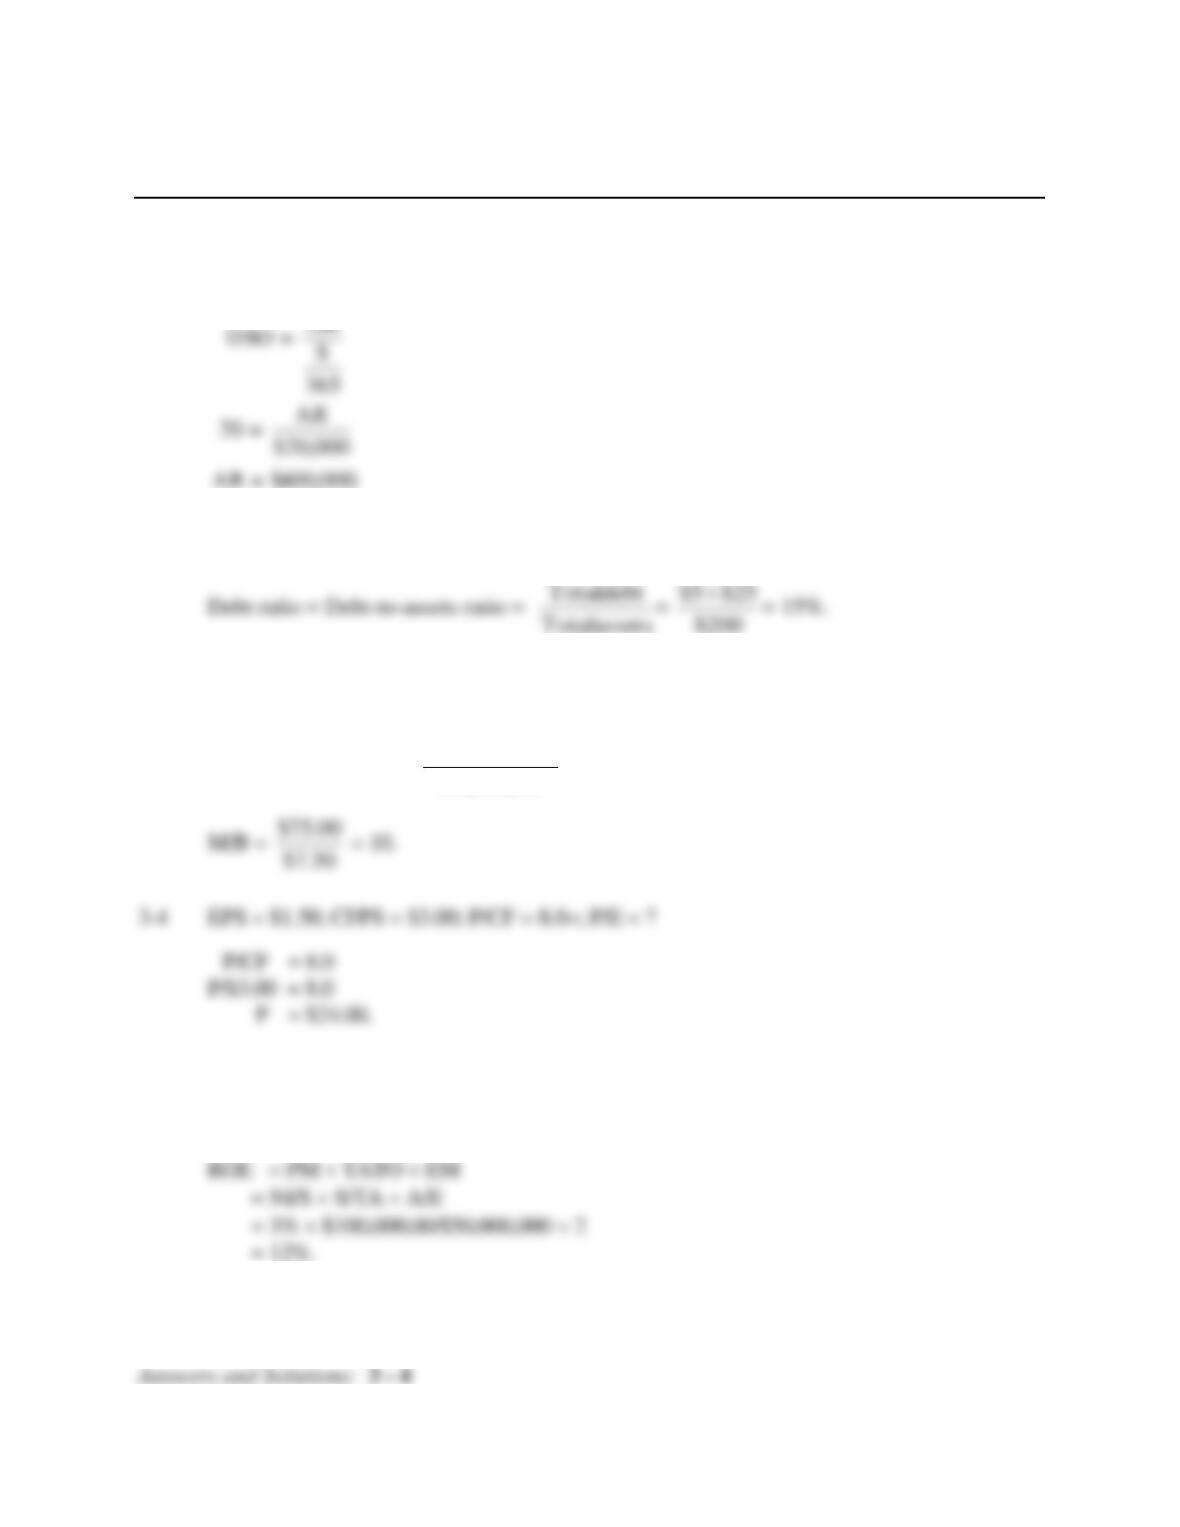
3-1 DSO = 20 days; ADS = $20,000; AR = ?
3-2 TA = $200 million, notes payable =$5 million, and LT debt = $25 million.
3-3 TA = $10,000,000,000; CL = $1,000,000,000; LT debt = $3,000,000,000; CE =
$6,000,000,000; Shares outstanding = 800,000,000; P0 = $75; M/B = ?
Book value per share =
000,000,800
000,000,000,6$
= $7.50.
P/E = $24.00/$1.50 = 16.0.
3-5 PM = 3%; EM = 2.0; Sales = $100,000,000; Assets = $50,000,000; ROE = ?
3-6 ROA = 12%; PM = 5%; ROE = 20%; S/TA = ?; A/E = ?
Answers and Solutions: 3 – 5
ROA = NI/A; PM = NI/S; ROE = NI/E
ROA = PM S/TA
NI/A = NI/S S/TA
12% = 5% S/TA
S/TA = 2.40.
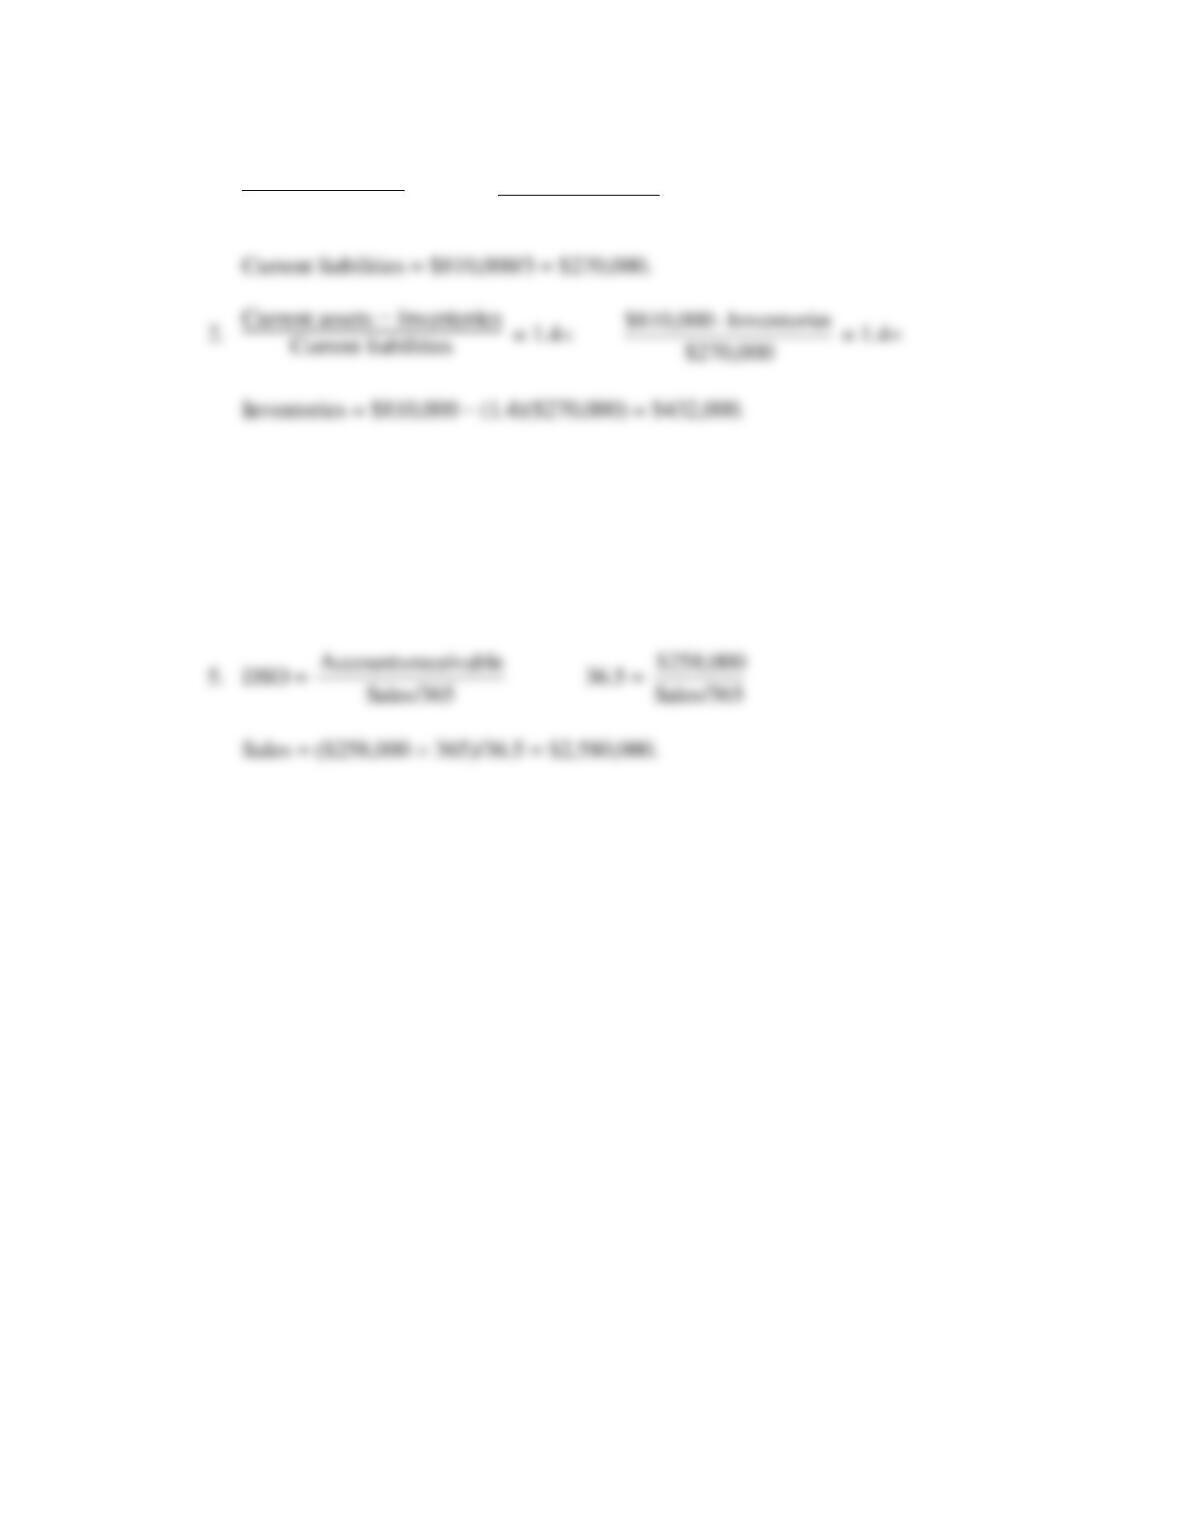
3-7 CA = $3,000,000;
CL
CA
= 1.5;
CL
I – CA
= 1.0;
CL = ?; I = ?
1.5 =
CL
CA
TA
L
Answers and Solutions: 3 – 6
3-8 We are given ROA = 4%, ROE = 7%, and TAT = Sales/Total assets = 1.2.
We can also calculate the company’s liabilities–to-assets (L/TA) ratio in a similar
manner, given the facts of the problem. We are given ROA = NI/TA and ROE= NI/E.
We begin by finding the percentage of assets financed by equity, E/TA:
ROA/ROE
ROE
1
ROA
NI
E
TA
NI
=
TA
E=
=
TA
E
= ROA/ROE = 4%/7% = 57.14%.
Answers and Solutions: 3 – 7
3-9 Present current ratio =
$525,000
$1,312,500
= 2.5.
Quick ratio = ($1,575,000 – $637,500)/$787,500 = $937,500/$787,500 = 1.19.
3-10 TIE = EBIT/INT, so find EBIT and INT.
Interest = $600,000 0.08 = $48,000.
Net income = $3,000,000 0.03 = $90,000.
Pre-tax income = $90,000/(1 – T) = $90,000/0.6 = $150,000.
3-11 1. Sales = (1.5)(Total assets) = (1.5)($400,000) = $600,000.
2. Cost of goods sold = (Sales)(1 – 0.25) = ($600,000)(0.75)
= $450,000.
= $110,000
7. Common stock =Total liabilities
and equity – TL – Retained earnings
= $400,000 – $160,000 – $100,000 = $140,000.
Answers and Solutions: 3 – 9
3-12 1. Current assets
Current liabilities = 3.0
sliabilitieCurrent
$810,000
= 3.0
3.
sInventorie +
receivable
Accounts
+
Securities
Marketable
+ Cash =
assets
Current
$810,000 = $120,000 + Accounts receivable + $432,000
Accounts receivable = $810,000 − $120,000 − $432,000 = $258,000.
Answers and Solutions: 3 – 10
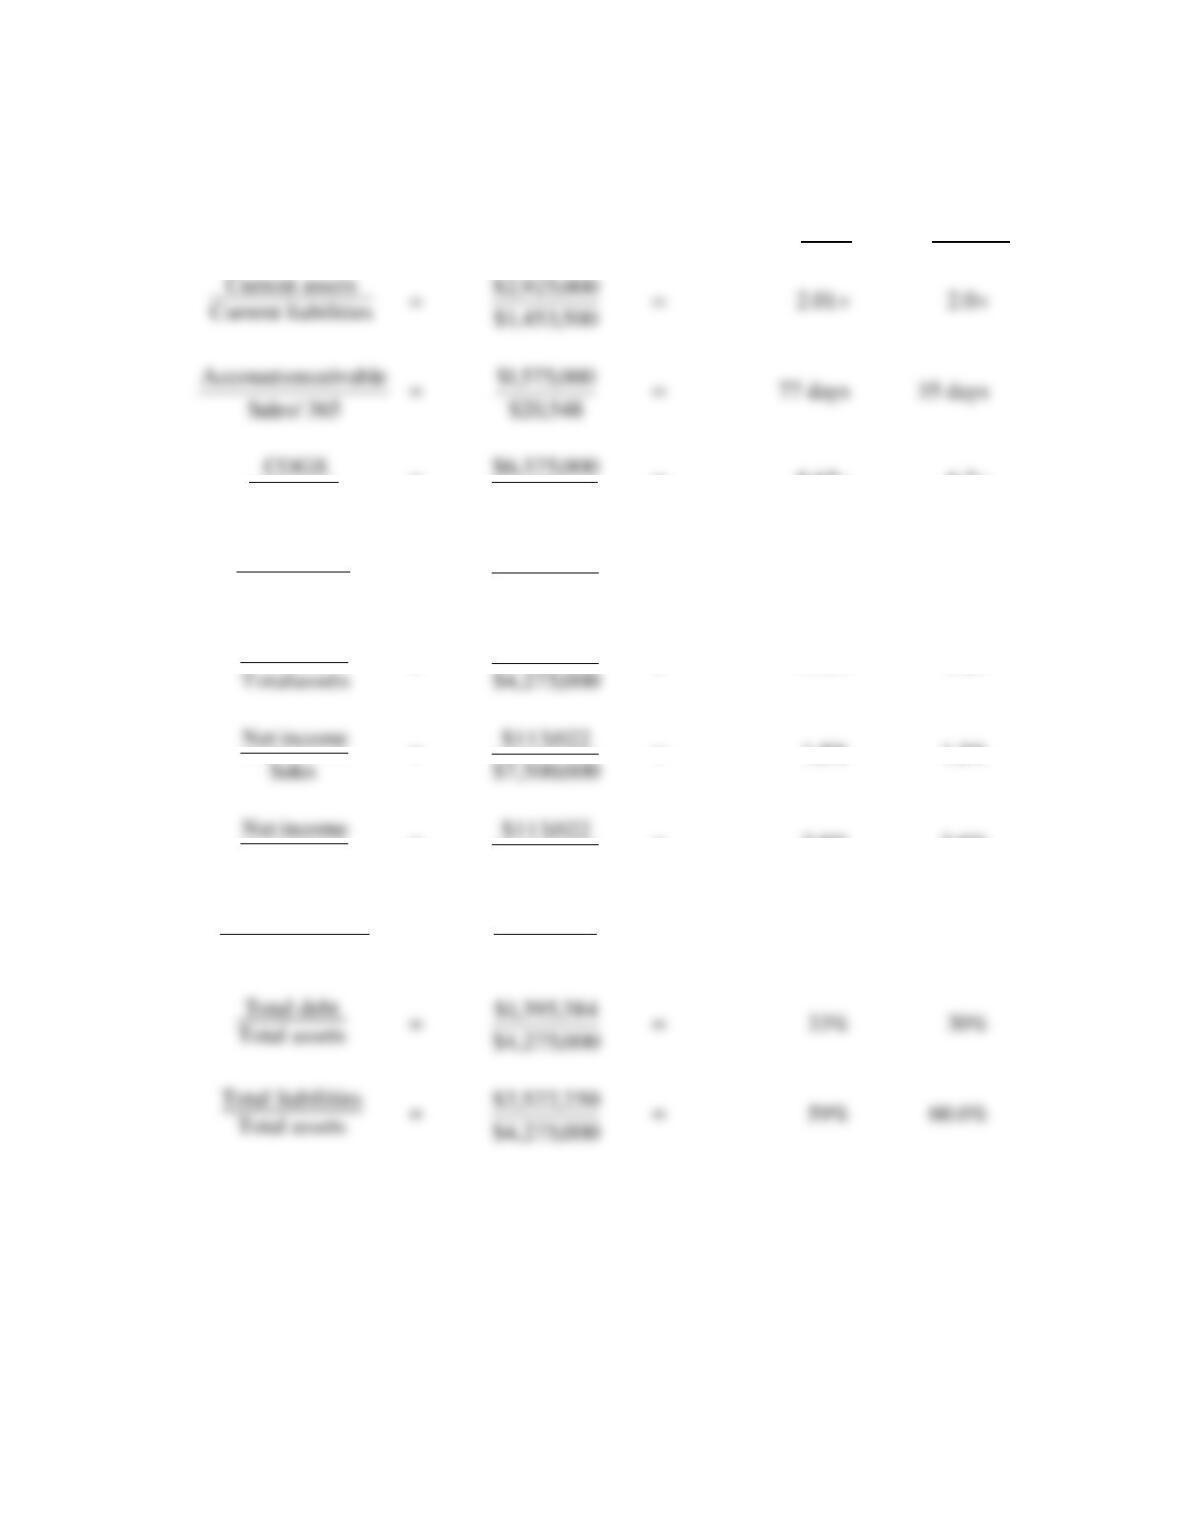
3-13 a. (Dollar amounts in thousands.)
Industry
Firm Average
Inventory
=
000,125,1$
= 5.67 6.7
assets Fixed
Sales
=
000,350,1$
000,500,7$
assets Total
000,275,4$
= 5.56 12.1
Sales
=
000,500,7$
000,500,7$
= 1.75 3.0
=
= 1.5% 1.2%
assets Total
=
000,275,4$
= 2.6% 3.6%
equity Common
incomeNet
=
750,752,1$
022,113$
000,275,4$
384,395,1$
000,275,4$
250,522,2$
= 6.4% 9.0%
000,375,6$
Answers and Solutions: 3 – 11
b. For the firm,
ROE = PM T.A. turnover EM = 1.51% 1.75
000,275,4$
= 6.45%.
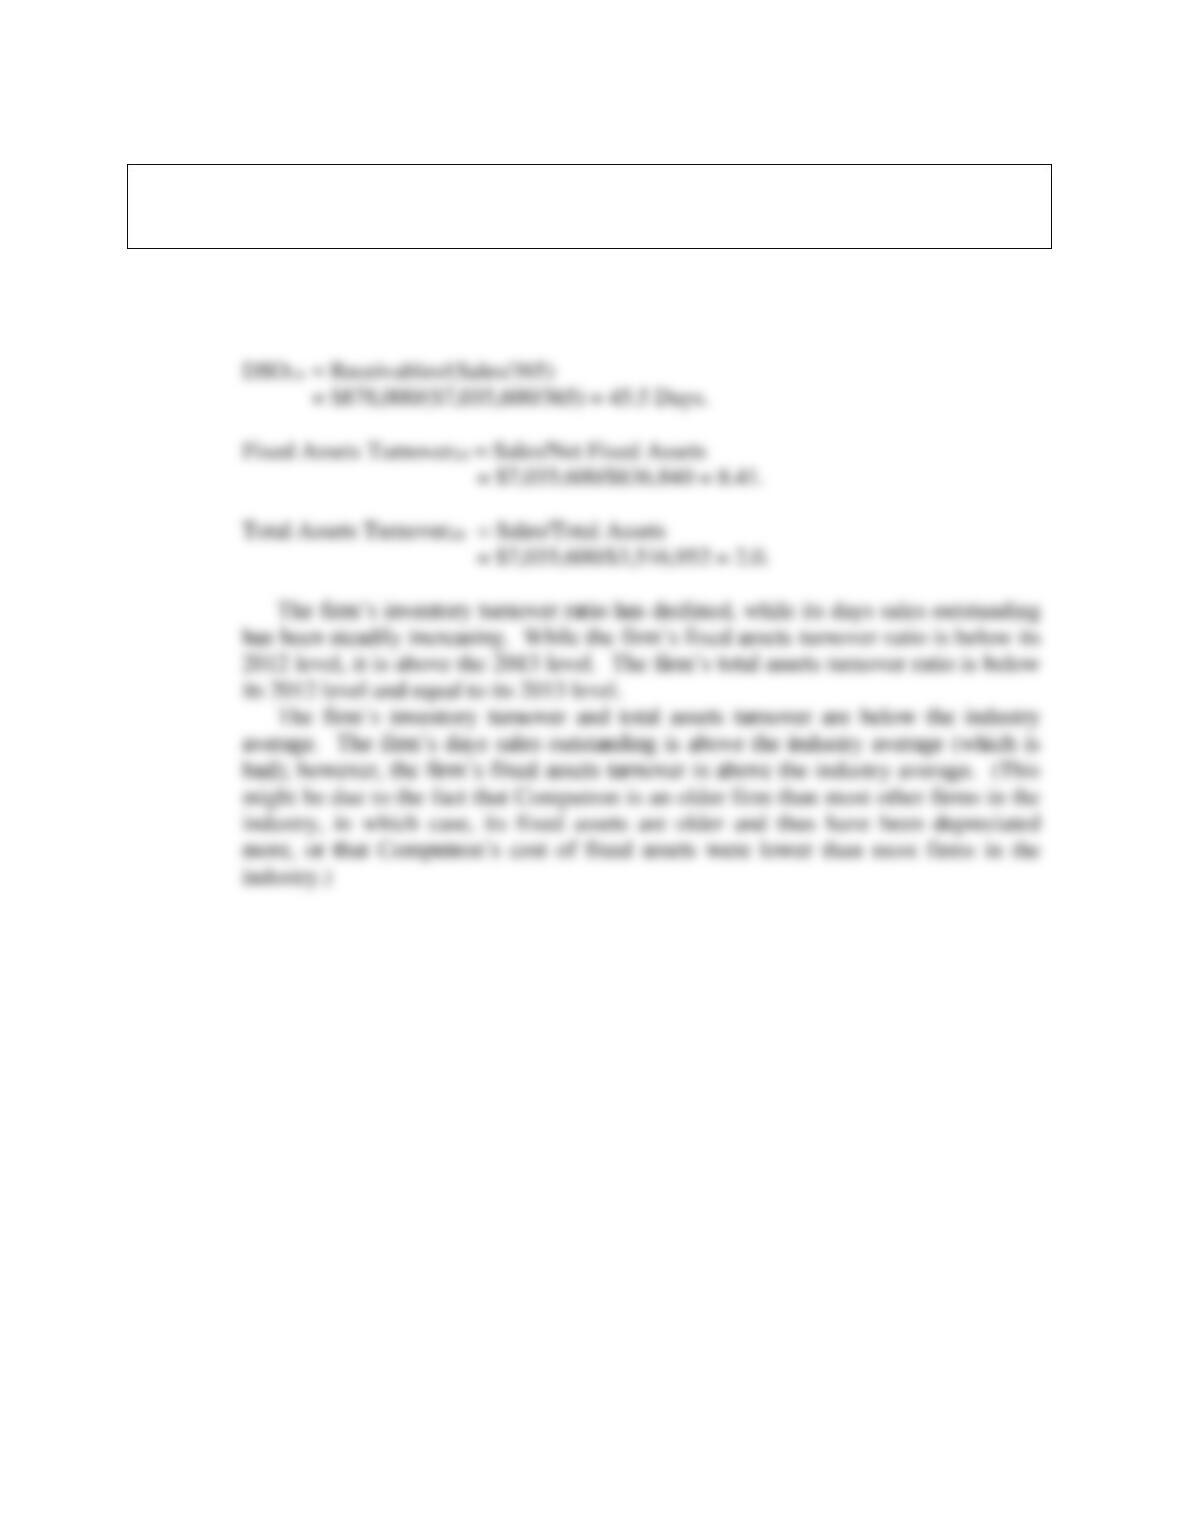
c. The firm’s days sales outstanding is more than twice as long as the industry average,
indicating that the firm should tighten credit or enforce a more stringent collection
policy. The total assets turnover ratio is well below the industry average so sales
Answers and Solutions: 3 – 12
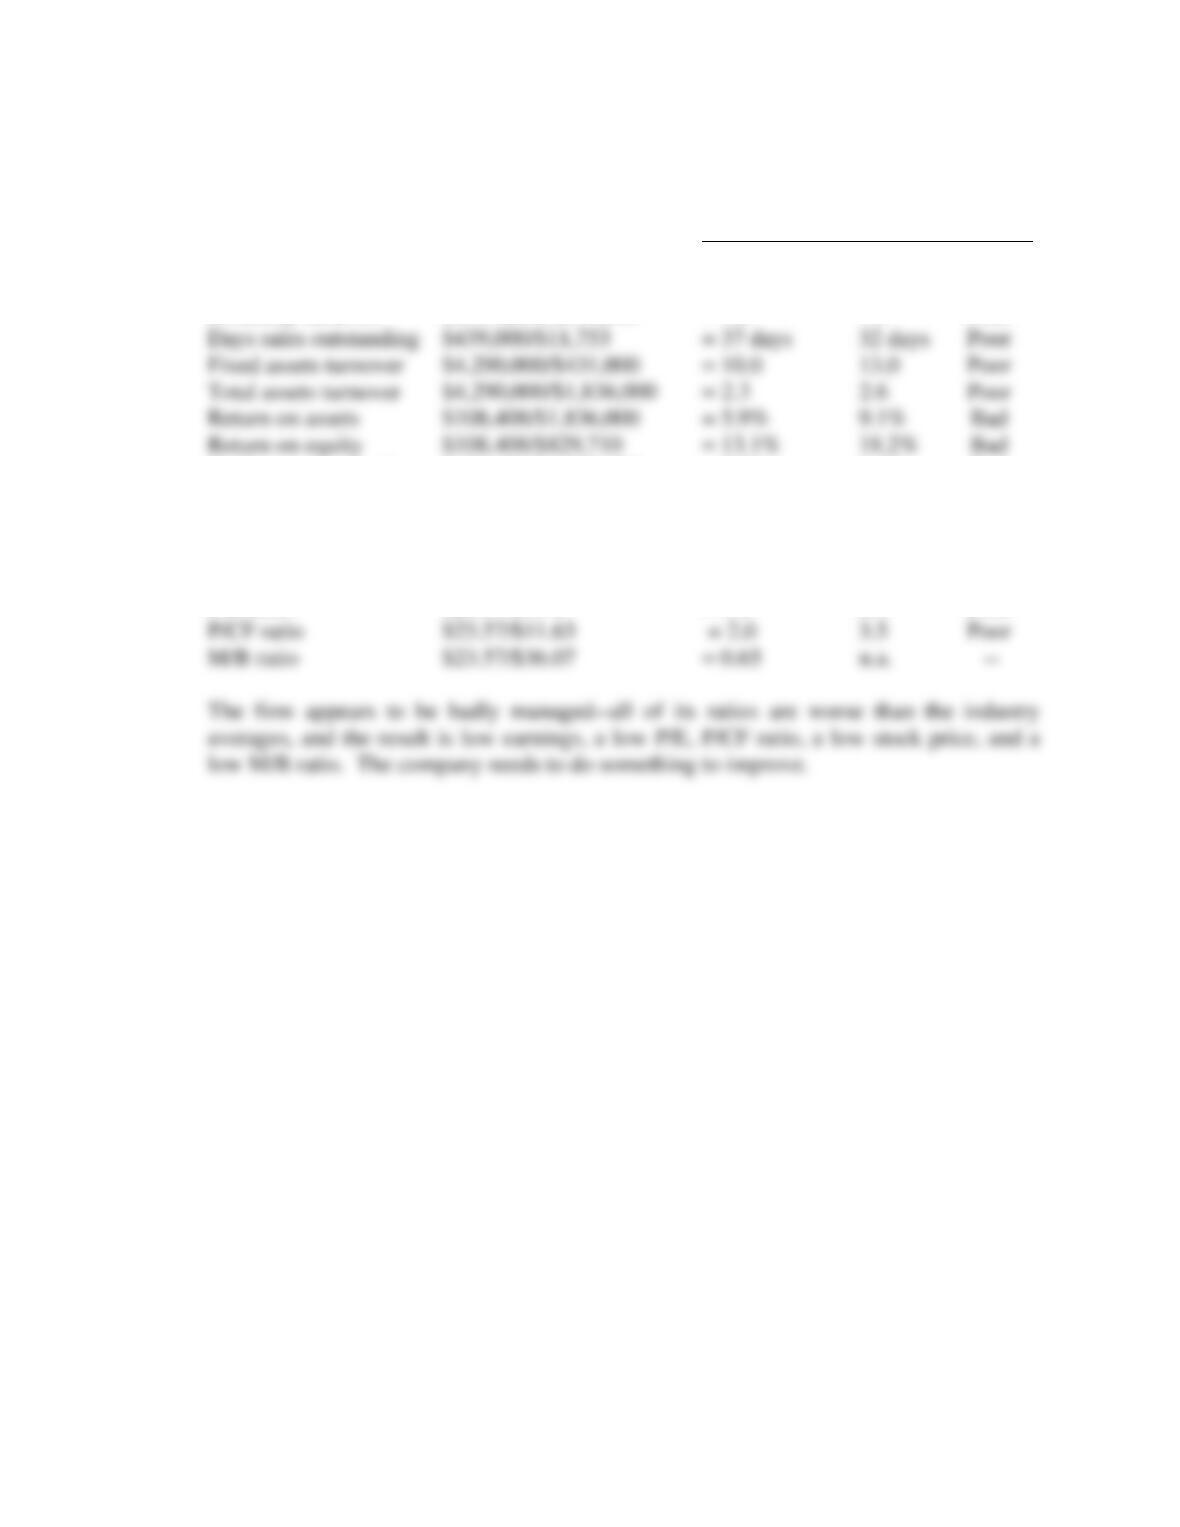
3-14 Here are the firm’s base case ratios and other data as compared to the industry:
Firm Industry Comment
Quick $511,000/$602,000 = 0.8 1.0 Weak
Current $1,405,000/$602,000 = 2.3 2.7 Weak
Inventory turnover $3,739,000/$894,000 = 4.2 7.0 Poor
Profit margin on sales $108,408/$4,290,000 = 2.5% 3.5% Bad
Debt ratio $504,290/$1,836,000 = 27.5% 21.0% High
Liabilities-to-assets $1,006,290/$1,836,000 = 54.8% 50.0% High
EPS $4.71 n.a. —
Stock Price $23.57 n.a. —
P/E ratio $23.57/$4.71 = 5.0 6.0 Poor

Answers and Solutions: 3 – 13
SOLUTION TO SPREADSHEET PROBLEM
3-15 The detailed solution for the problem is available is in the file Ch03 P15 Build a Model
Mini Case: 3 – 14
MINI CASE
The first part of the case, presented in Chapter 3, discussed the situation of Computron
Industries after an expansion program. A large loss occurred in 2013, rather than the
expected profit. As a result, its managers, directors, and investors are concerned about the
firm’s survival.
Jenny Cochran was brought in as assistant to Gary Meissner, Computron’s chairman,
who had the task of getting the company back into a sound financial position. Computron’s
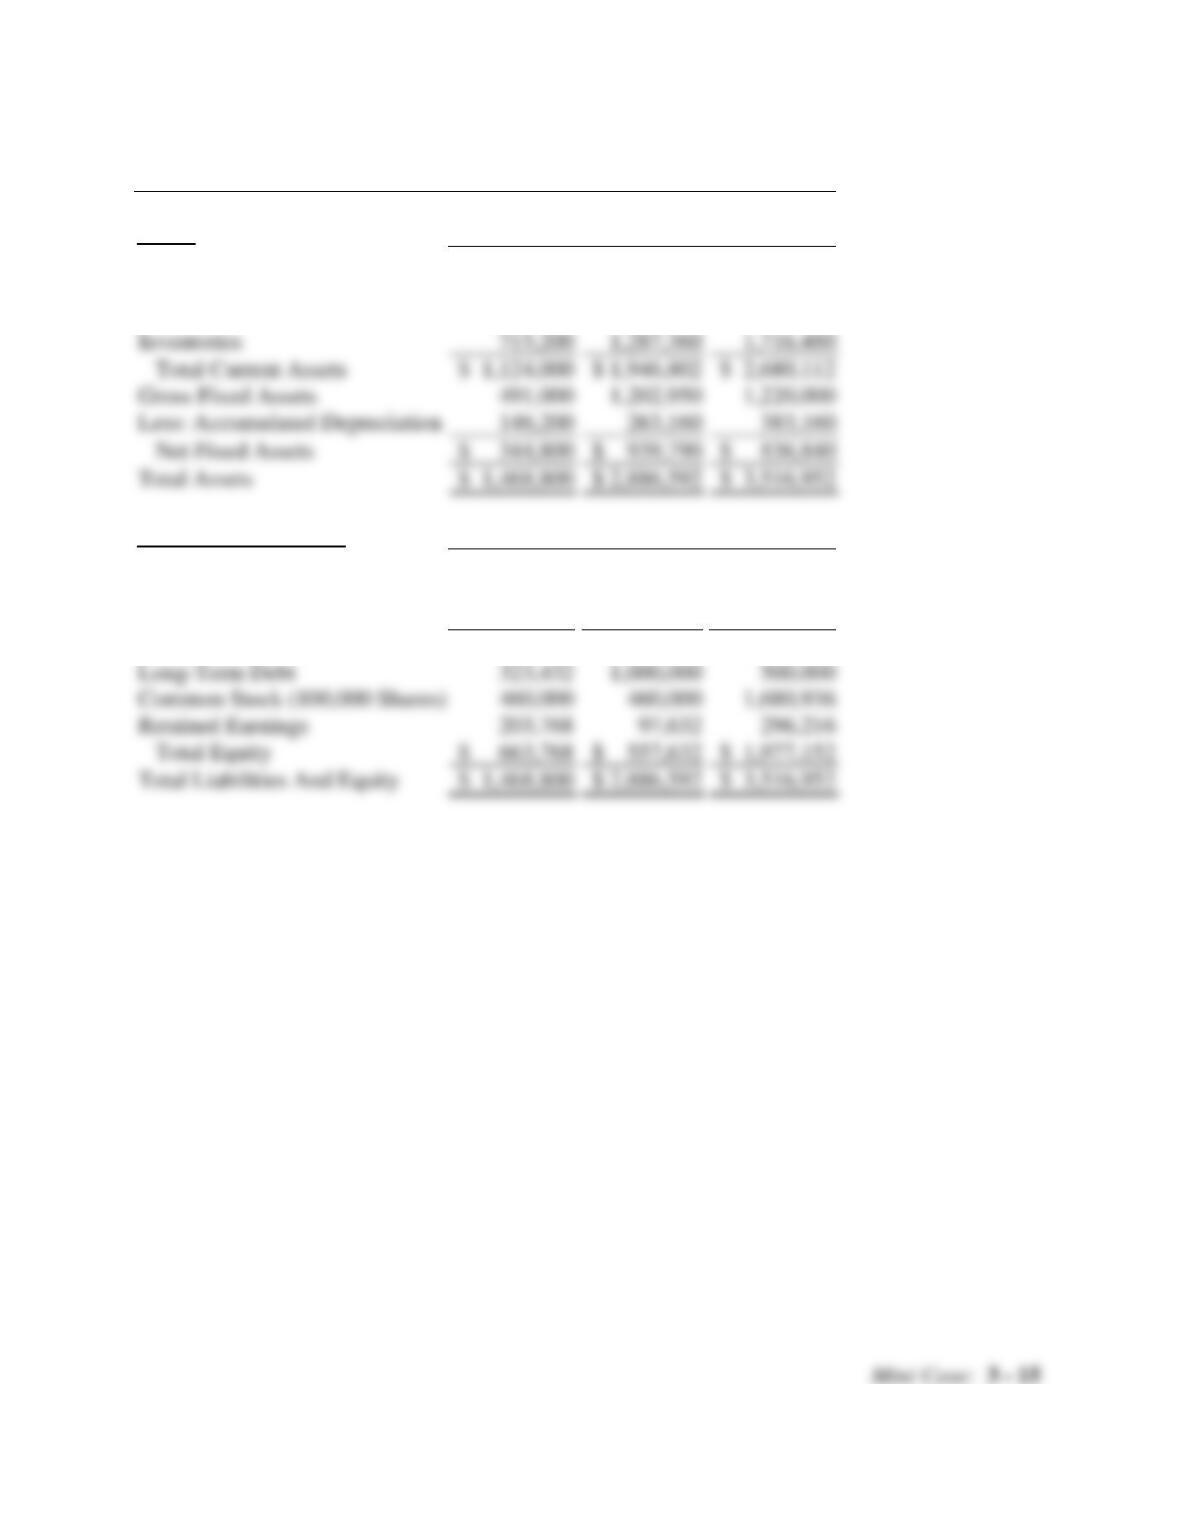
Balance Sheets
Assets
2012
2013
2014e
Cash
$ 9,000
$ 7,282
$ 14,000
Short-Term Investments.
48,600
20,000
71,632
Accounts Receivable
351,200
632,160
878,000
Inventories
715,200
Total Current Assets
$ 1,124,000
$ 1,946,802
$ 2,680,112
Gross Fixed Assets
491,000
Less: Accumulated Depreciation
146,200
263,160
383,160
Net Fixed Assets
$ 344,800
$ 939,790
$ 836,840
Total Assets
$ 1,468,800
$ 2,886,592
$ 3,516,952
Liabilities And Equity
2011
2012
2013e
Accounts Payable
$ 145,600
$ 324,000
$ 359,800
Notes Payable
200,000
720,000
300,000
Accruals
136,000
284,960
380,000
Total Current Liabilities
$ 481,600
$ 1,328,960
$ 1,039,800
Long-Term Debt
323,432
500,000
Common Stock (100,000 Shares)
460,000
460,000
Retained Earnings
203,768
97,632
296,216
Total Equity
$ 663,768
$ 557,632
$ 1,977,152
Total Liabilities And Equity
$ 1,468,800
$ 2,886,592
$ 3,516,952
Mini Case: 3 – 16
Income Statements
2012
2013
2014e
Sales
$ 3,432,000
$ 5,834,400
$ 7,035,600
COGS except depr.
2,864,000
4,980,000
5,800,000
Depreciation
18,900
116,960
120,000
Other Expenses
340,000
720,000
612,960
Total Operating Costs
$ 3,222,900
$ 5,816,960
$ 6,532,960
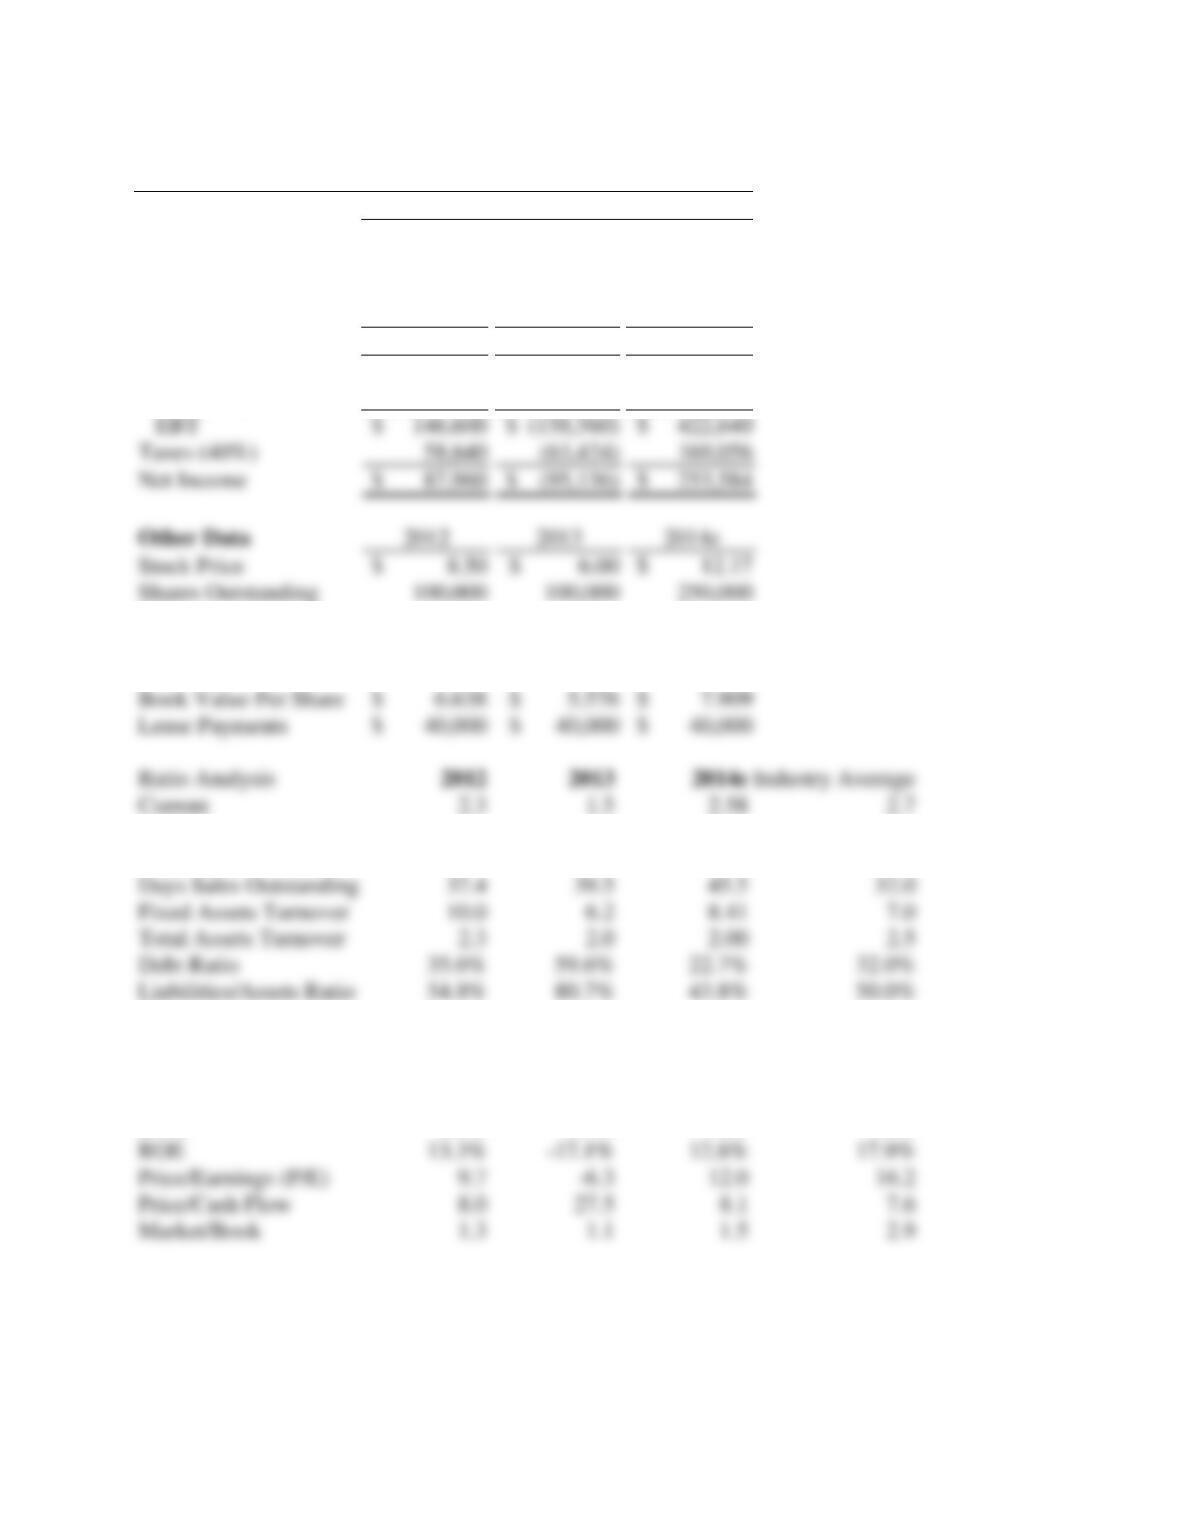
EBIT
$ 209,100
$ 17,440
$ 502,640
Interest Expense
62,500
176,000
80,000
EPS
$ 0.880
$ (0.951)
$ 1.014
DPS
$ 0.220
$ 0.110
$ 0.220
Tax Rate
40%
40%
40%
Book Value Per Share
$ 6.638
$ 5.576
$ 7.909
Lease Payments
$ 40,000
$ 40,000
$ 40,000
Ratio Analysis
Industry Average
Current
2.3
1.5
2.58
2.7
Quick
0.8
0.5
0.93
1.0
Inventory Turnover
4.0
4.0
3.45
6.1
Days Sales Outstanding
37.4
39.5
32.0
Fixed Assets Turnover
10.0
6.2
8.41
7.0
Total Assets Turnover
2.3
2.0
2.00
2.5
Debt Ratio
35.6%
22.7%
32.0%
Liabilities/Assets Ratio
54.8%
43.8%
50.0%
TIE
3.3
0.1
6.3
6.2
EBITDA Coverage
2.6
0.8
5.5
8.0
Profit Margin
2.6%
-1.6%
3.6%
3.6%
Basic Earning Power
14.2%
0.6%
14.3%
17.8%
ROA
6.0%
-3.3%
7.2%
9.0%
ROE
13.3%
12.8%
17.9%
Price/Earnings (P/E)
9.7
-6.3
12.0
Price/Cash Flow
8.0
8.1
7.6
Market/Book
1.3
1.1
1.5
2.9
EBT
$ 146,600
$ (158,560)
$ 422,640
Taxes (40%)
58,640
169,056
Net Income
$ 87,960
$ (95,136)
$ 253,584
Other Data
2012
2013
2014e
Stock Price
$ 8.50
$ 6.00
$ 12.17
Shares Outstanding
100,000
100,000
250,000
Mini Case: 3 – 17
a. Why are ratios useful? What three groups use ratio analysis and for what
reasons?
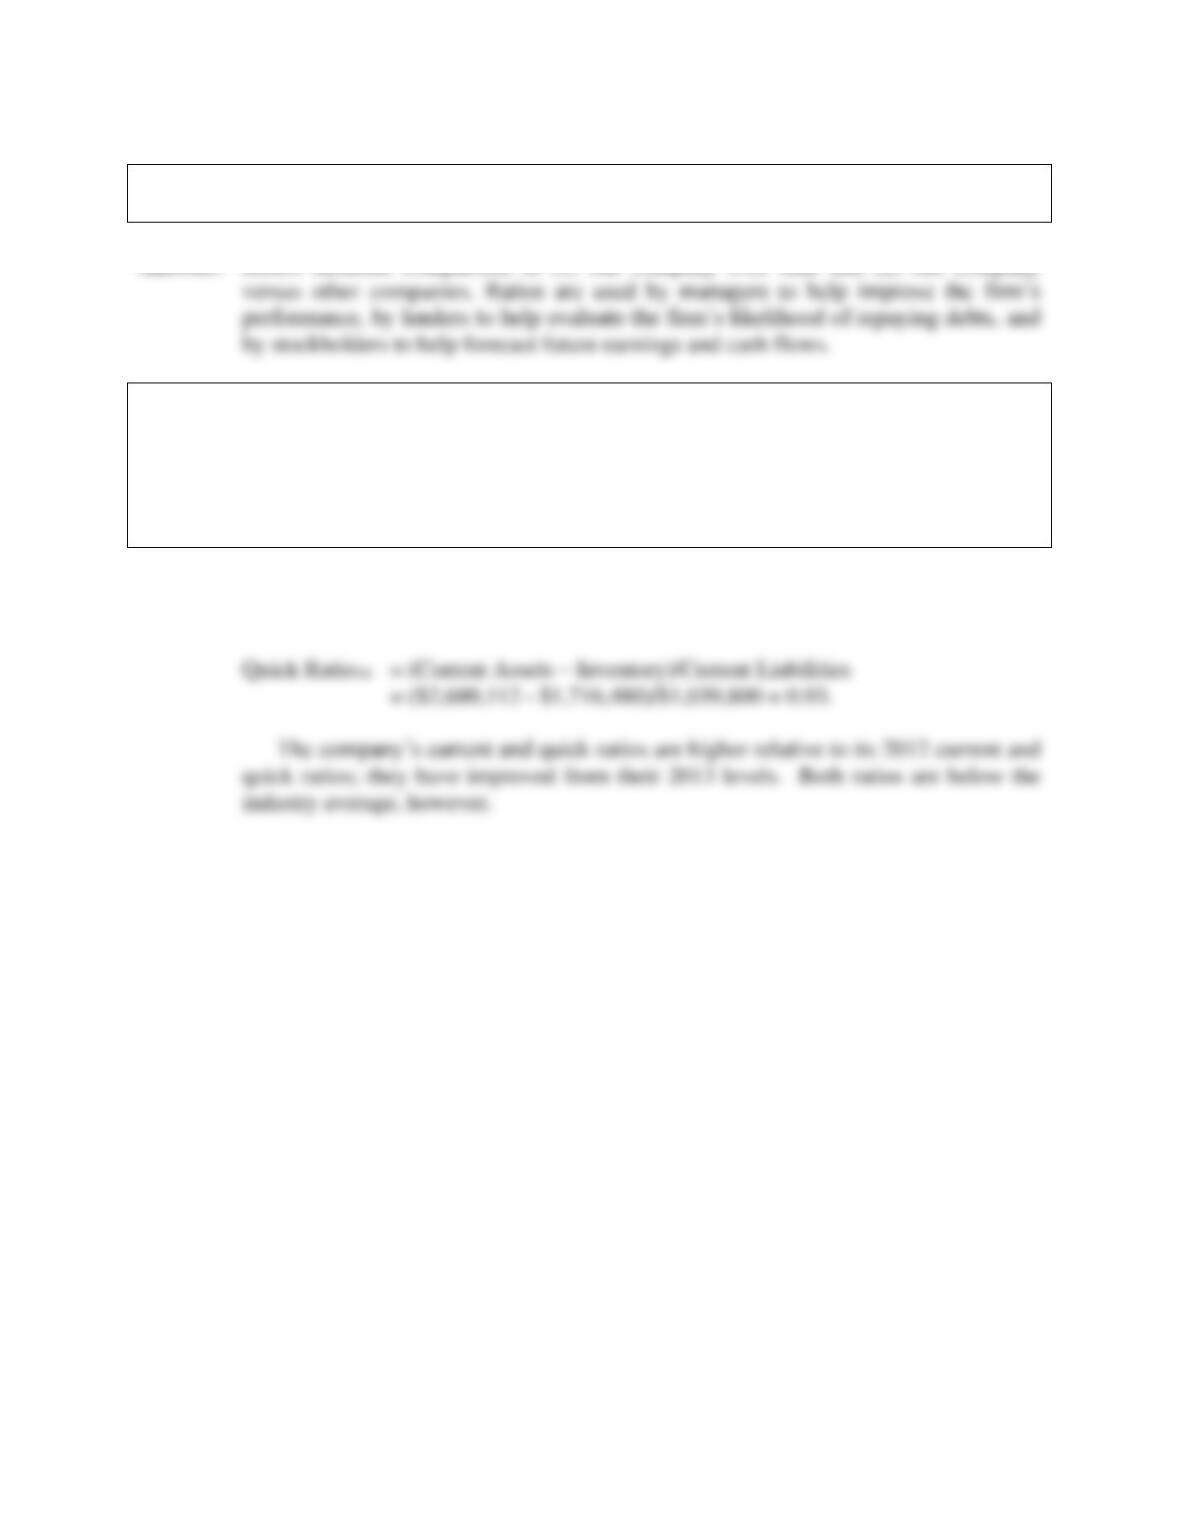
Answer: Ratios facilitate comparison of (1) one company over time and (2) one company
b. Calculate the 2014 current and quick ratios based on the projected balance sheet
and income statement data. What can you say about the company’s liquidity
position in 2012, 2013, and as projected for 2014? We often think of ratios as
being useful (1) to managers to help run the business, (2) to bankers for credit
analysis, and (3) to stockholders for stock valuation. Would these different types
of analysts have an equal interest in the liquidity ratios?
Answer: Current Ratio14 = Current Assets/Current Liabilities
= $2,680,112/$1,039,800 = 2.58.
Mini Case: 3 – 18
c. Calculate the 2014 inventory turnover, days sales outstanding (DSO), fixed
assets turnover, and total assets turnover. How does Computron’s utilization of
assets stack up against other firms in its industry?
Answer: Inventory Turnover14 = COGS/Inventory
= ($5,800,000 + $120,000)/$1,716,480= 3.45.
Mini Case: 3 – 19
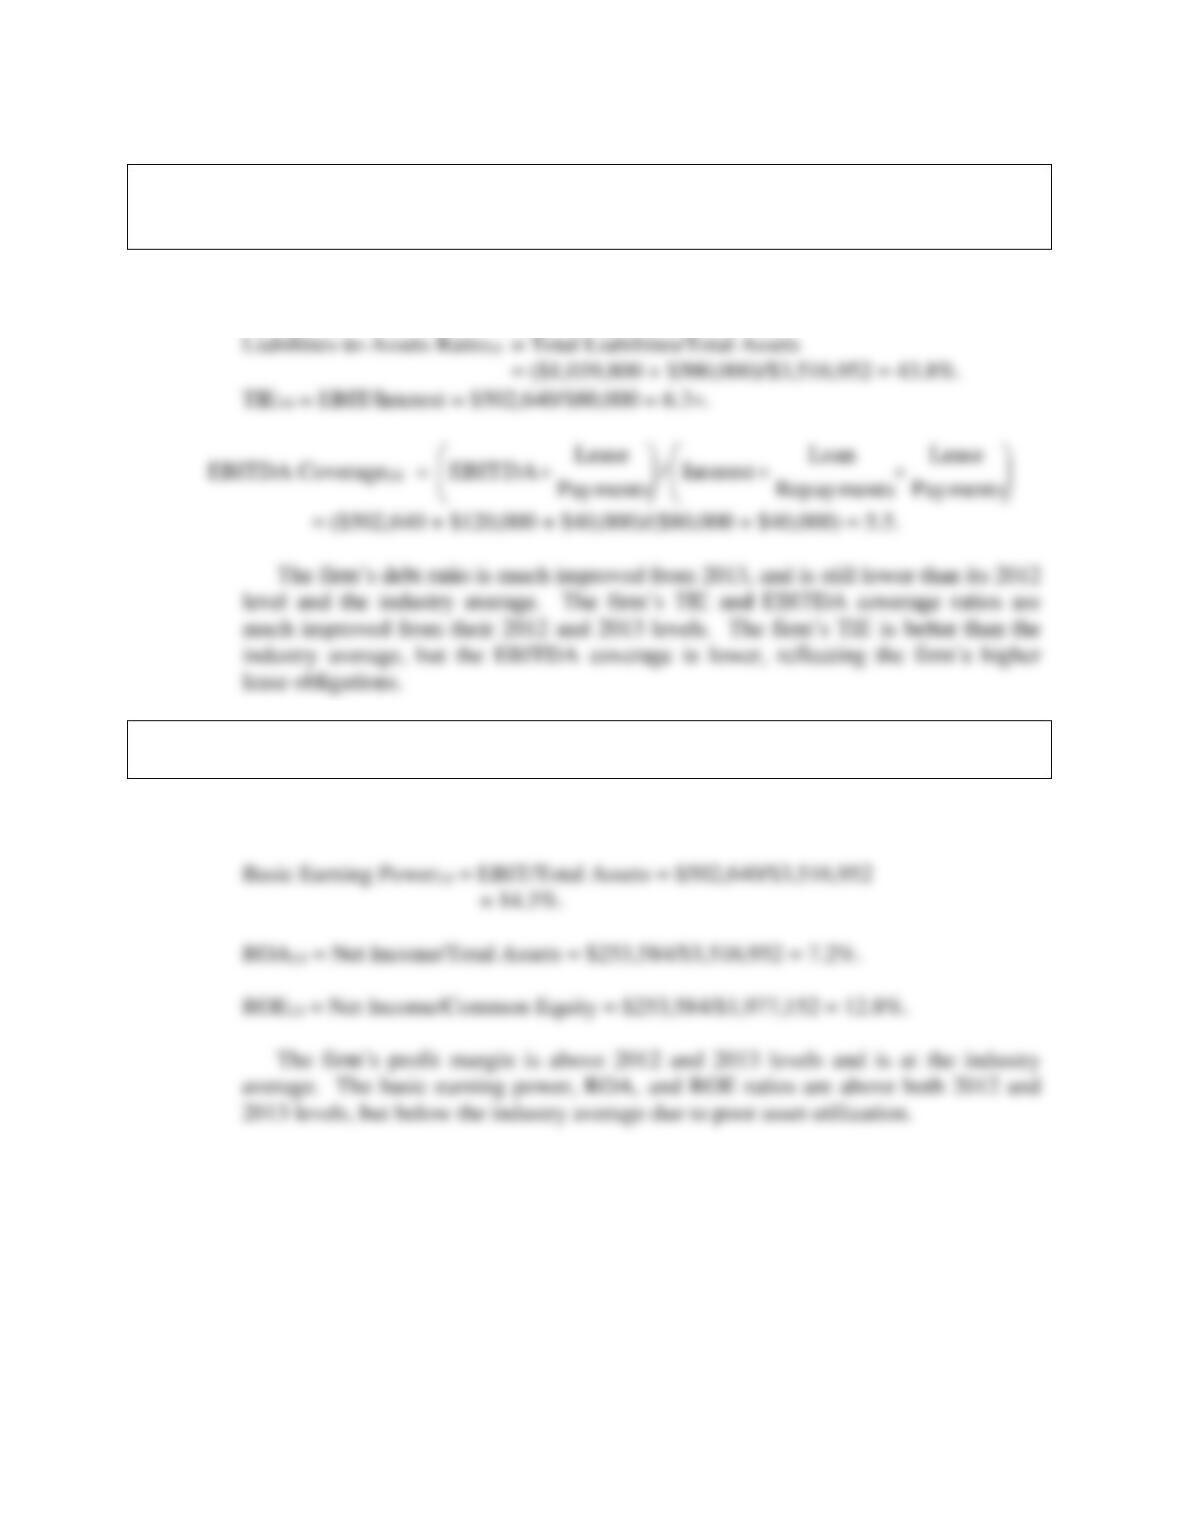
d. Calculate the 2014 debt ratio, liabilities-to-assets ratio, times-interest-earned,
and EBITDA coverage ratios. How does Computron compare with the industry
with respect to financial leverage? What can you conclude from these ratios?
Answer: Debt Ratio14 = Total Debt/Total Assets
= ($300,000+ $500,000)/$3,516,952 = 22.7%.
e. Calculate the 2014 profit margin, basic earning power (BEP), return on assets
(ROA), and return on equity (ROE). What can you say about these ratios?
Answer: Profit Margin14 = Net Income/Sales = $253,584/$7,035,600 = 3.6%.
Mini Case: 3 – 20
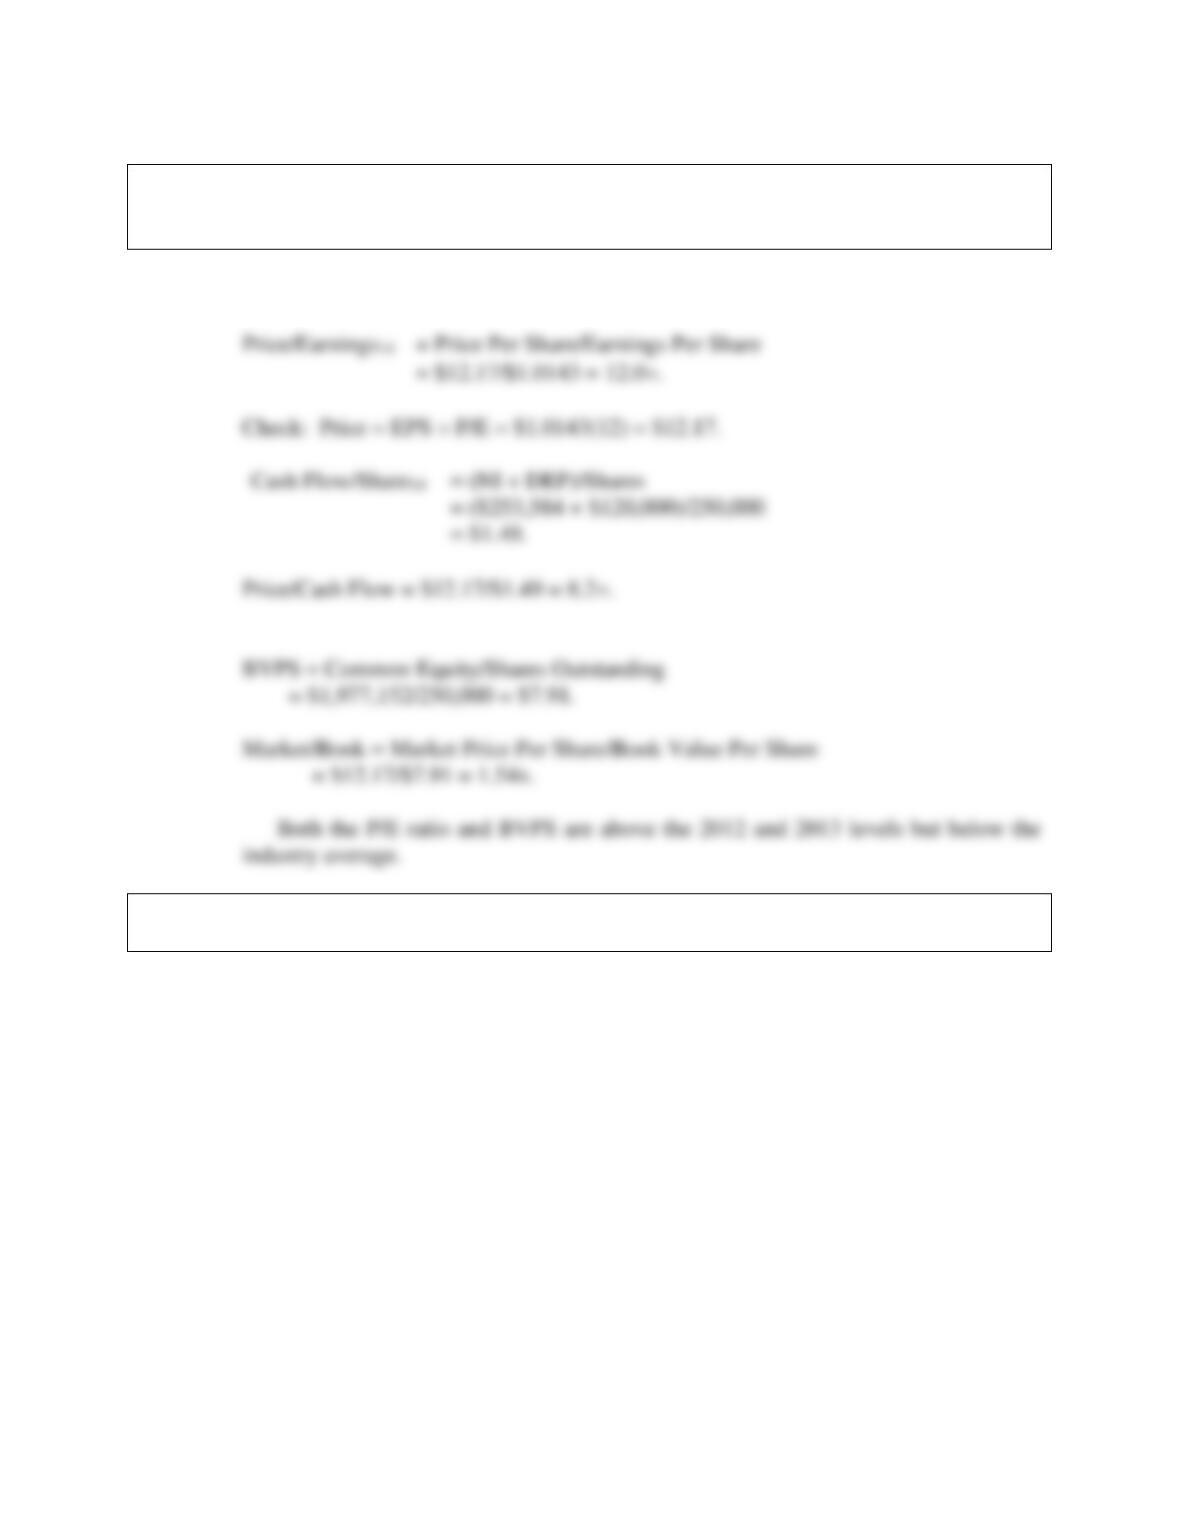
f. Calculate the 2014 price/earnings ratio, price/cash flow ratios, and market/book
ratio. Do these ratios indicate that investors are expected to have a high or low
opinion of the company?
Answer: EPS = Net Income/Shares Outstanding = $253,584/250,000 = $1.0143.
Price/Earnings14 = Price Per Share/Earnings Per Share
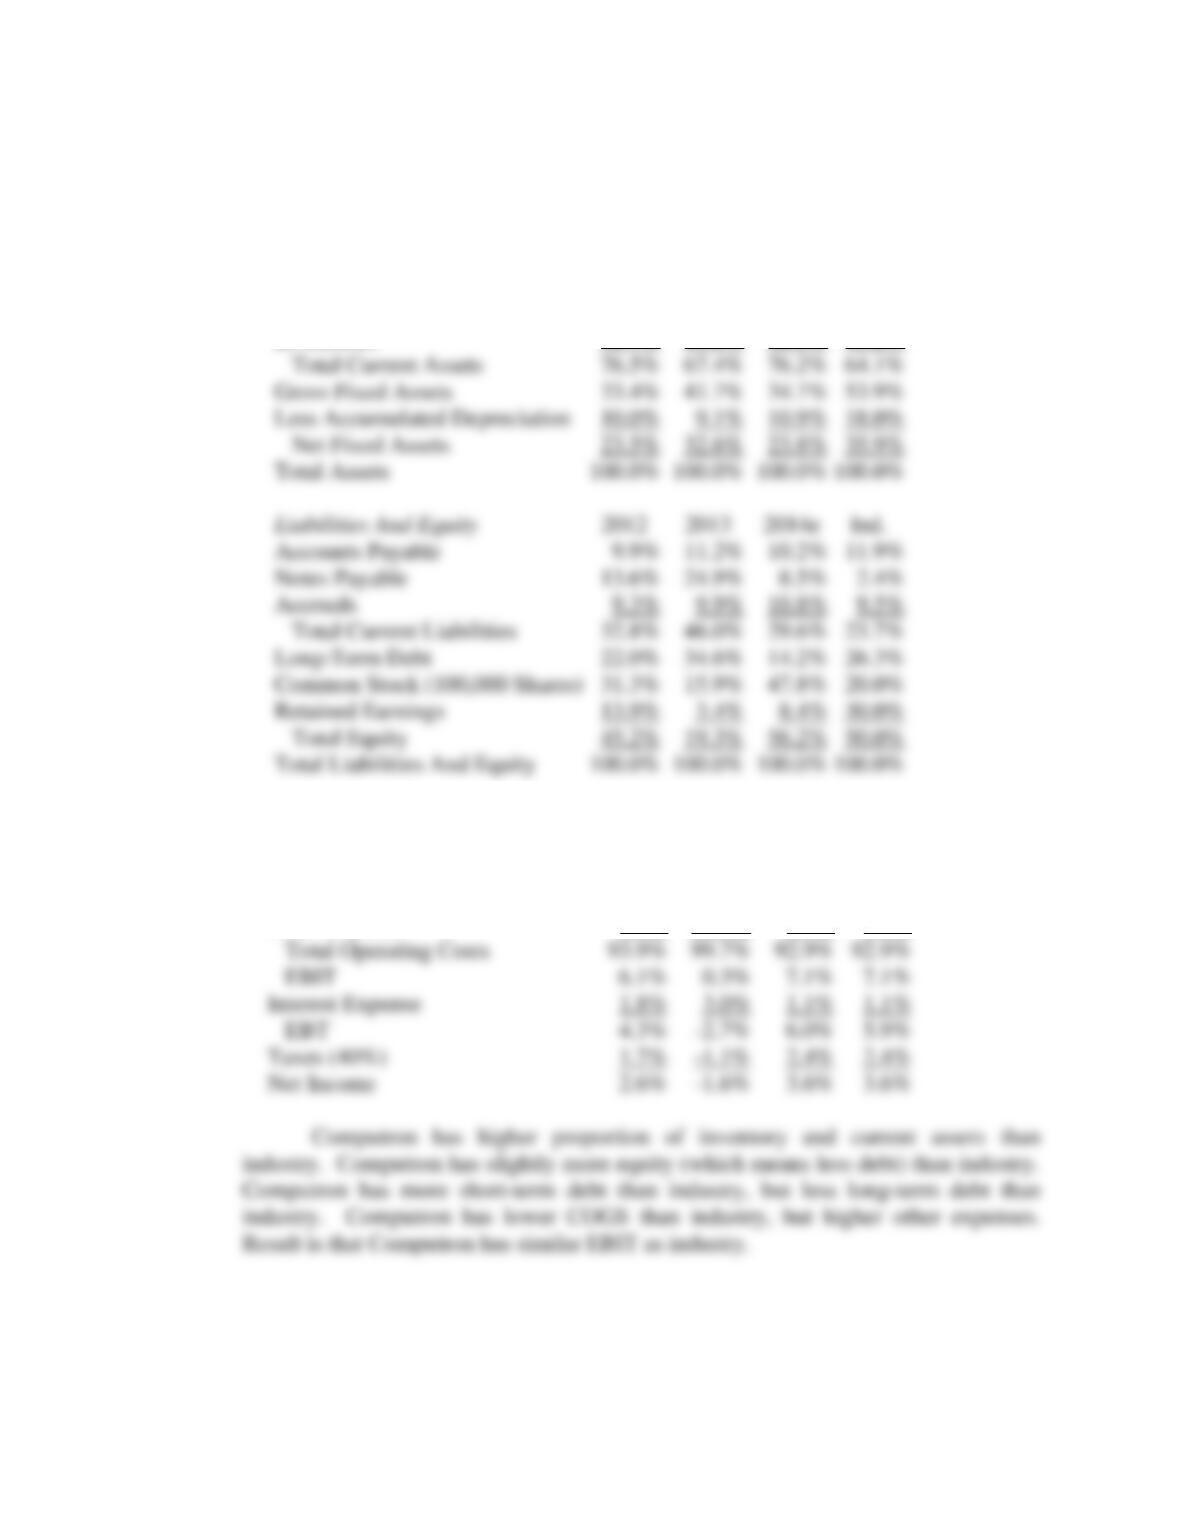
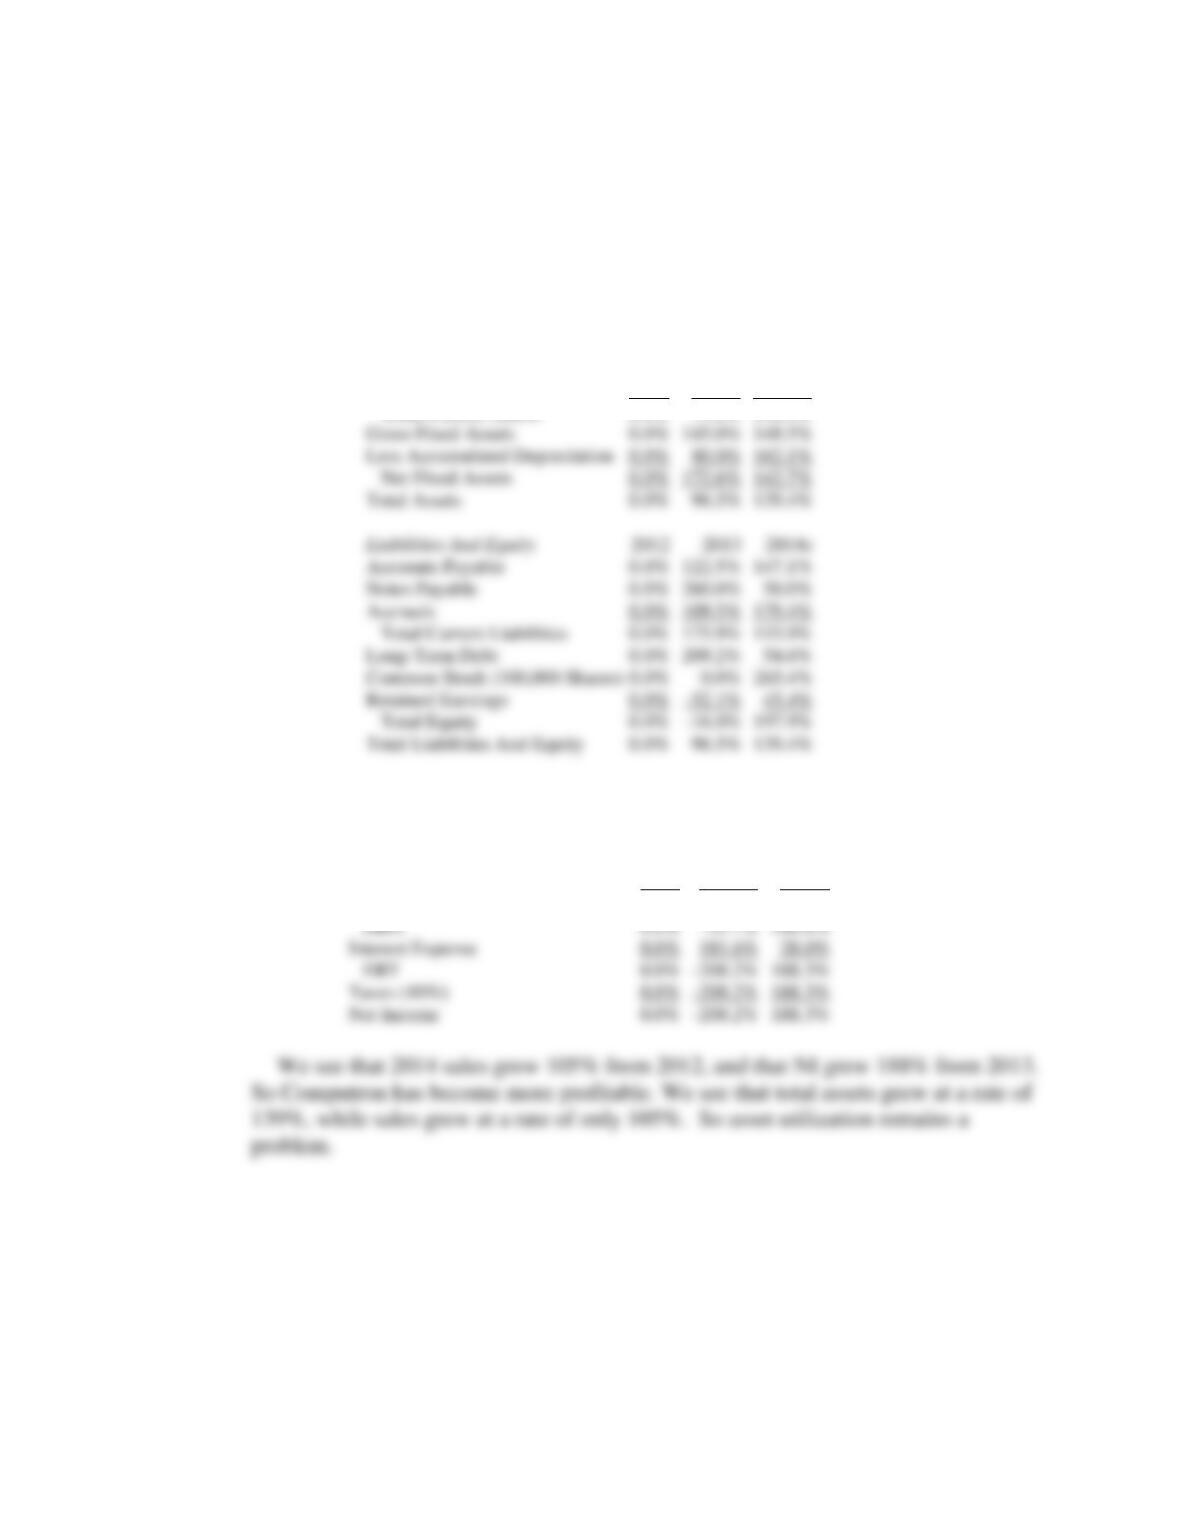
g. Perform a common size analysis and percent change analysis. What do these
analyses tell you about Computron?
Answer: For the common size balance sheets, divide all items in a year by the total assets for
that year. For the common size income statements, divide all items in a year by the
sales in that year.
Mini Case: 3 – 21
Common Size Balance Sheets
Assets
2012
2013
2014e
Ind.
Cash
0.6%
0.3%
0.4%
0.3%
Short Term Investments
3.3%
0.7%
2.0%
0.3%
Accounts Receivable
23.9%
21.9%
25.0%
22.4%
Inventories
48.7%
44.6%
48.8%
41.2%
Common Size Income Statement
2012
2013
2014e
Ind.
Sales
100.0%
100.0%
100.0%
100.0%
Cost Of Goods Sold
83.4%
85.4%
82.4%
84.5%
Depreciation
0.6%
2.0%
1.7%
4.0%
Other Expenses
9.9%
12.3%
8.7%
4.4%
Total Operating Costs
93.9%
99.7%
92.9%
92.9%
EBIT
6.1%
0.3%
7.1%
7.1%
Interest Expense
1.8%
3.0%
1.1%
1.1%
EBT
4.3%
6.0%
5.9%
Taxes (40%)
1.7%
2.4%
2.4%
Net Income
2.6%
3.6%
3.6%
Total Current Assets
76.5%
67.4%
76.2%
64.1%
Gross Fixed Assets
33.4%
41.7%
34.7%
53.9%
Less Accumulated Depreciation
10.0%
9.1%
10.9%
18.0%
Net Fixed Assets
23.5%
32.6%
23.8%
35.9%
Total Assets
100.0%
100.0%
100.0%
100.0%
Liabilities And Equity
2012
2013
2014e
Ind.
Accounts Payable
9.9%
11.2%
10.2%
11.9%
Notes Payable
13.6%
24.9%
8.5%
2.4%
Accruals
9.3%
9.9%
10.8%
9.5%
Total Current Liabilities
32.8%
46.0%
29.6%
23.7%
Long-Term Debt
22.0%
34.6%
14.2%
26.3%
Common Stock (100,000 Shares)
31.3%
15.9%
47.8%
20.0%
Retained Earnings
13.9%
3.4%
8.4%
30.0%
Total Equity
45.2%
19.3%
56.2%
50.0%
Total Liabilities And Equity
100.0%
100.0%
100.0%
100.0%
Mini Case: 3 – 22
For the percent change analysis, divide all items in a row by the value in the first
year of the analysis.
Percent Change Balance Sheets
Assets
2012
2013
2014e
Cash
0.0%
-19.1%
55.6%
Short Term Investments
0.0%
-58.8%
47.4%
Accounts Receivable
0.0%
80.0%
150.0%
Inventories
0.0%
80.0%
140.0%
Total Current Assets
0.0%
73.2%
138.4%
Percent Change Income Statement
2011
2012
2013e
Sales
0.0%
70.0%
105.0%
Depreciation
0.0%
518.8%
534.9%
Cost Of Goods Sold
0.0%
73.9%
102.5%
Other Expenses
0.0%
111.8%
80.3%
Total Operating Costs
0.0%
80.5%
102.7%
EBIT
0.0%
-91.7%
140.4%
Interest Expense
0.0%
181.6%
28.0%
EBT
0.0%
-208.2%
188.3%
Taxes (40%)
0.0%
-208.2%
188.3%
Net Income
0.0%
-208.2%
188.3%
Gross Fixed Assets
0.0%
145.0%
148.5%
Less Accumulated Depreciation
0.0%
80.0%
162.1%
Total Assets
0.0%
96.5%
139.4%
Liabilities And Equity
2012
2013
2014e
Accounts Payable
0.0%
122.5%
147.1%
Notes Payable
0.0%
260.0%
50.0%
Accruals
0.0%
109.5%
179.4%
Total Current Liabilities
0.0%
175.9%
115.9%
Long-Term Debt
0.0%
209.2%
54.6%
Common Stock (100,000 Shares)
0.0%
265.4%
Retained Earnings
0.0%
-52.1%
45.4%
Total Equity
0.0%
-16.0%
197.9%
Total Liabilities And Equity
0.0%
96.5%
139.4%
Mini Case: 3 – 23
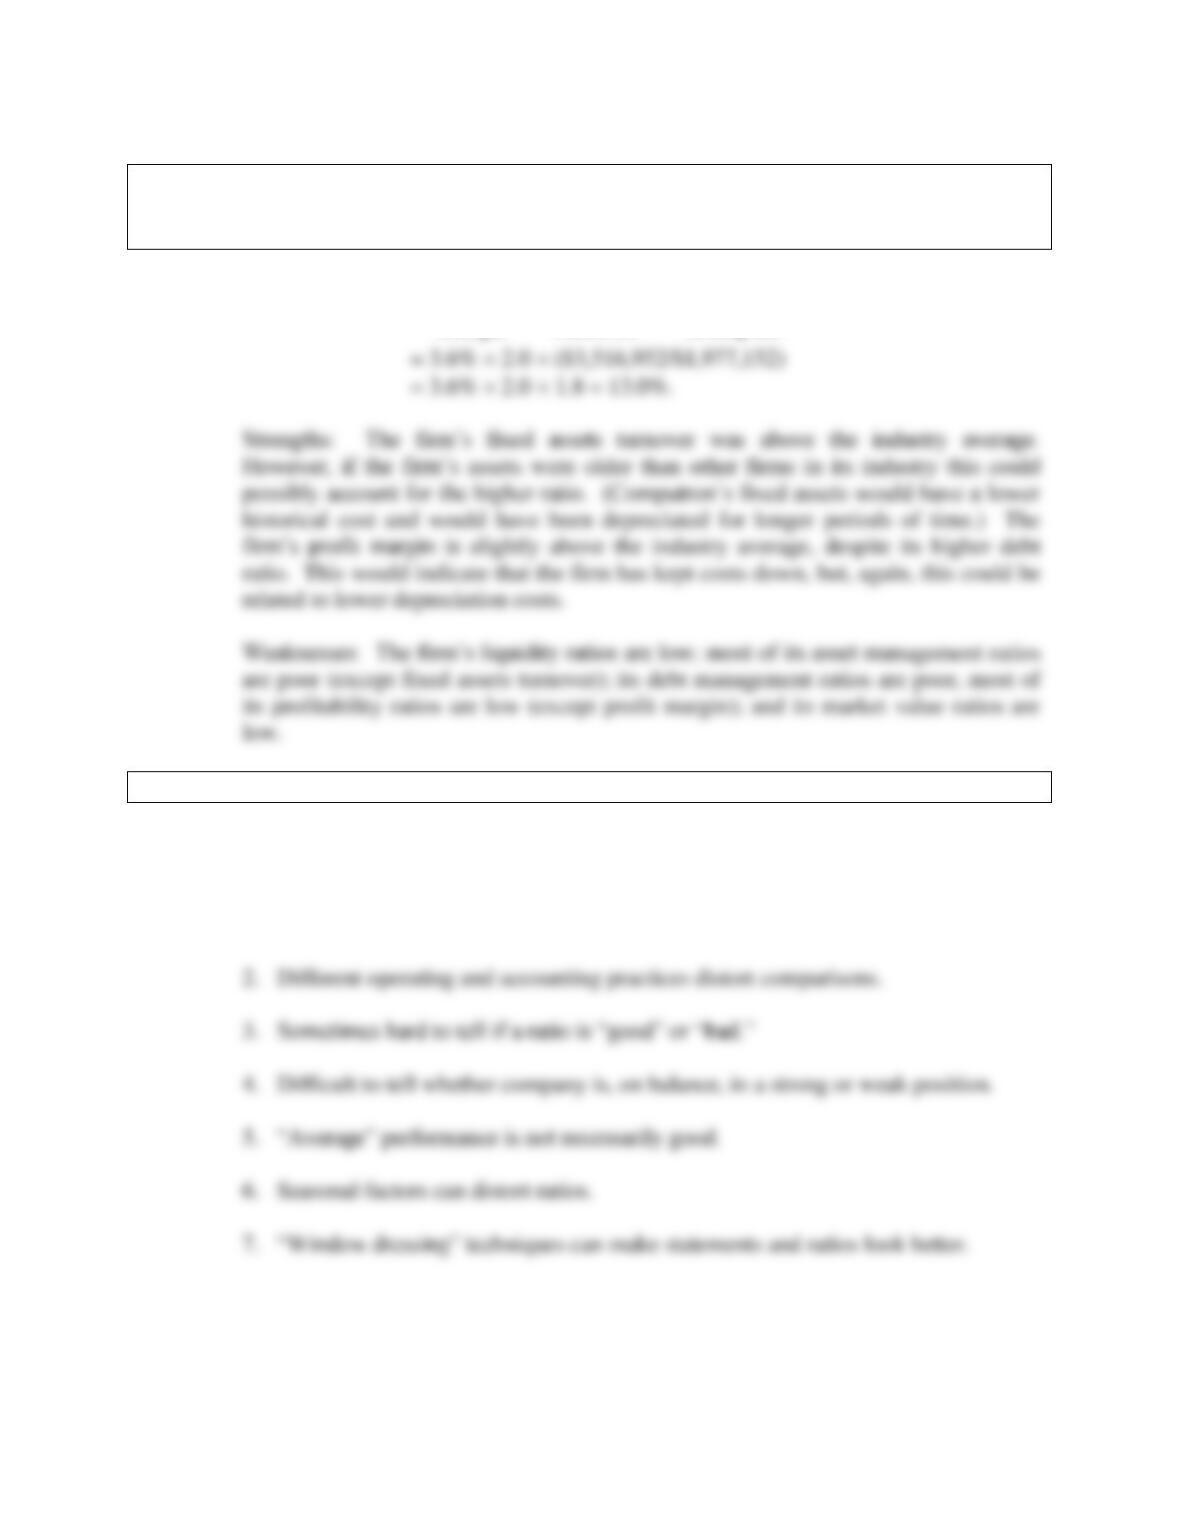
h. Use the extended Du Pont equation to provide a summary and overview of
Computron’s financial condition as projected for 2014. What are the firm’s
major strengths and weaknesses?
Answer: Du Pont Equation =
Margin
Profit
Turnover
Assets Total
Multiplier
Equity
i. What are some potential problems and limitations of financial ratio analysis?
Answer: Some potential problems are listed below:
1. Comparison with industry averages is difficult if the firm operates many different
divisions.
Mini Case: 3 – 24
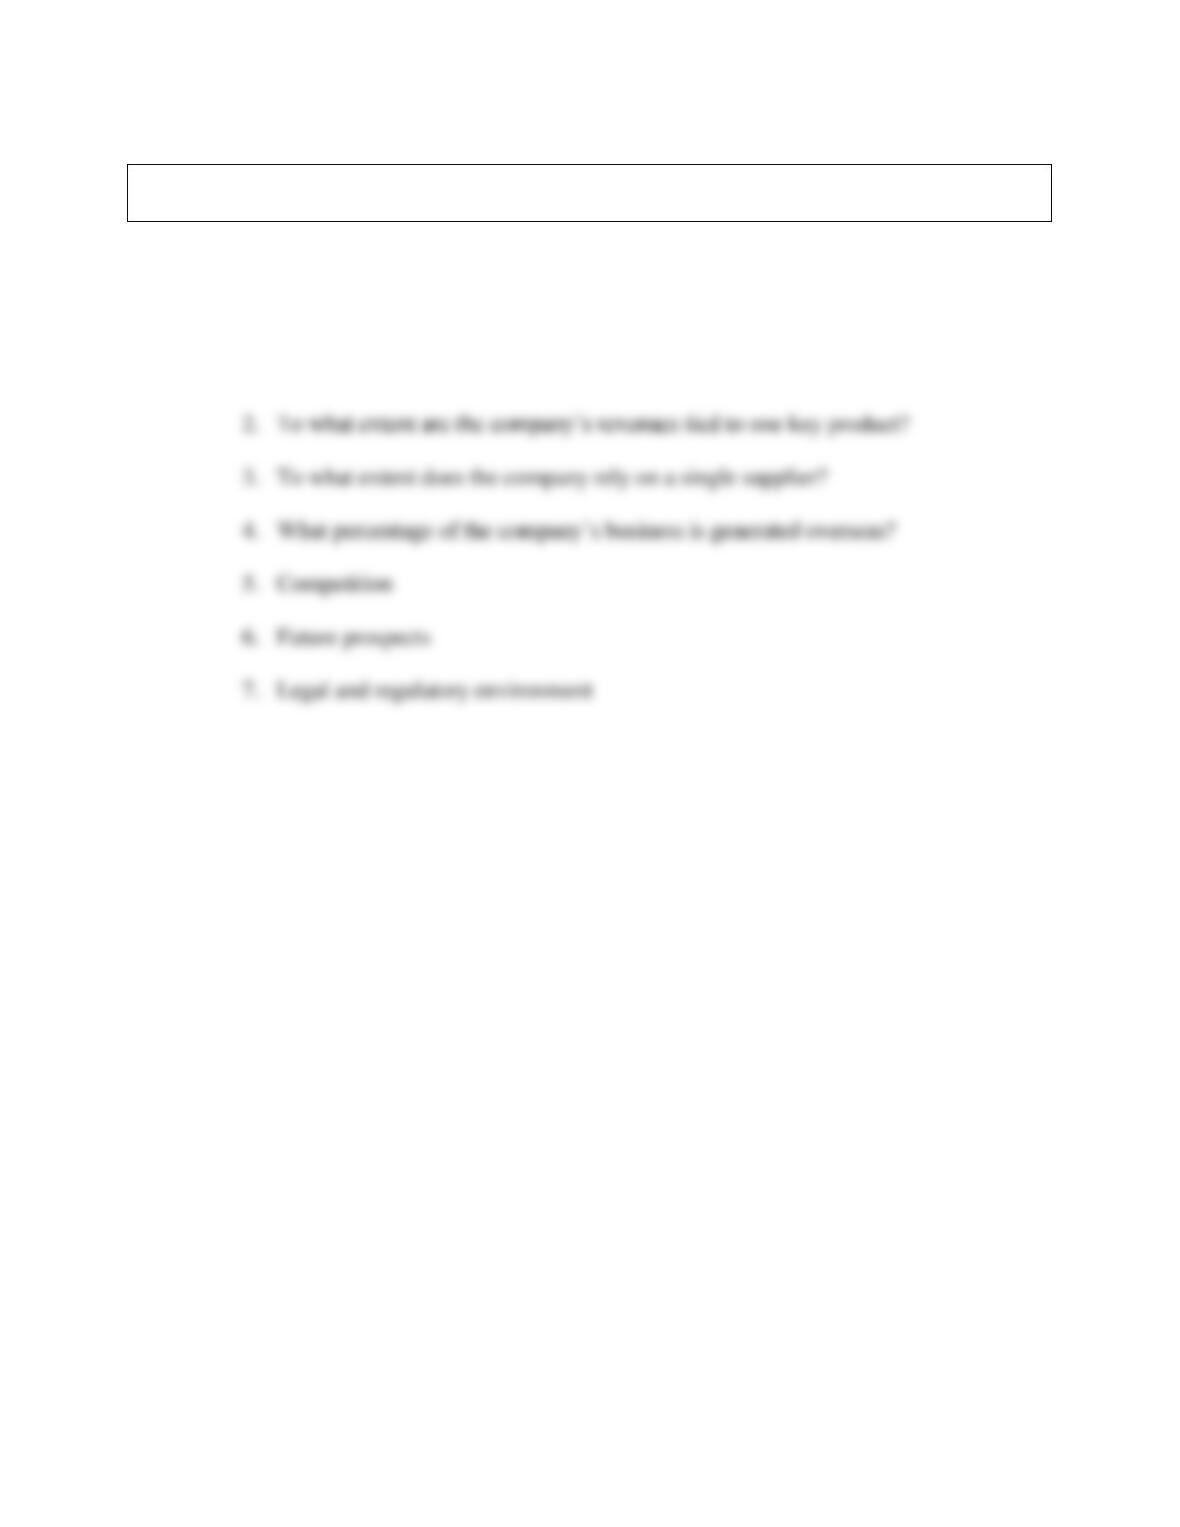
j. What are some qualitative factors analysts should consider when evaluating a
company’s likely future financial performance?
Answer: Top analysts recognize that certain qualitative factors must be considered when
evaluating a company. These factors, as summarized by the American Association
Of Individual Investors (AAII), are as follows:
1. Are the company’s revenues tied to one key customer?