1
2
3
4
5
6
7
8
9
10
11
12
13
14
A B C D E F G H I J
03 Case model 12/9/2018
EXHIBITS: INPUT DATA (for D’Leon)
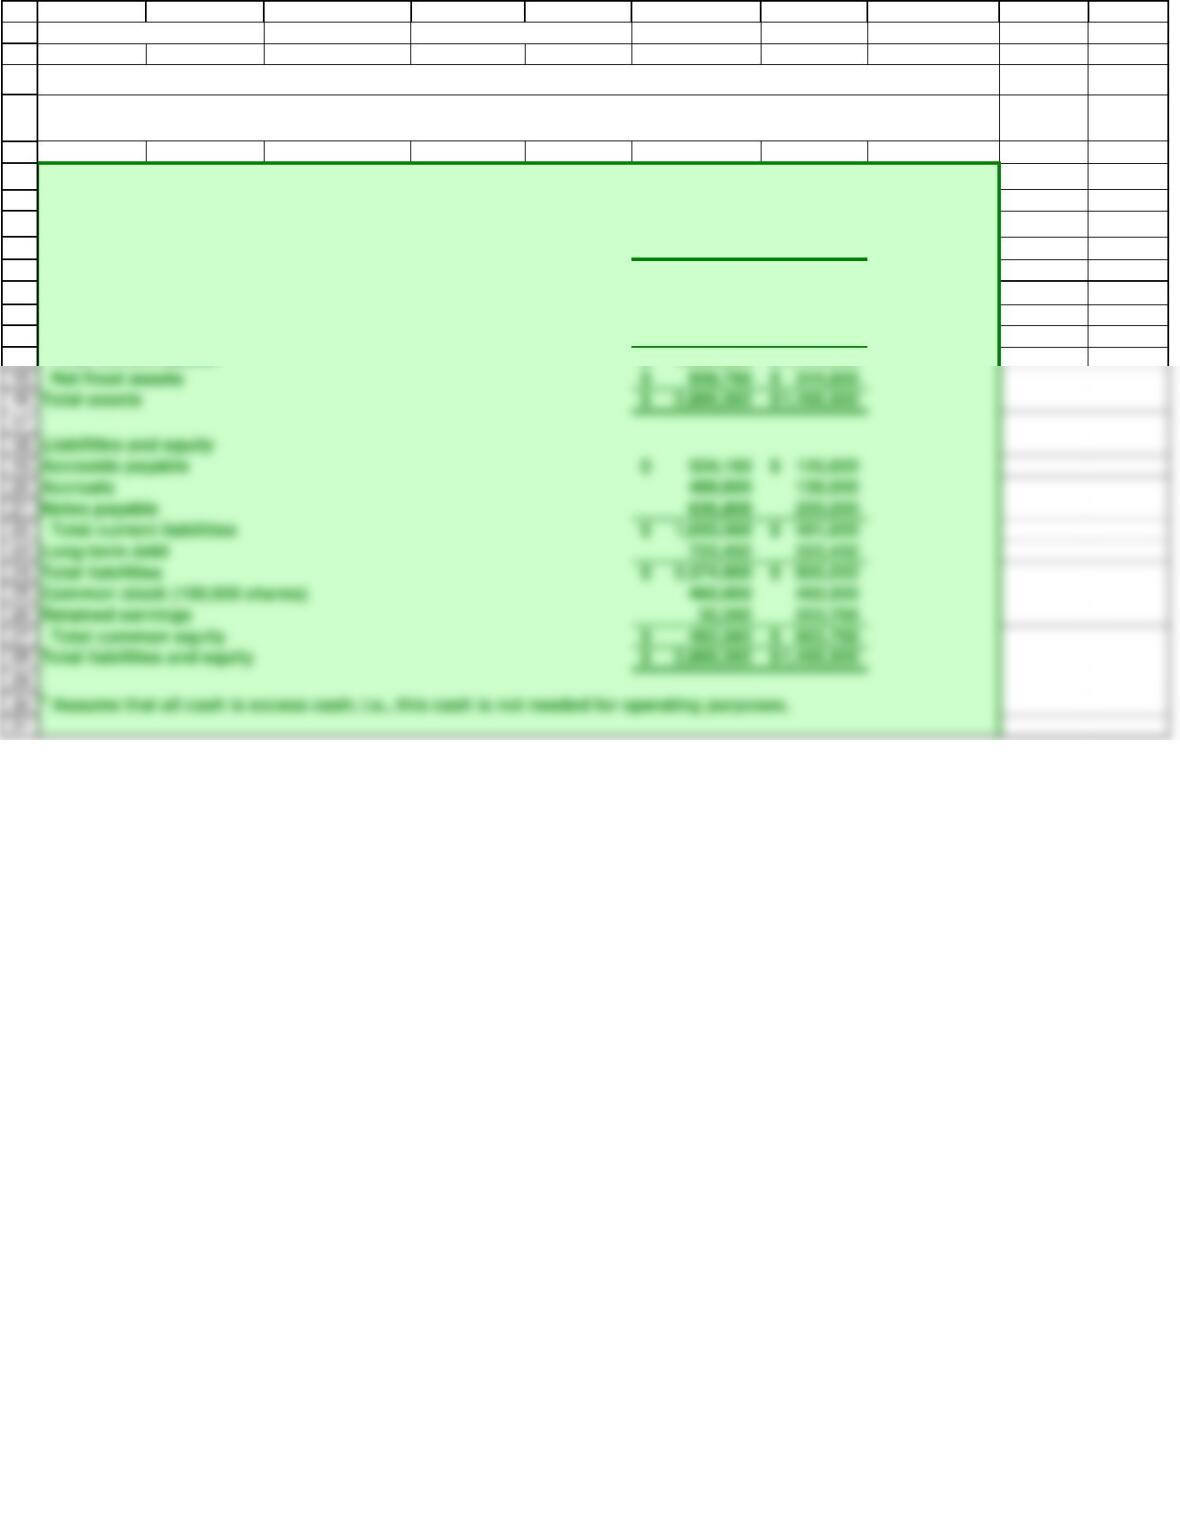
Table IC3.1 Balance Sheets
2019 2018
Assets
Casha7,282$ 57,600$
Accounts receivable 632,160 351,200
Inventories 1,287,360 715,200
Total current assets 1,926,802$ 1,124,000$
9/12/2022 17:10
This spreadsheet model is designed to be used in conjunction with the chapter’s integrated case and the related
PowerPoint slide presentation.
Chapter 3. Financial Statements, Cash Flow, and Taxes
Net fixed assets 939,790$ 344,800$
Accounts payable 524,160$ 145,600$
Notes payable 636,808 200,000
Total current liabilities 1,650,568$ 481,600$
Long-term debt 723,432 323,432
Total liabilities 2,374,000$ 805,032$
Common stock (100,000 shares) 460,000 460,000
Retained earnings 32,592 203,768
Total common equity 492,592$ 663,768$
32
33
34
35
36
53
54
55
56
57
Less: Dividends to common stockholders (11,000)
Addition (Subtraction) to Retained Earnings (171,176)
58
59
A B C D E F G H I J
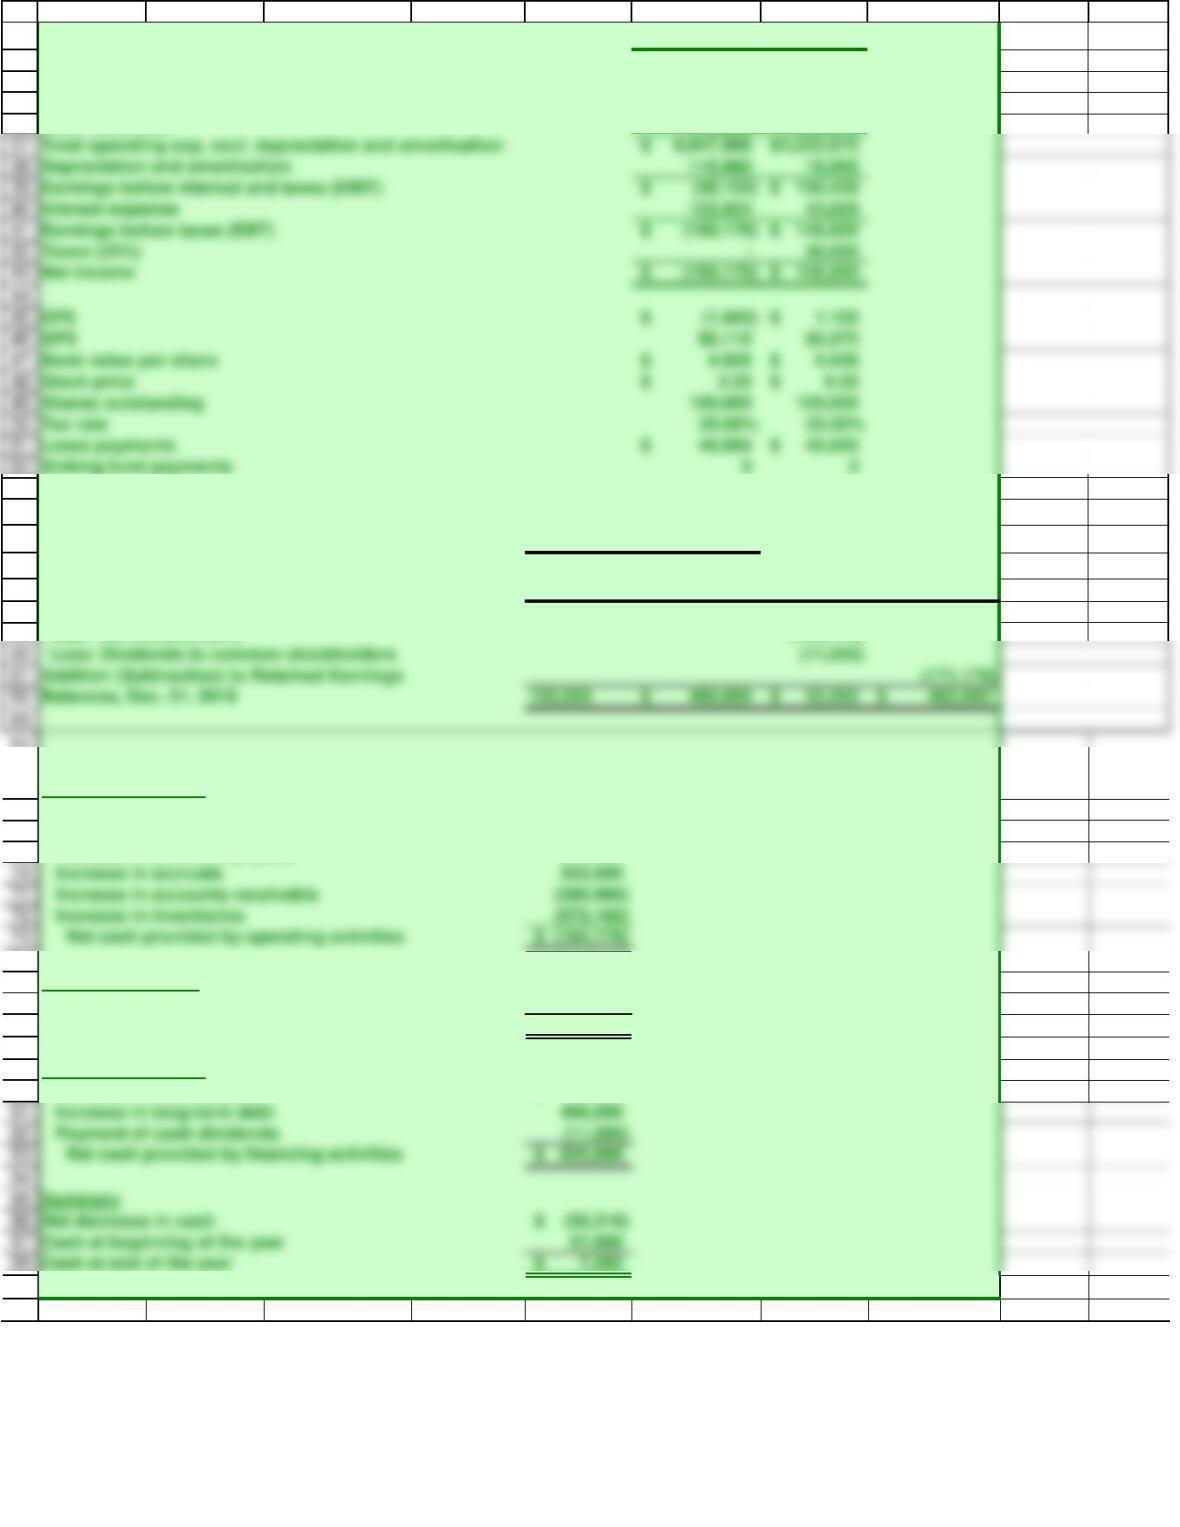
Table IC3.2 Income Statements 2019 2018
Sales 6,126,796$ 3,432,000$
Cost of goods sold 5,528,000 2,864,000
Other expenses 519,988 358,672
Table IC3.3 Statement of Stockholders’ Equity, 2019
Total
Retained Stockholders’
Shares Amount Earnings Equity
Balances, Dec. 31, 2018 100,000 460,000$ 203,768$ 663,768$
Add: Net Income, 2019 (160,176)
Common Stock
73
Increase in accruals 353,600
Increase in accounts receivable (280,960)
Increase in inventories (572,160)
Net cash provided by operating activities (164,176)$
64
65
66
67
68
69
74
75
76
77
83
88
Increase in long-term debt 400,000
Payment of cash dividends (11,000)
Net cash provided by financing activities 825,808$
Net decrease in cash (50,318)$
Cash at beginning of the year 57,600
Cash at end of the year 7,282$
78
79
80
89
90
Operating Activities
Net Income (160,176)$
Depreciation and amortization 116,960
Increase in accounts payable 378,560
Investing Activities
Additions to property, plant, and equipment (711,950)$
Net cash used in investing activities (711,950)$
Financing Activities
Increase in notes payable 436,808$
Total operating exp. excl. depreciation and amortization 6,047,988$ 3,222,672$
Depreciation and amortization 116,960 18,900
Earnings before interest and taxes (EBIT) (38,152)$ 190,428$
Interest expense 122,024 43,828
Earnings before taxes (EBT) (160,176)$ 146,600$
Taxes (25%) – 36,650
Book value per share 4.926$ 6.638$
Stock price 2.25$ 8.50$
Shares outstanding 100,000 100,000
Tax rate 25.00% 25.00%
Lease payments 40,000$ 40,000$
Sinking fund payments 0 0
91
92
93
94
95
98
105
106
108
109
110
111
114
115
116
117
118
119
120
121
A B C D E F G H I J
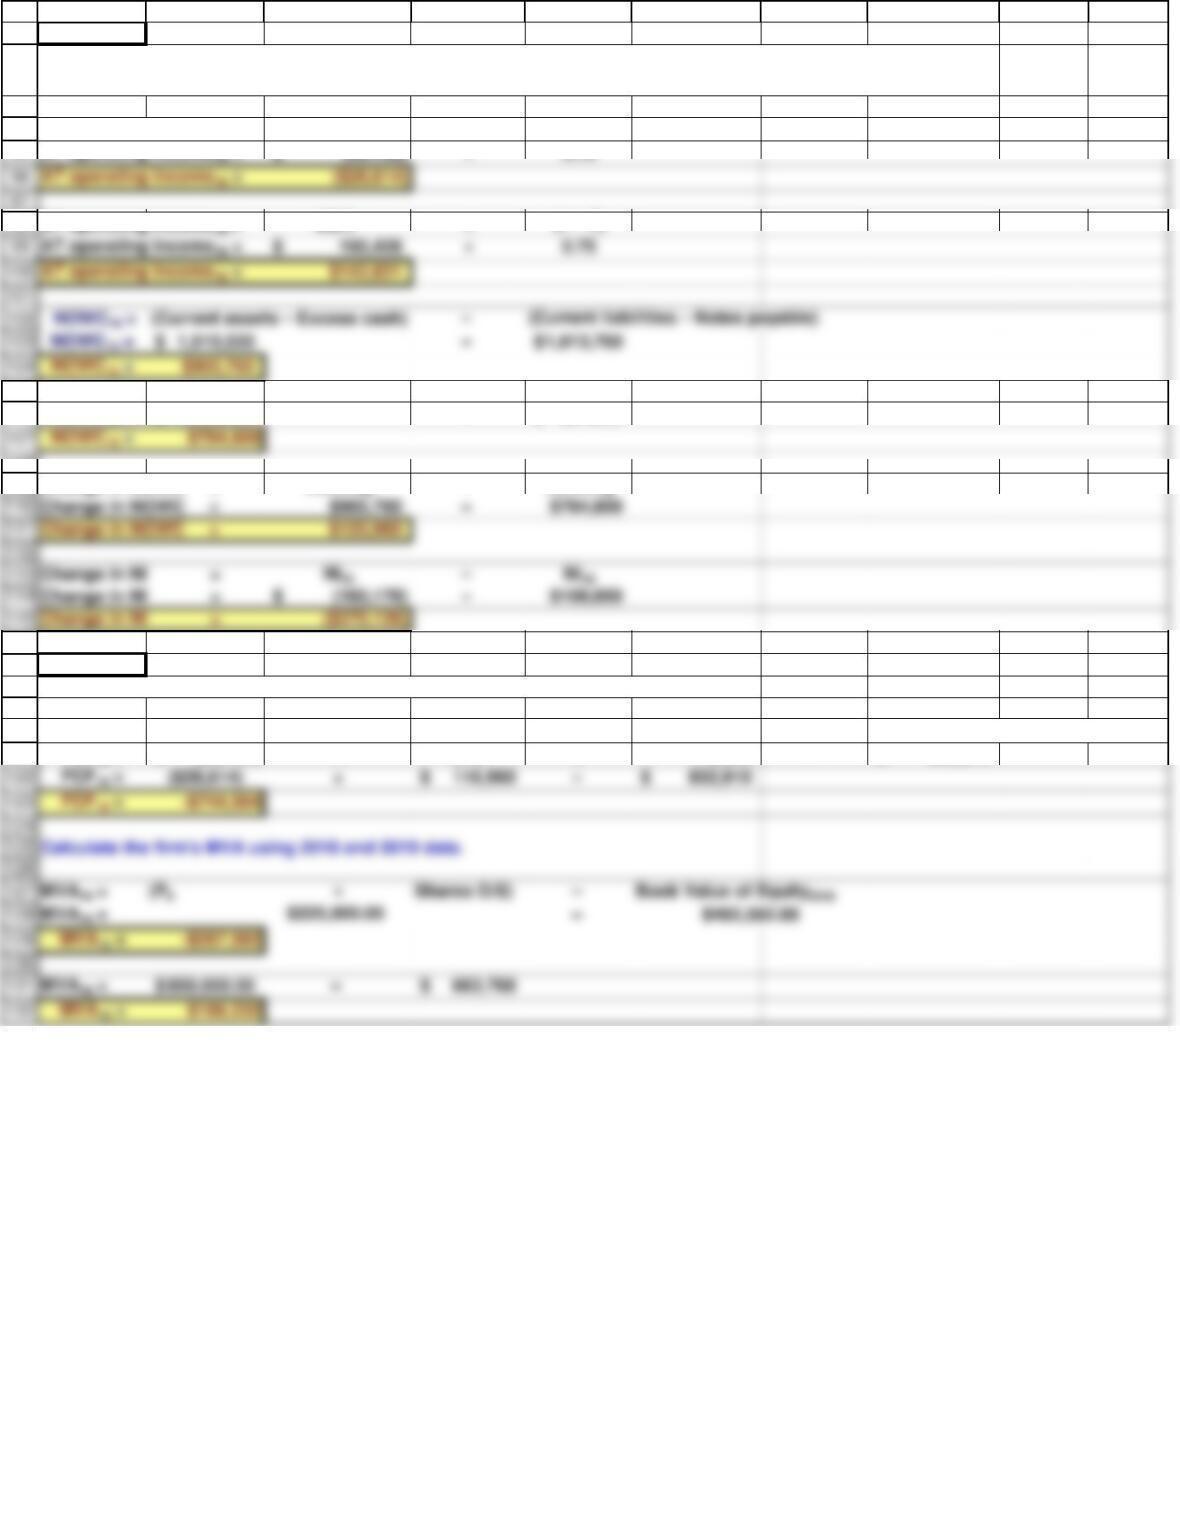
PART A
AT operating income19 = EBIT ×(1 – T)
AT operating income19 = (38,152)$ ×0.75
AT operating income18 = EBIT ×(1 – T)
NOWC18 = 1,066,400$ – 281,600$
Change in NOWC =
NOWC19 – NOWC18
PART B
FCF19 = EBIT ×(1 – T) + Depreciation – [Capital Expenditures + ΔNOWC]
FCF19 = (38,152)$ ×0.75 + 116,960 – 832,910$
What effect did the expansion have on sales, after-tax operating income, net operating working capital (NOWC),
and net income?
What effect did the company’s expansion have on its free cash flow?
AT operating income18 = 190,428$ ×0.75
NOWC19 = 1,919,520$ – 1,013,760$