Chapter 3
Physical Capital
Note: Special icons in the margin identify problems requiring a computer or calculator and those
requiring calculus .
◼ Solutions to Problems
1. The key characteristics of physical capital are that it is productive, it is produced, its use is limited,
it can earn a return, and it wears out.
a. A delivery truck is physical capital because it is productive, i.e., by allowing a delivery man to
b. Milk is not physical capital because it is not productive. (To be slightly technical, milk is used in
using capital and labor to turn milk into cheese.)
c. Farmland is not physical capital because even though it allows a worker to produce more output,
2. To find the steady-state value of the country, we refer to Equation (3.3) on page 63.
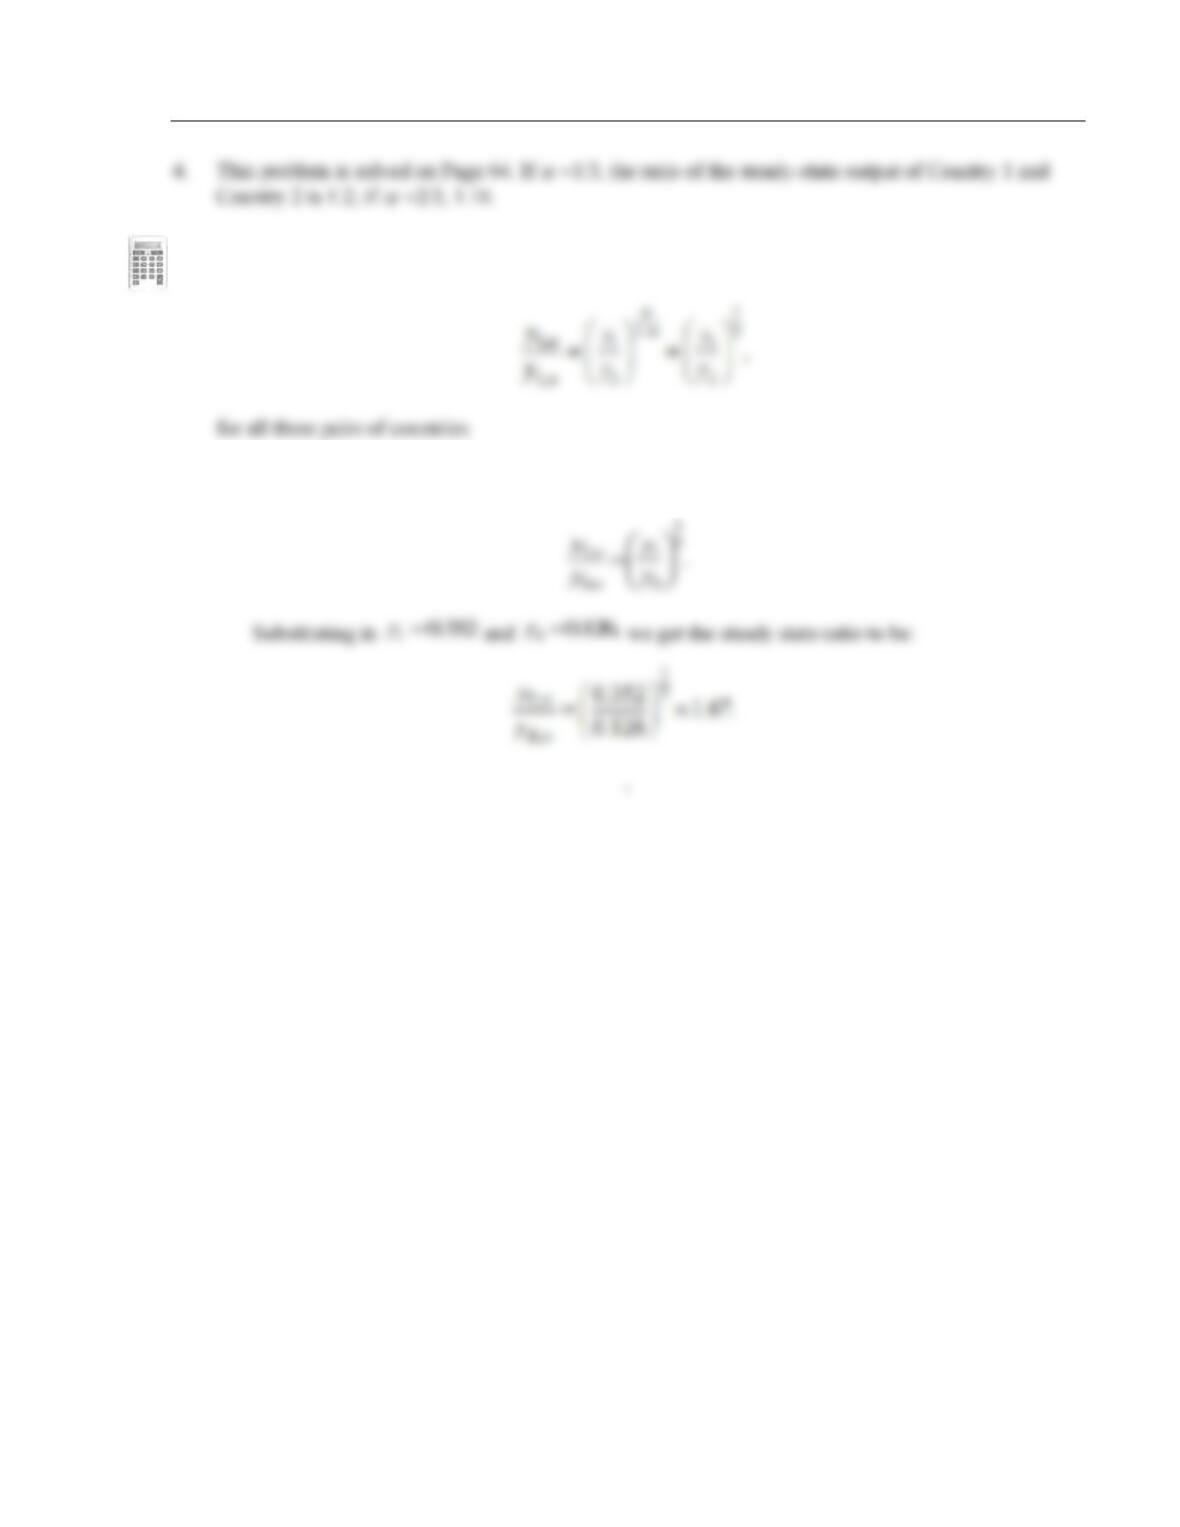
Chapter 3 Physical Capital 7
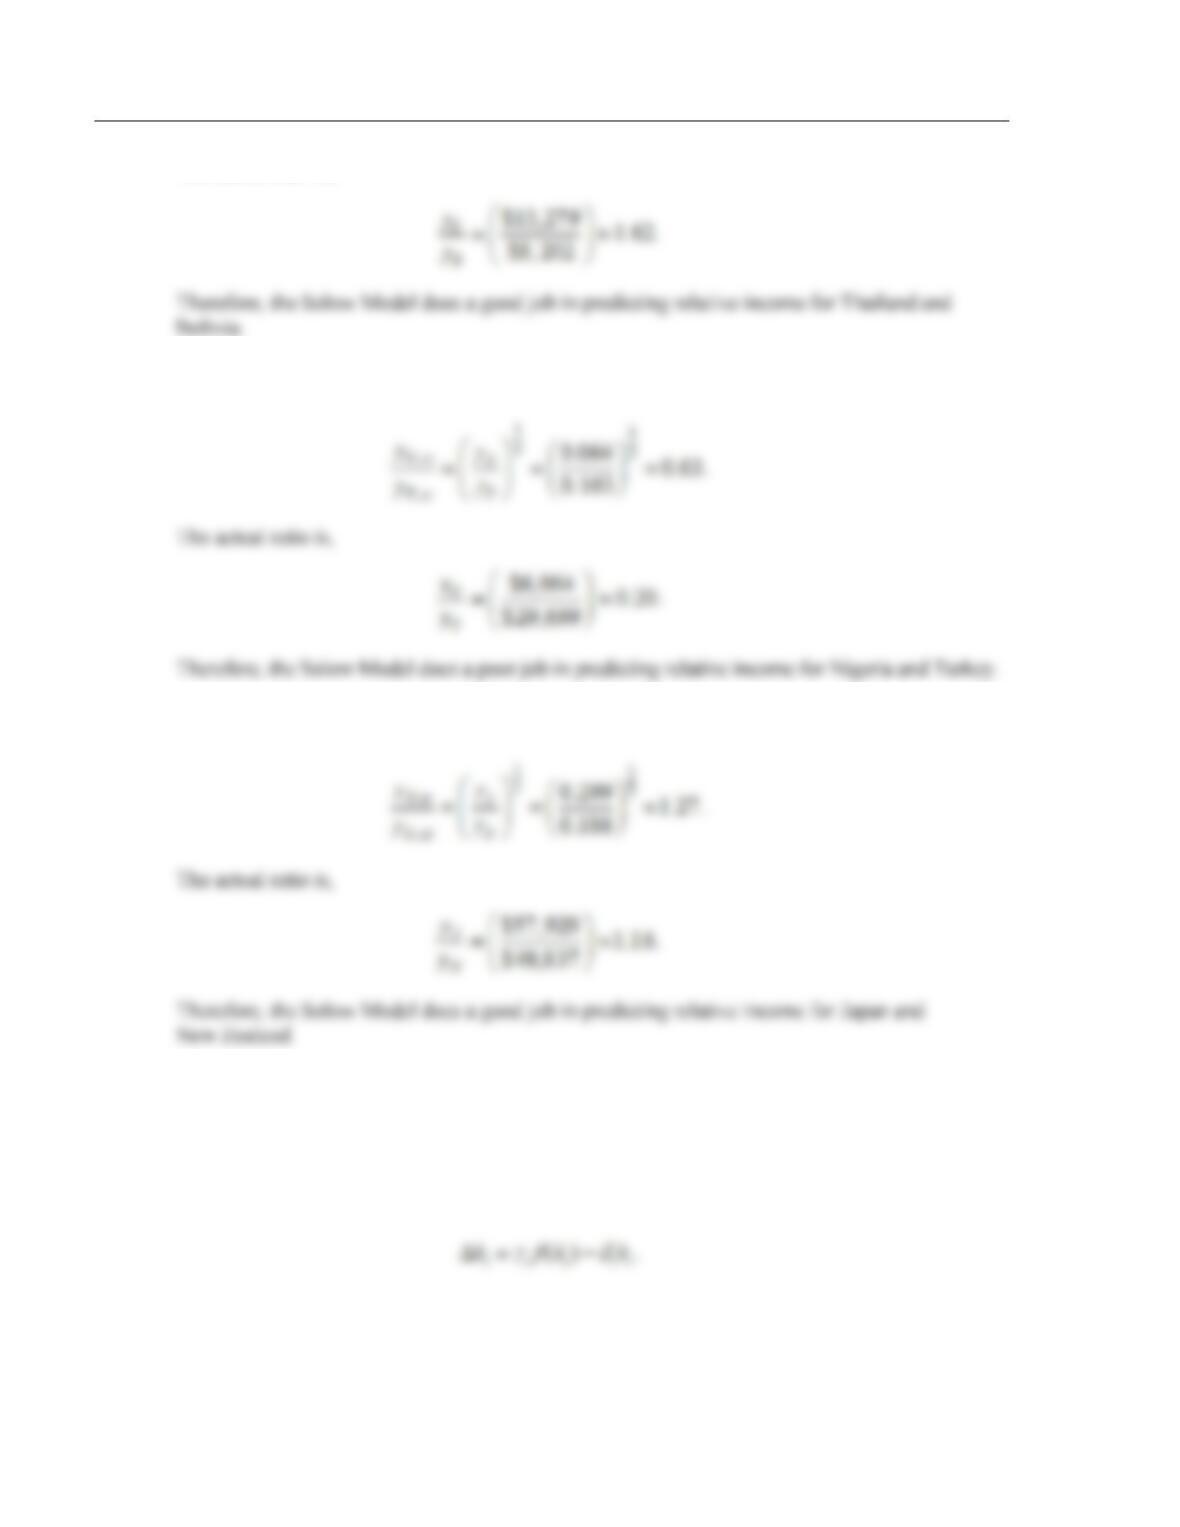
5. Since we know productivity, A, and depreciation,
, are the same, we know that they will cancel out
in our steady state ratio analysis. Therefore, with
=1/3, our equation of interest boils down to
a. Using a subscript T for Thailand and a subscript B for Bolivia, we rewrite the previous equation
for Thailand and Bolivia as
8 Weil • Economic Growth, Second Edition
The actual ratio is,
b. Using a subscript N for Nigeria and a subscript T for Turkey, we rewrite the previous equation,
with
0.064
N
=
and
0.163
T
=
to get,
c. Using a subscript J for Japan and a subscript N for New Zealand, we rewrite the previous
equation, with
0.299
J
=
and
0.186
N
=
to get,
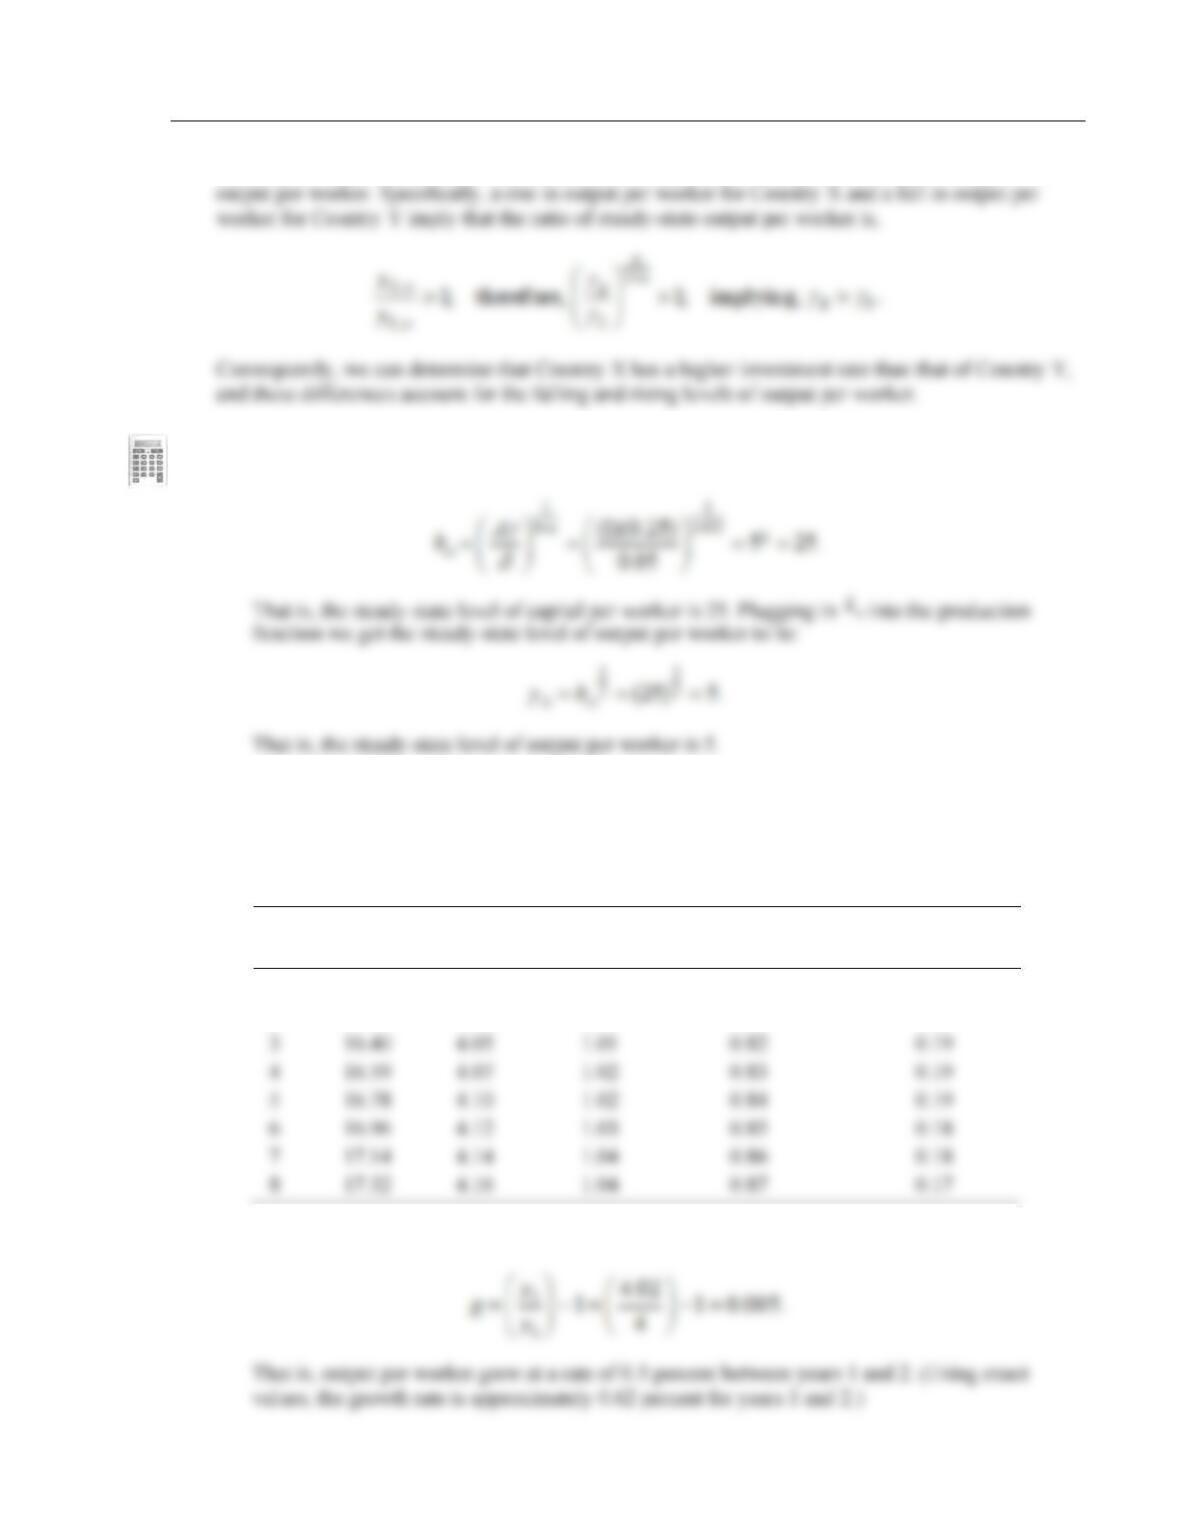
6. If output per worker is rising in Country X and output per worker is falling in Country Y, we can be
assured that both countries are not in their respective steady states. Instead, they are converging to
their respective steady states. In addition, for Country X and Country Y, we are given information
that depreciation, productivity, and output per worker are identical. By the process of elimination, the
only difference between the countries can and must be the level of capital stocks. Capital stock levels
follow the process:
Chapter 3 Physical Capital 9
As such, we can conclude that differences in investment rates are responsible for the divergence in
7. a. First we find the steady-state level of capital per worker. Using the values for investment,
=
0.25, depreciation,
= 0.05, productivity, A = 1, and
= 0.5, we get,
b. For year 2, using 16.2 as the value for capital per worker, calculate output, y, followed by
investment
y, depreciation
k, and then change in capital stock. Add the value for change in
capital stock to 16.2, the value for capital per worker in year 2, to get capital per worker for
year 3. Use year 3 capital to obtain all the values for year 3 and continue up to year 8. The filled
in table is below.
Year
Capital
Output
Investment
Depreciation
Change in Capital
Stock
1
16.00
4.00
1.00
0.08
0.20
2
16.20
4.02
1.01
0.81
0.20
3
16.40
4.05
1.01
0.82
0.19
4
16.59
4.07
1.02
0.83
0.19
5
16.78
4.10
1.02
0.84
0.19
6
16.96
4.12
1.03
0.85
0.18
7
17.14
4.14
1.04
0.86
0.18
c. The growth rate of output between years 1 and 2 is given by:
10 Weil • Economic Growth, Second Edition
d. The growth rate of output between years 7 and 8 is given by:
e. The speed of growth has changed from 0.50 percent to 0.48 percent implying that growth has
8. First, in a steady-state level that maximizes consumption per worker, the change in capital stock will
be zero. That is,
Second, given that any output not saved is consumed, we can write an equation for consumption as,
That is, the marginal product of capital must equal the rate of depreciation. Combining the consumption
maximization condition
1
( ( ) .)aAk
−=
with the steady-state condition
( ( ) .),f k k
=
we get:
9. To find the steady-state value of the country, we refer to Equation (3.3) on page 63
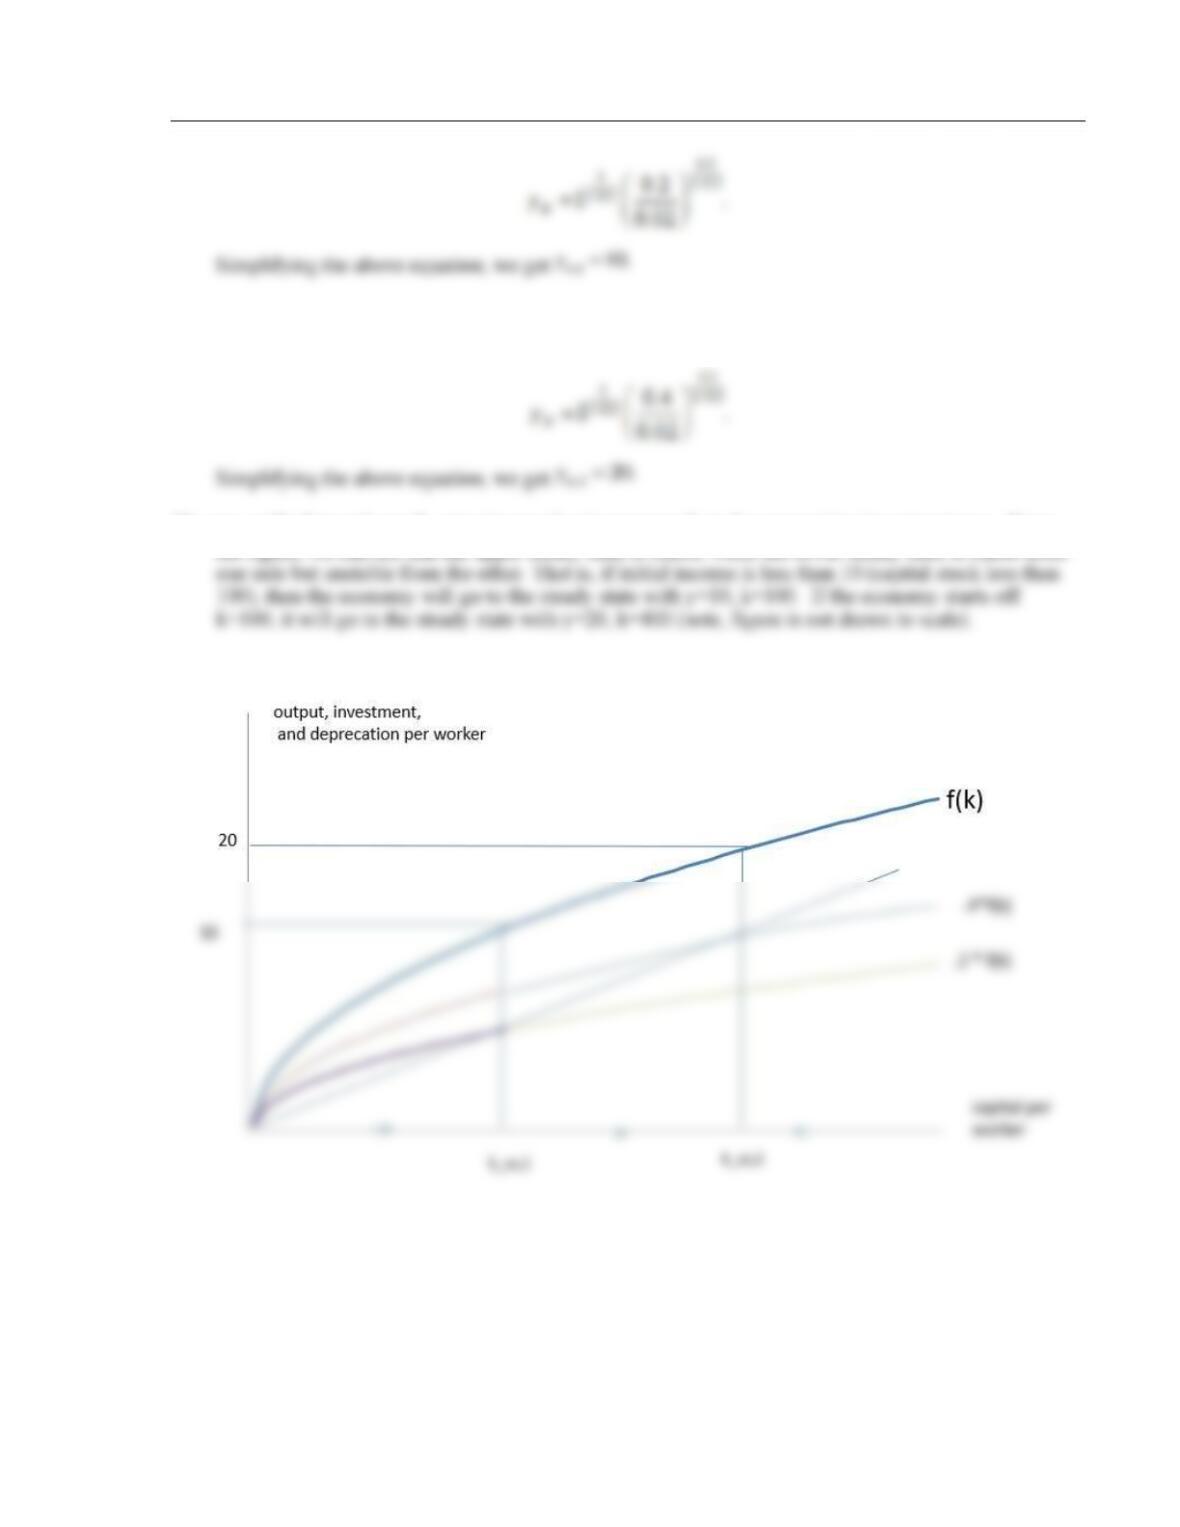
Chapter 3 Physical Capital 11
Plugging in values: A = 1,
= 0.5,
= 0.4 and
= 0.02, we get:
We can verify that each steady-state income level corresponds to the appropriate investment rate. From
the figure, we can see that the upper steady state is stable, while the lower steady state is stable from