03 Chapter model 12/12/2018
THE ANNUAL REPORT
INPUT DATA SECTION: Historical Data Used in the Analysis 2019 2018
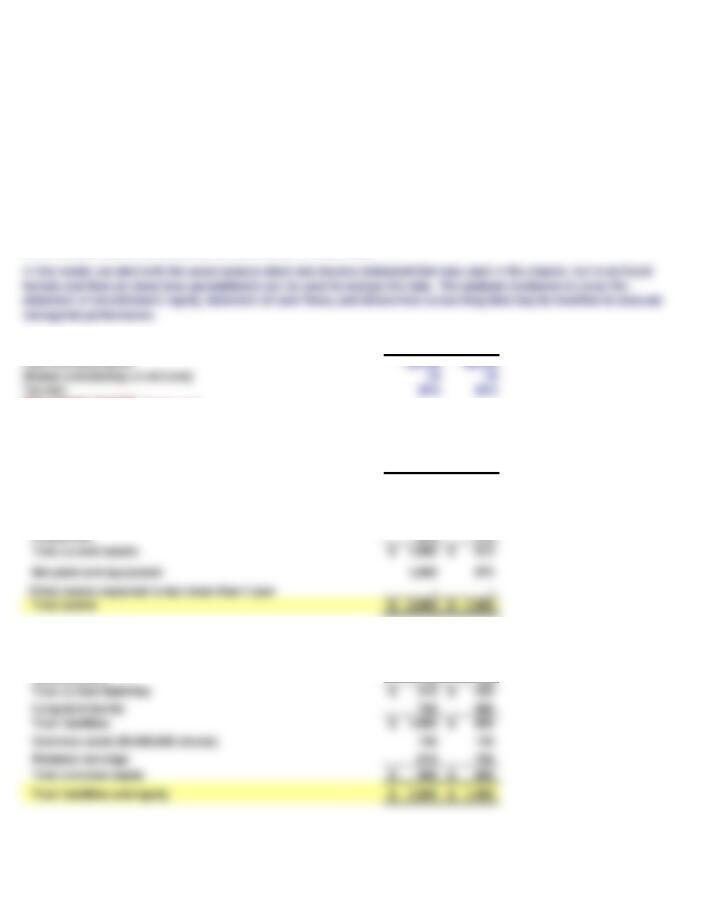
BALANCE SHEET (Section 3-2)
BALANCE SHEETS – Allied Food Products – December 31 2019 2018
(in millions of dollars)
Assets
Cash and equivalents 10$ 80$
Accounts receivable 375 315
Inventories 615 415
Liabilities and Equity
Accounts payable 60$ 30$
Accruals 140 130
Notes payable 110 60
Long-term bonds 750 580
Common stock (50,000,000 shares) 130 130
Chapter 3. Financial Statements, Cash Flows, and Taxes
The annual report contains a verbal section plus four key statements: the balance sheet, income statement, statement of
stockholders‘ equity, and statement of cash flows. These statements contain a wealth of information that is used by
bankers, stock and bond analysts, and managers. Hence, they are quite important. Spreadsheets are used both to create
and to analyze these statements, as we demonstrate in this model.
The balance sheet can be thought of as a snapshot in time of a firm’s financial position. You can observe the firm’s level
of assets and the manner in which they have used debt and equity to fund those assets.
This model is STRICTLY OPTIONAL. Neither students nor instructors need to go through it. However, if someone wants
to practice with Excel, then the model can be useful. Also, on the tabs we show solutions for the within-chapter self-test
questions, if applicable.
Year-end stock price $23.06 $26.00
Shares outstanding (in millions) 75 75
Tax rate 25% 25%
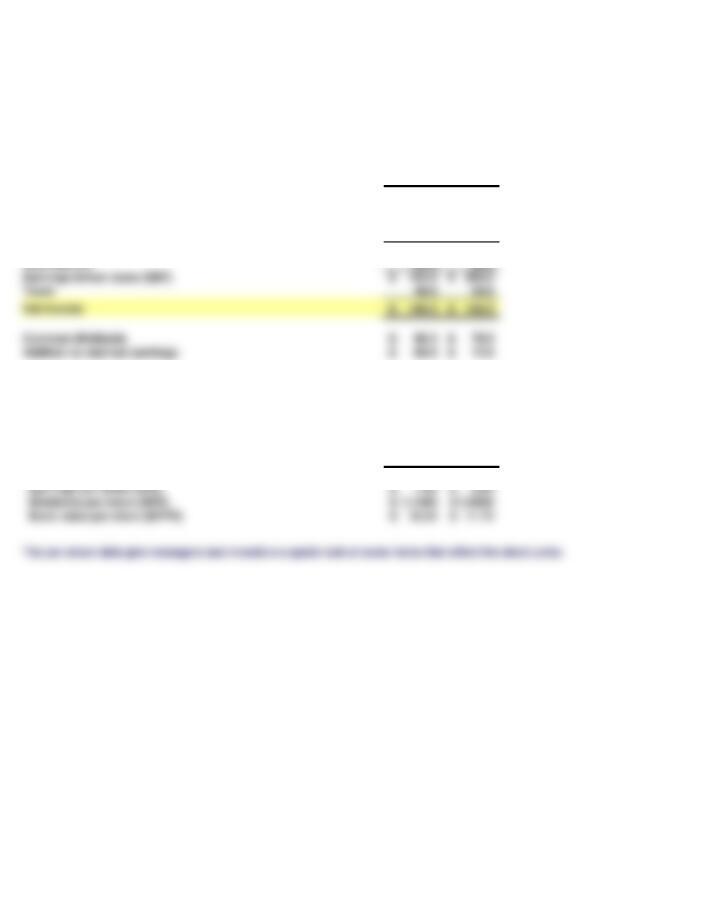
INCOME STATEMENT (Section 3-3)
INCOME STATEMENTS – Allied Food Products – Years Ending December 31
(in millions of dollars) 2019 2018
Net sales 3,000.0$ 2,850.0$
Operating costs except depreciation and amortization 2,622.0 2,497.0
Depreciation and amortization 100.0 90.0
Earnings before interest and taxes (EBIT) 278.0$ 263.0$
Less interest 83.0 60.0
PER-SHARE DATA
2019 2018
Common stock price 23.06$ 26.00$
Earnings per share (EPS) 1.95$ 2.03$
The income statement summarizes a firm‘s revenues and expenses over an accounting period, usually a year. The
“bottom line” of an income statement is the firm’s net income. Collectively, the income statement gives an indication of a
firm’s operating ability.
We can now use the above information to calculate three specific per-share data measures: earnings per share (EPS),
dividends per share (DPS), and book value per share (BVPS). Simply divide the totals by the appropriate number of shares
outstanding. Note that BVPS is calculated by dividing total common equity (common stock plus retained earnings) by
shares outstanding.
Earnings before taxes (EBT) 195.0$ 203.0$
Common dividends 86.3$ 79.5$
Addition to retained earnings 60.0$ 72.8$
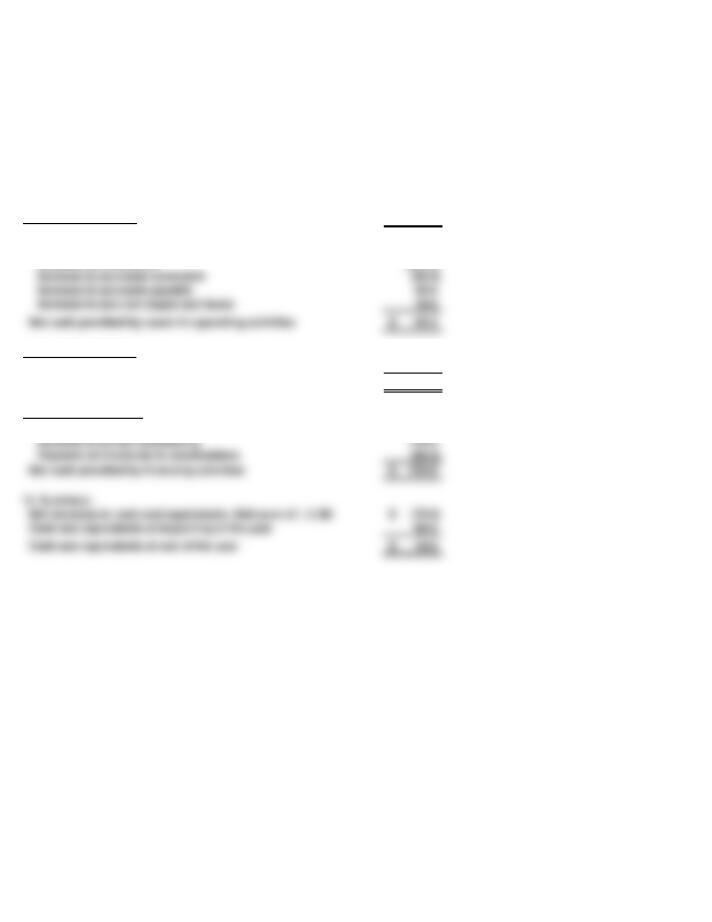
STATEMENT OF CASH FLOWS (Section 3-4)
STATEMENT OF CASH FLOWS – Allied Food Products (2019)
I. Operating Activities 2019
Net income 146.3$
Depreciation and amortization 100.0
Increase in inventories (200.0)
II. Investing Activities
Additions to property, plant, and equipment (230.0)$
Net cash used in investing activities (230.0)$
III. Financing Activities
Increase in notes payable 50.0$
Increase in bonds outstanding 170.0
Payment of dividends to stockholders (86.3)
IV. Summary
Net decrease in cash and equivalents: (Net sum of I, II, III) (70.0)$
Cash and equivalents at beginning of the year 80.0
Information from the balance sheet and income statement can be used to construct the statement of cash flows, which is
shown below for Allied, in millions of dollars.
Parentheses indicate net cash outflows, no parentheses indicates net cash
inflows.
(in millions of dollars)
Increase in accounts receivable (60.0)
Increase in accounts payable 30.0
Increase in accrued wages and taxes 10.0
STATEMENT OF STOCKHOLDERS’ EQUITY (Section 3-5)
STATEMENT OF STOCKHOLDERS’ EQUITY – Allied Food Products (2019)
(in millions of dollars)
Total
Retained
Stockholders’
Shares (000) Amount Earnings Equity
NOWC2019 = (Current assets − Excess cash) − (Current liabilities − Notes payable)
NOWC2019 = −
NOWC2019 = 800$ million
MVA and EVA (Section 3-8)
($1,000 − $0)
($310 − $110)
Common Stock
The statement of stockholders’ equity takes the previous year’s balance of retained earnings, adds the current year’s net
income, and then subtracts dividends paid to common stockholders. The end result is the new balance of retained
earnings. Allied’s statement is shown below, in millions:
FREE CASH FLOW (Section 3-7)
NOWC2019 = −
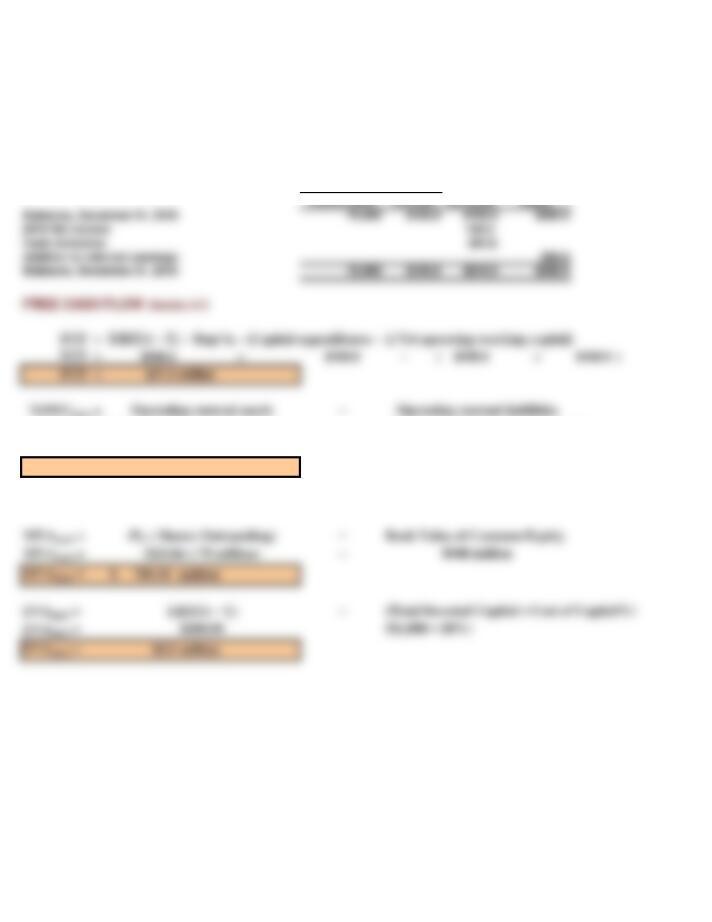
INDIVIDUAL TAXES (Section 3-9) 12/12/2018
(1) (2) (3) (4)
Taxes
$0 $9,525 $0.00 10.0%
$9,525 $38,700 $952.50 12.0%
$38,700 $82,500 $4,453.50 22.0% Tax on base
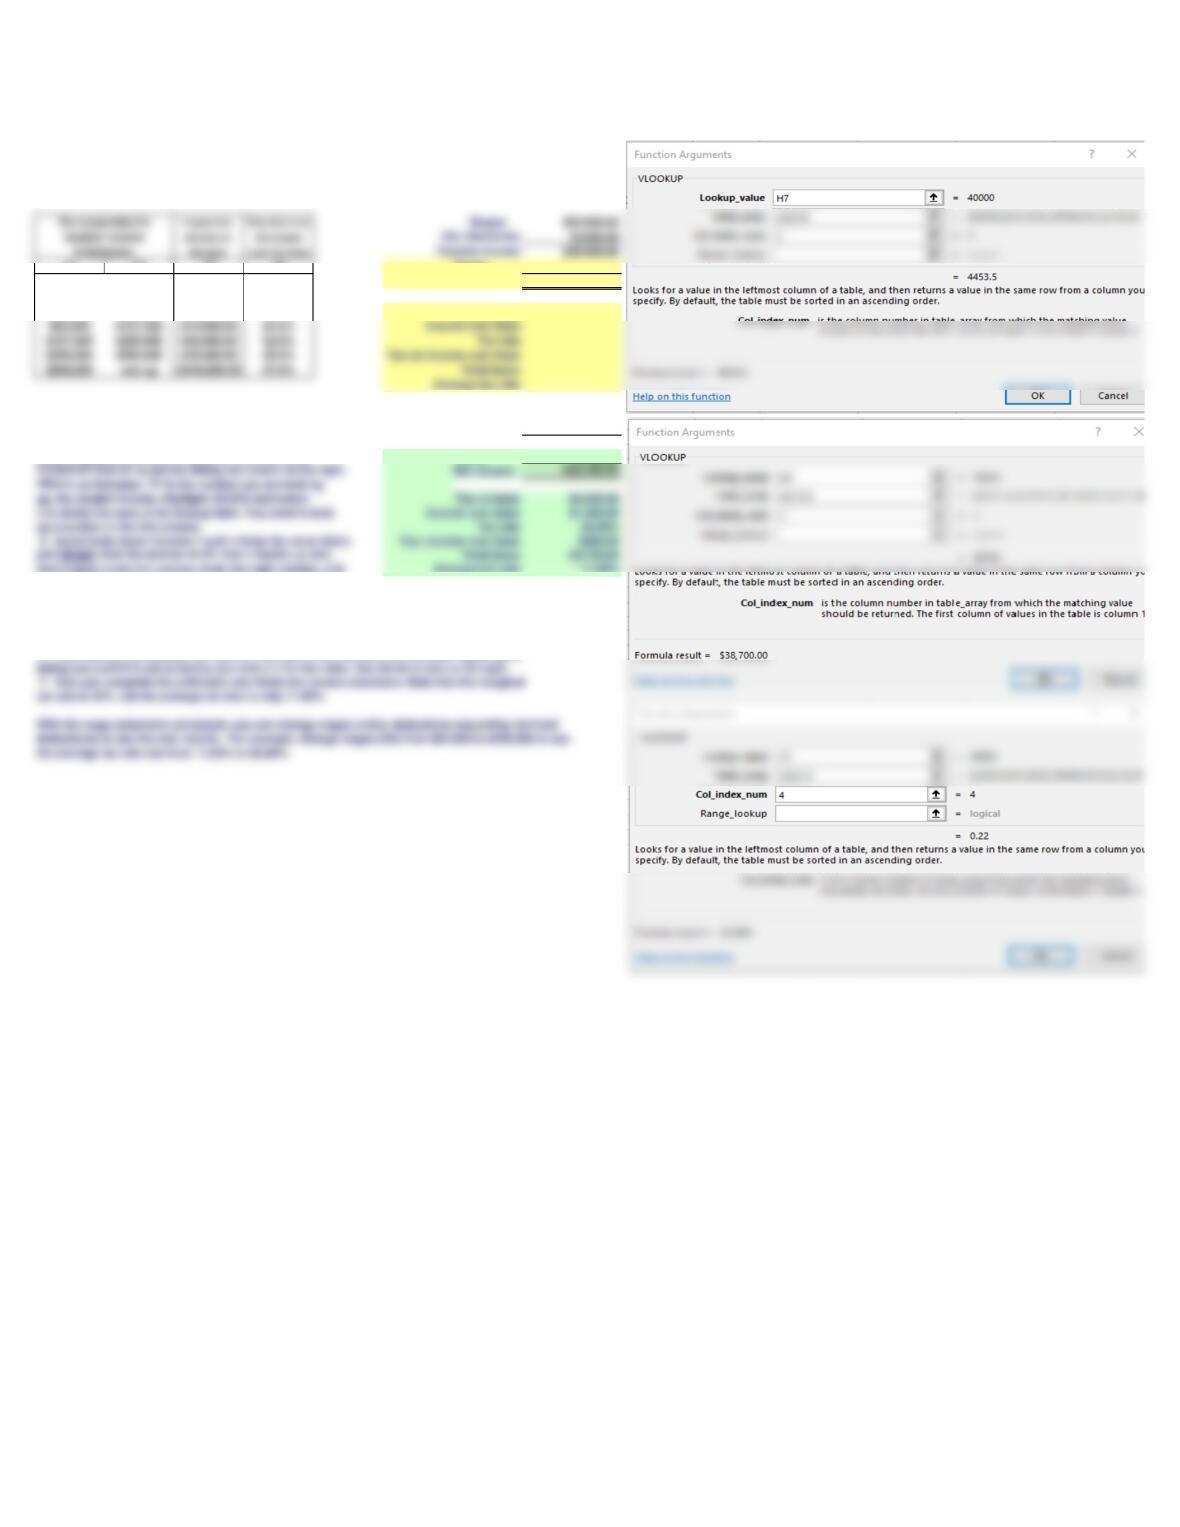
1. You are to fill in the 8 yellow cells. They should end
Sales $52,000.00
up looking like the green cells.
Costs 12,000.00
2. Put pointer on H11. Then click Formulas > fx. Find and $40,000.00
select category Lookup & Reference, and then click
Taxes 4,739.50
then it goes to the 3rd column, finds the right number, and Average tax rate 11.85%
inserts it in H11. You now have the tax on the base income.
5. To find the income over the base, use VLOOKUP again. Put pointer on H12.
Get a new dialog box and fill it in just like the first one, except the third entry is 1 rather
than 3. You now subtract this amount from the firm’s taxable income. Do this by editing and entering
H7 followed by a minus sign right after the equal sign in H12. The income over base is $1,300.
6. Now look up the marginal tax rate, i.e., the rate on the income over the base. Again, get a
Taxable income
Use the Excel function VLOOKUP to find the taxes due on a single taxpayer‘s taxable income. The single
individual’s tax table is shown below, with a wage statement that’s missing the tax liability and the taxpayer’s
after-tax income to the right. We use VLOOKUP to find the taxes due, after which we find the individual’s after-
tax income.
After-tax income