Solution 12/7/2012
Chapter: 3
Problem: 15
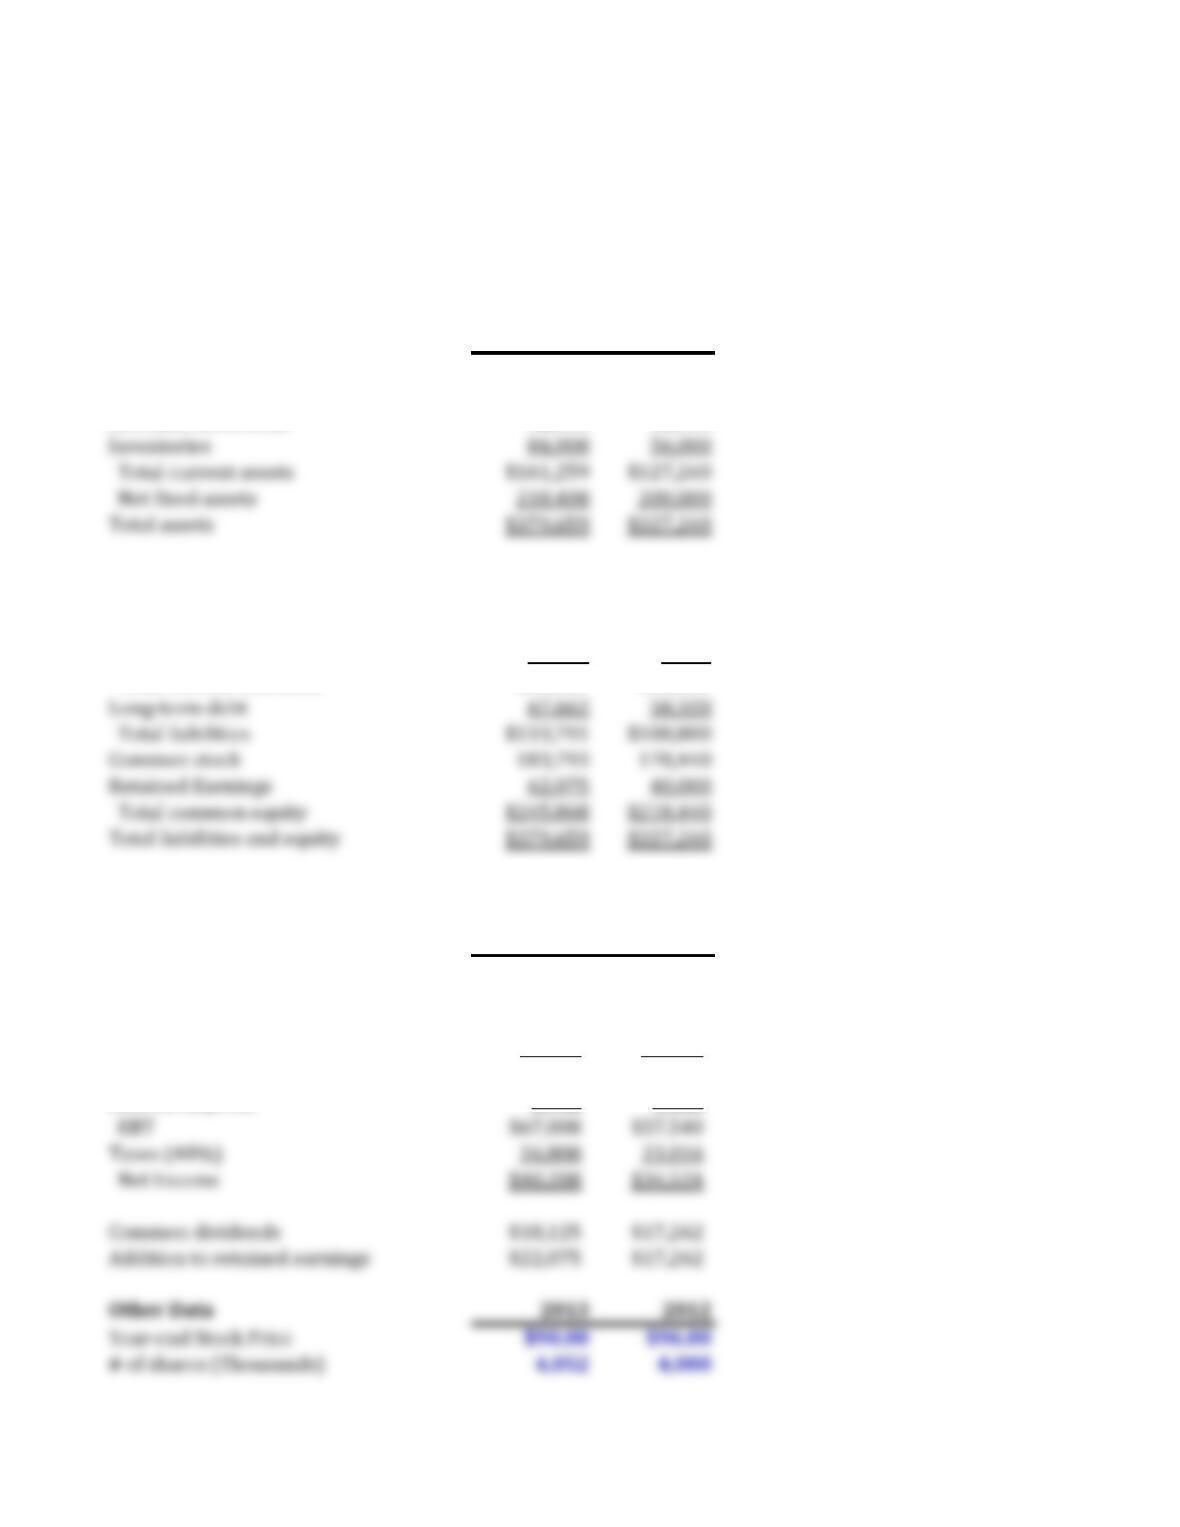
Joshua & White Technologies: December 31 Balance Sheets
(Thousands of Dollars)
Assets 2013 2012
Cash and cash equivalents $21,000 $20,000
Short-term investments 3,759 3,240
Accounts Receivable 52,500 48,000
Liabilities and equity
Accounts payable $33,600 $32,000
Accruals 12,600 12,000
Notes payable 19,929 6,480
Total current liabilities $66,129 $50,480
Joshua & White Technologies December 31 Income Statements
(Thousands of Dollars)
2013 2012
Sales $420,000 $400,000
COGS except excluding depr. and amort. 300,000 298,000
Depreciation and Amortization 19,660 18,000
Other operating expenses 27,600 22,000
EBIT $72,740 $62,000
Interest Expense 5,740 4,460
Lease payment (Thousands of Dollars) $20,000 $20,000
Sinking fund payment (Thousands of Dollars)
$5,000 $5,000
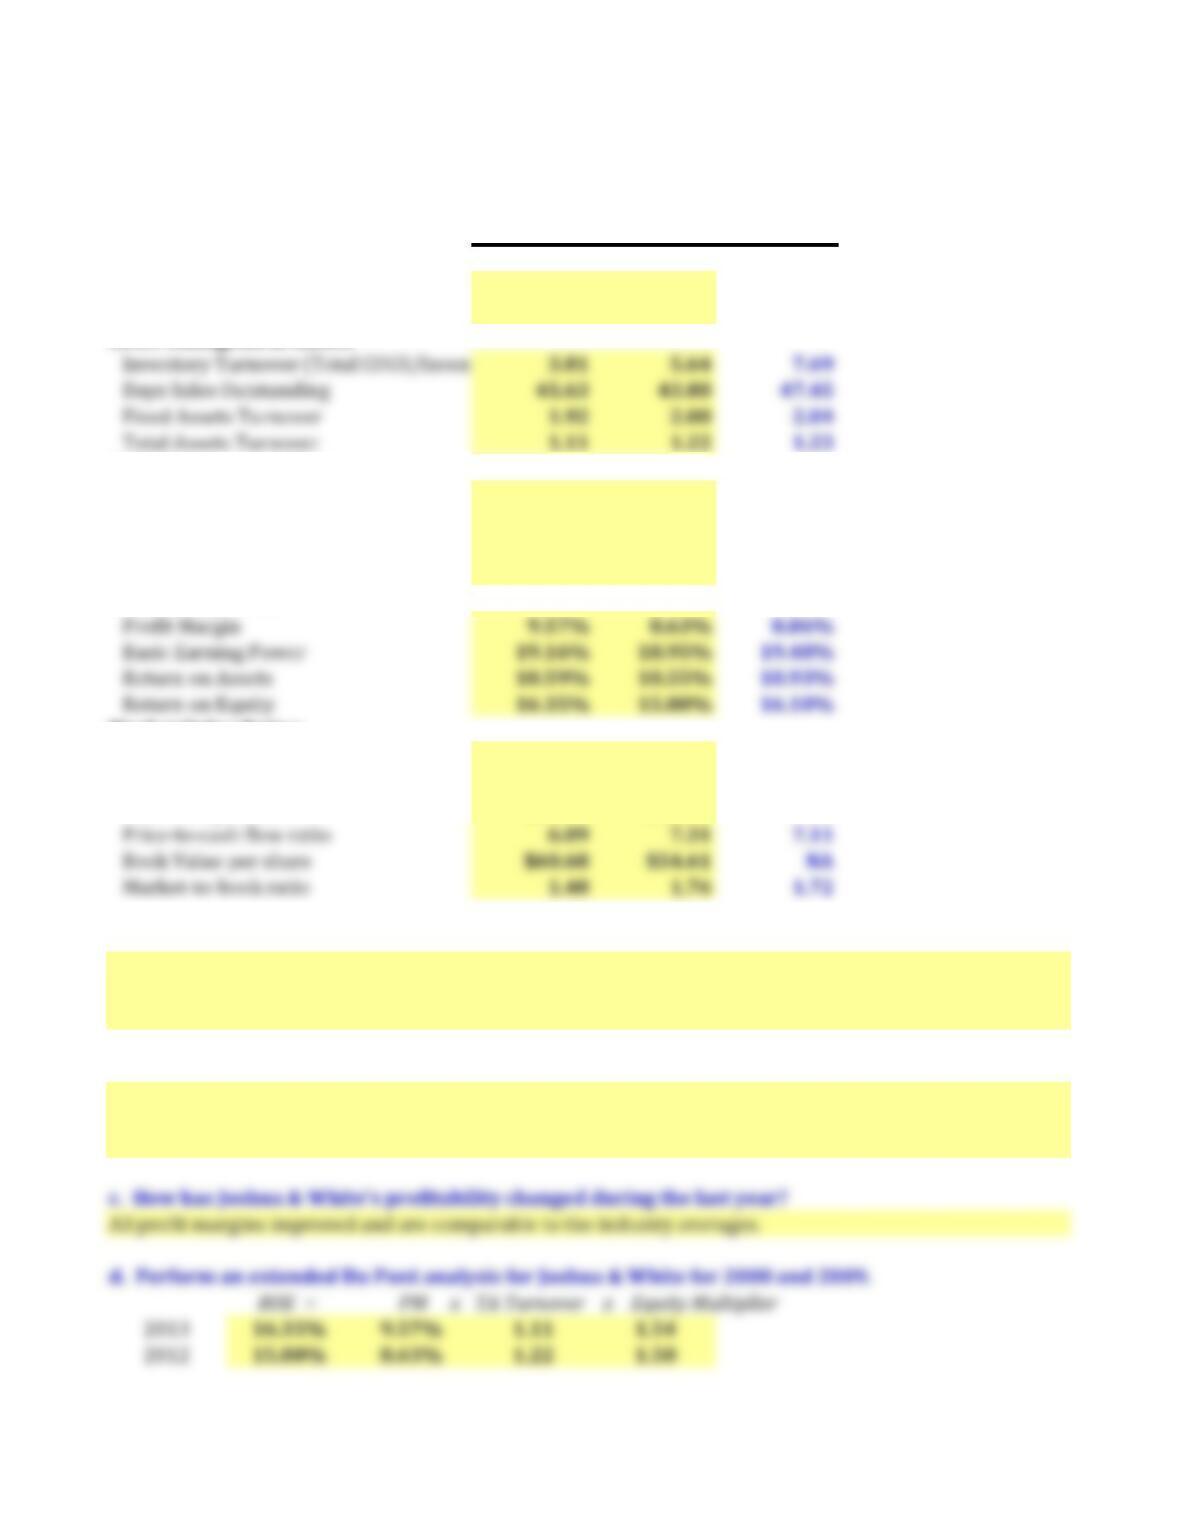
Ratio Analysis 2013 2012 Industry Avg
Liquidity Ratios
Current Ratio 2.44 2.52 2.58
Quick Ratio 1.17 1.41 1.53
Asset Management Ratios
Debt Management Ratios
All profit margins improved and are comparable to the industry averages.
Debt Ratio (Total debt-to-assets) 23.1% 19.8% 20.0%
Liabilities-to-assets ratio 35.2% 33.2% 32.1%
Times-interest-earned ratio 12.67 13.90 15.33
EBITDA coverage ratio 3.66 3.39 4.18
Profitability Ratios
Market Value Ratios
Earnings per share $9.92 $8.63 NA
Price-to-earnings ratio 9.07 11.12 10.65
Cash flow per share $14.77 $13.13 NA
a. Has Joshua & White’s liquidity position improved or worsened? Explain.
b. Has Joshua & White’s ability to manage its assets improved or worsened? Explain.
The current ratio and quick ratio were a little below the industry average initially. However, the quick ratio
fell by a lot while the current ratio fell by just a little. This indicates a build-up in inventory relative to other
current assets.
All asset management ration were close to the industry averages initially (although the DSO was a little
better than the industry average. However, all ratios worsened, with the inventory turnover showing the
biggest change, which again indicates a buildup in inventory.
Inventory Turnover (Total COGS/Inventories)
e. Perform a common size analysis. What has happened to the composition
(that is, percentage in each category) of assets and liabilities?
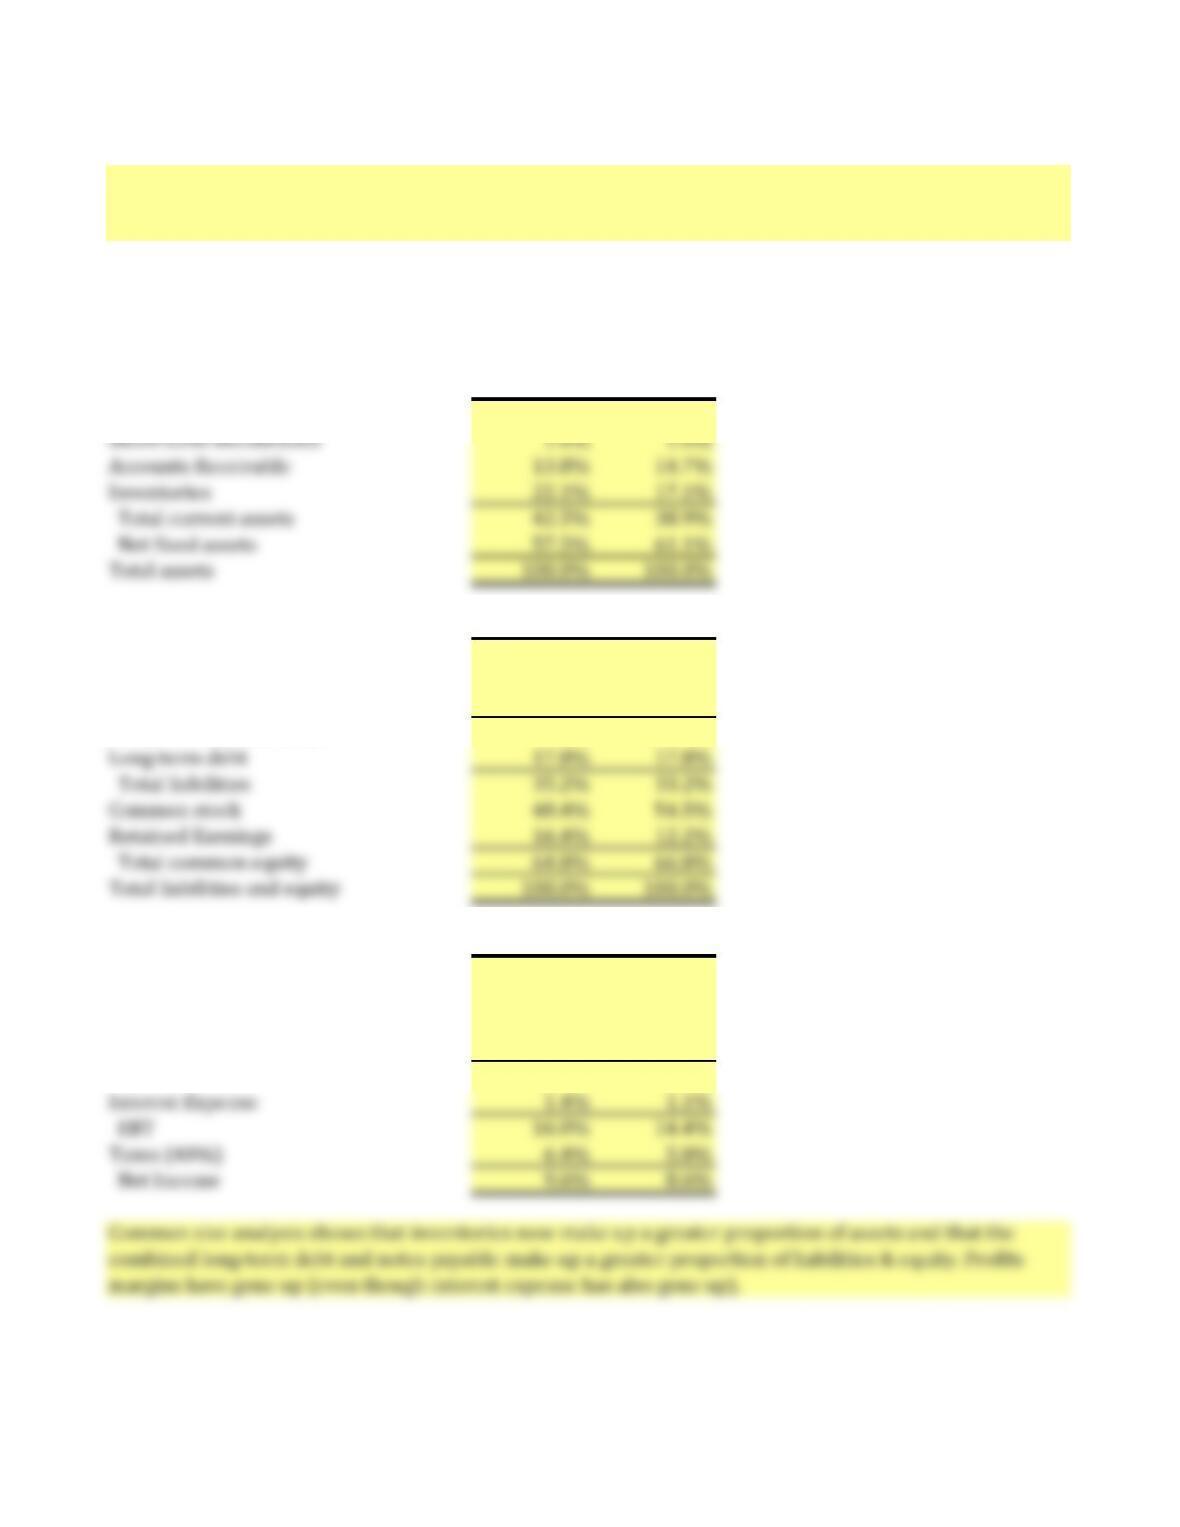
Common Size Balance Sheets
Assets 2013 2012
Cash and cash equivalents 5.5% 6.1%
Liabilities and equity 2013 2012
Accounts payable 8.9% 9.8%
Accruals 3.3% 3.7%
Notes payable 5.2% 2.0%
Total current liabilities 17.4% 15.4%
Common Size Income Statements 2013 2012
Common size analysis shows that inventories now make up a greater proportion of assets and that the
combined long-term debt and notes payable make up a greater proportion of liabilities & equity. Profits
Sales 100.0% 100.0%
COGS except excluding depr. and amort. 71.4% 74.5%
Depreciation and Amortization 4.7% 4.5%
Other operating expenses 6.6% 5.5%
EBIT 17.3% 15.5%
f. Perform a percent change analysis. What does this tell you about the change in profitability
and asset utilization?
ROE improved because the profit margin improved and the equity multiplier increases, despite the
reduction in the total asset turnover ratio. Thus, J&W became more profitable, more leveraged, but less
efficient.
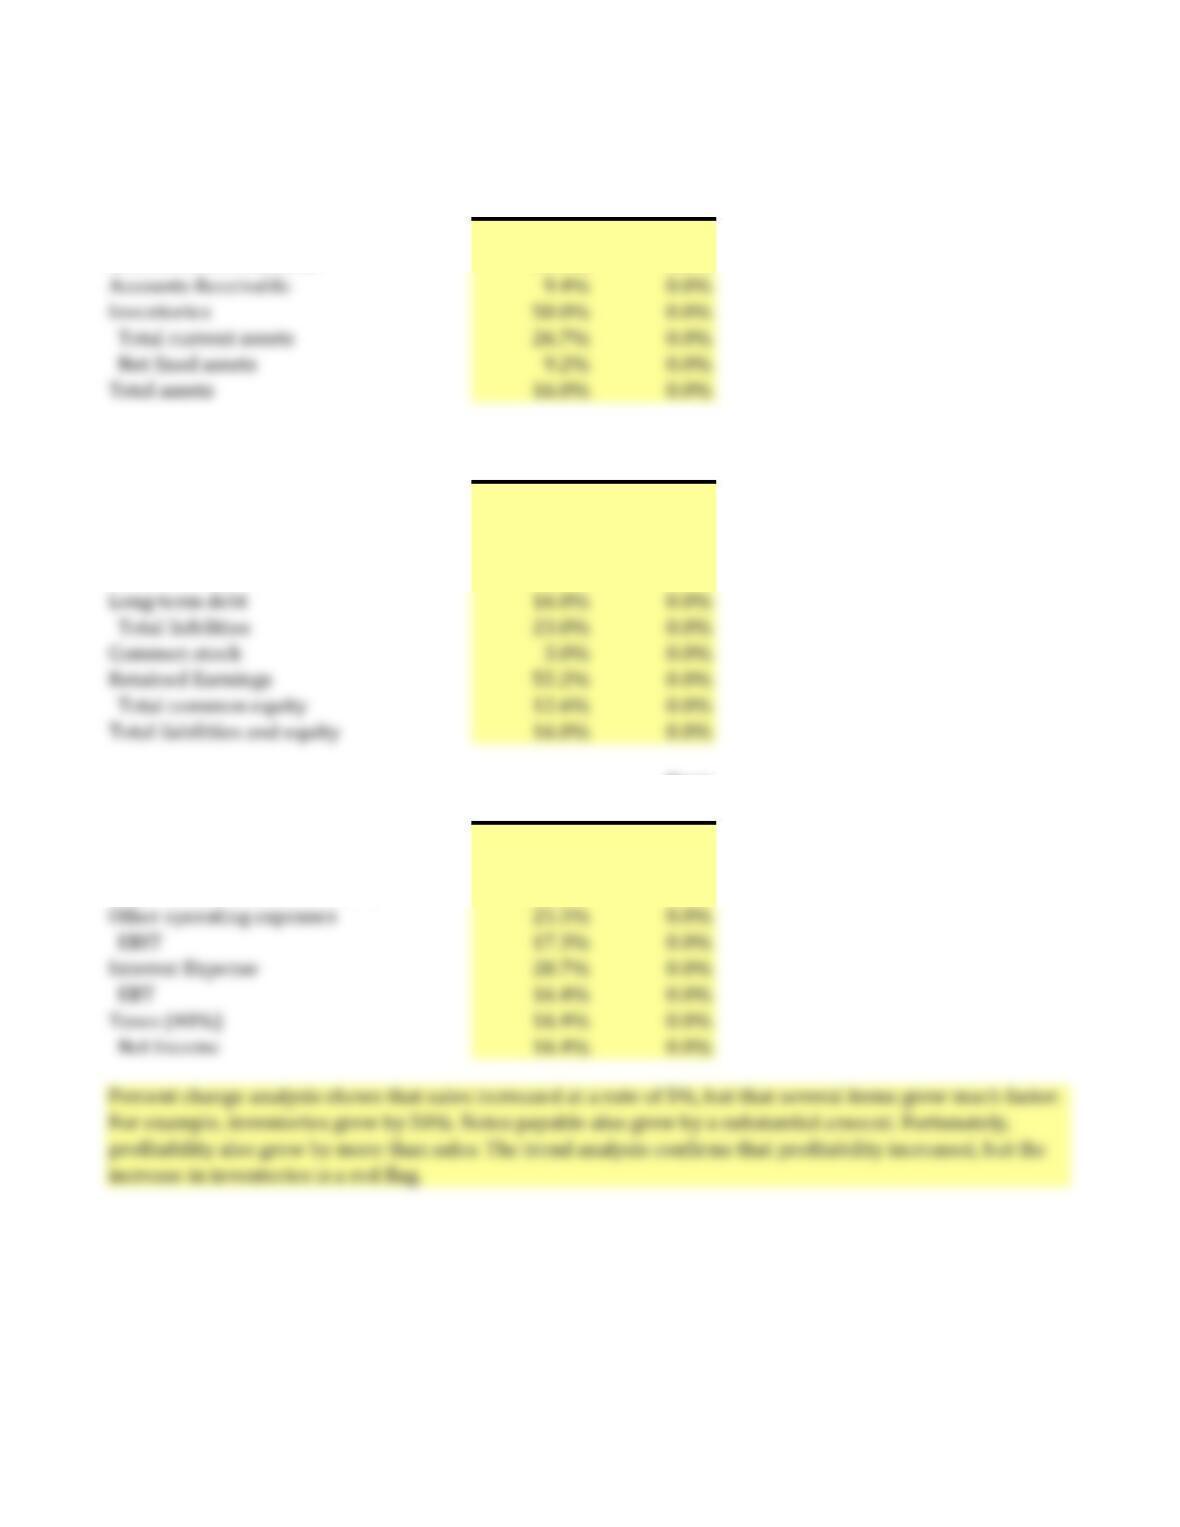
Percent Change Balance Sheets Base
Assets 2013 2012
Cash and cash equivalents 5.0% 0.0%
Short-term investments 16.0% 0.0%
Base
Liabilities and equity 2013 2012
Accounts payable 5.0% 0.0%
Accruals 5.0% 0.0%
Notes payable 207.5% 0.0%
Total current liabilities 31.0% 0.0%
Base
Percent Change Income Statements 2013 2012
Sales 5.0% 0.0%
COGS except excluding depr. and amort. 0.7% 0.0%
Depreciation and Amortization 9.2% 0.0%