
regarding future prices, and changes in the num-
ber of buyers.
Hints and Common Errors: Demand is
technically a function of a bunch of dif fer ent
factors, and we can think of the demand curve as
tochanges in income: in other words, when
income increases, the demand for normal goods
increases, and when income decreases, the
from designer stores, Starbucks coffee, an Apple
watch, a house, or anything that consumers tend
to buy more of when their income increases.
Most goods are normal goods. But there are a few
examples of inferior goods, including ramen noo-
dles, junk food, second hand furniture, anything
is not an inferior good. Studies show that when
income increases, demand for class enrollments
in community colleges and four- year colleges
increases because while some students move from
community college to the university, others may
enroll in community college classes because they
can fi nally afford these classes. Demand for a
good represents the entire market demand for
5. The supply curve shows the relationship between
the price of a good or ser vice and the quantity
produced and put up for sale, either by an
Questions for Review
1. A competitive market is a market that has many
small buyers and sellers and where products are
reasonably similar from one supplier to the next.
The condition of many buyers and sellers is cru-
2. In an economic context, “demand” refers to
being willing and able to purchase a good or ser–
vice. The demand curve relates the price of an
Quantity demanded decreases when price
increases partly because people are less able to buy
the good than they were before. It also decreases
because, even if people could still afford the item,
they would have to value it more than they would
have at the lower price in order for it to be worth
Hints and Common Errors: Some
students may think that a consumer actually likes
an item less when it has a higher price, which
isn’t true. The higher price just raises the amount
that the consumer has to value the item in order
to be willing to purchase it.
3. Because price is one of the axes of the demand
curve, a change in price results in a movement
changes in the prices of related goods, changes in
tastes and preferences, changes in expectations
Solutions to Chapter3 Text Prob lems
more at that price than producers want to supply,
and a shortage will result. Over time, firms will
find it profitable to both raise price and produce
more output, and they will do so until the
and, as a result, reducing production quantity.
The lower prices also make consumers want to
purchase more. Again, these factors combine to
bring markets into equilibrium.
Study Prob lems
1. Presumably, marrying a wealthy man results in
an increase in one’s income. Income is a factor of
Demand
Quantity
Price
Normal Goods
individual firm or by a market of firms. As the
price that a producer can get for its output
increases, it becomes more profitable and there-
fore more attractive to produce that item, all else
6. Because price is one of the axes of the supply
curve, a change in price results in a movement
along the supply curve. A change in a nonprice
supply factor would result in a shift of the entire
supply curve, as a change in a nonprice factor
would alter the fundamental relationship between
price and quantity that is represented by the sup-
ply curve. The factors that would cause the supply
curve to shift are changes in the cost of inputs,
changes in technology and the production pro-
factor changes, the constant in the supply curve
changes, which is why we see a shift.
7. Markets have a tendency to move toward equilib–
rium. For example, say I own a Popsicle stand and
price my product at $4 per Popsicle. At the end of
the day, I have a large surplus of Popsicles left in
my stand. Through the interactions (or lack
thereof!) between my buyers and me, the market
has indicated that my price is too high. I would
then lower my price in an attempt to move
Hints and Common Errors: It’s impor-
tant to note that while the quantity supplied
of silver increases, the supply of silver remains
unchanged because the supply curve for silver
doesn’t shift.
b. An unusually good growing season can, for
economic purposes, be thought of as an
ply of tomatoes.
c. The new medical evidence will not have an
effect on the supply of organic products, as
the medical evidence is a factor that affects
demand rather than supply.
d. If the wages of low- skilled workers increase,
have an effect on the supply of Netix video
rentals, as the price of substitute products is a
factor that affects demand rather than
supply.
4. Complements are goods that tend to be con-
cats and laser pointers tend to be consumed
together and are in fact complements.
6. If two goods are complements (i.e., complemen-
tary goods), a decrease in the price of one of the
goods will increase the demand for the other
good. Starbucks must think that Dave Matthews
appeals to its customers, and Dave Mathews must
believe that having his music placed in Starbucks
will drive sales. If, in fact, the two are comple-
ments as the arrangement suggests, then demand
less labor in the labor market at any given wage,
and this is represented by a leftward shift of the
labor supply curve.
Supply
Wage
Hints and Common Errors: When
drawing a labor supply curve, we still use price
and quantity as our axes, but the “price” of labor
is called the wage, and we represent the quantity
of labor by “hours of labor” or something similar.
There is not a decrease in demand.
b. If the cost of producing tires increases, the
demand for tires is unchanged. This is because
the cost of production is a factor affecting sup-
rior good for Samantha, then Samantha’s
decrease in income will increase her demand
for air travel.
d. The increased presence of mosquitos increases
consumers’ tastes and preferences for citro–
nella, resulting in an increase in the demand
for citronella.
e. Despite the law, motorcycles and helmets are still
items that are consumed together to some degree
rather than items that are consumed instead of
Price
Q
2
Q
1
D
1
S
D
2
Quantity
When the demand curve shifts left and the
supply curve remains the same, the equilibrium
price and quantity both go down.
c. A rise in the price of S9s could certainly be
Price
P
P
2
D
2
S
D
1
However, the equilibrium point could also
move upward because of a decrease in supply,
which in the graph appears as a leftward shift of
the supply curve.
Price
S
1
D
S
2
$35
$40
$45
$50
Price
(thousands)
11. a. If people expect the price of a good to fall in
the future, some of them will put off buying it.
This causes the pre sent demand to fall, which
means that the demand curve shifts left. At the
Price
D
1
S
1
S
2
D
2
When the demand curve shifts left and the sup-
ply curve shifts right, the equilibrium price goes
down— which makes this a case of self- fulfilling
expectations. The equilibrium quantity goes
down if the demand shift dominates but up if
the supply shift dominates. If neither shift dom-
in demand will decrease equilibrium price and
decrease equilibrium quantity. Clearly, two
decreases combine to make a bigger decrease, so
the increase in supply and the decrease in
demand create a decrease in equilibrium price.
and demand increase— can be illustrated by the
following set of graphs:
Price
Q
1
Q
2
D
1
S
1
S
2
D
2
Quantity
increase.
Hints and Common Errors: It’s common
for students to draw simultaneous changes in
supply and demand of the same magnitude and
then conclude that either price or quantity stays
the same as the result of the two changes. It’s
impor tant to remember, however, that we don’t
know the relative magnitudes of the changes in
supply and demand, and we get dif fer ent
answers, depending on which shift we draw as
Appendix Questions for Review
1. When supply and demand change at the same
time, we can look at the changes individually and
then put them together in order to determine the
overall effect. For example, consider a case where
equilibrium quantity. The effect on price, however,
is ambiguous because it’s unclear whether a com-
bination of a price decrease and a price increase
results in an overall increase or decrease. The over–
all result on price will be determined by which
shift is dominant, or larger in magnitude.
Conversely, consider a case where both
supply and demand decrease. The decrease in
biggerdecrease, so the decrease in supply and
thedecrease in demand create a decrease in
equilibrium quantity. The effect on price,
We can also consider cases where supply and
demand move in opposite directions. Consider a
case where supply decreases and demand
increases. The decrease in supply will increase
equilibrium price and decrease equilibrium
quantity, and the increase in demand will
increase equilibrium price and increase
equilibrium quantity. Clearly, two increases
combine to make a bigger increase, so the
decrease in supply and the increase in demand
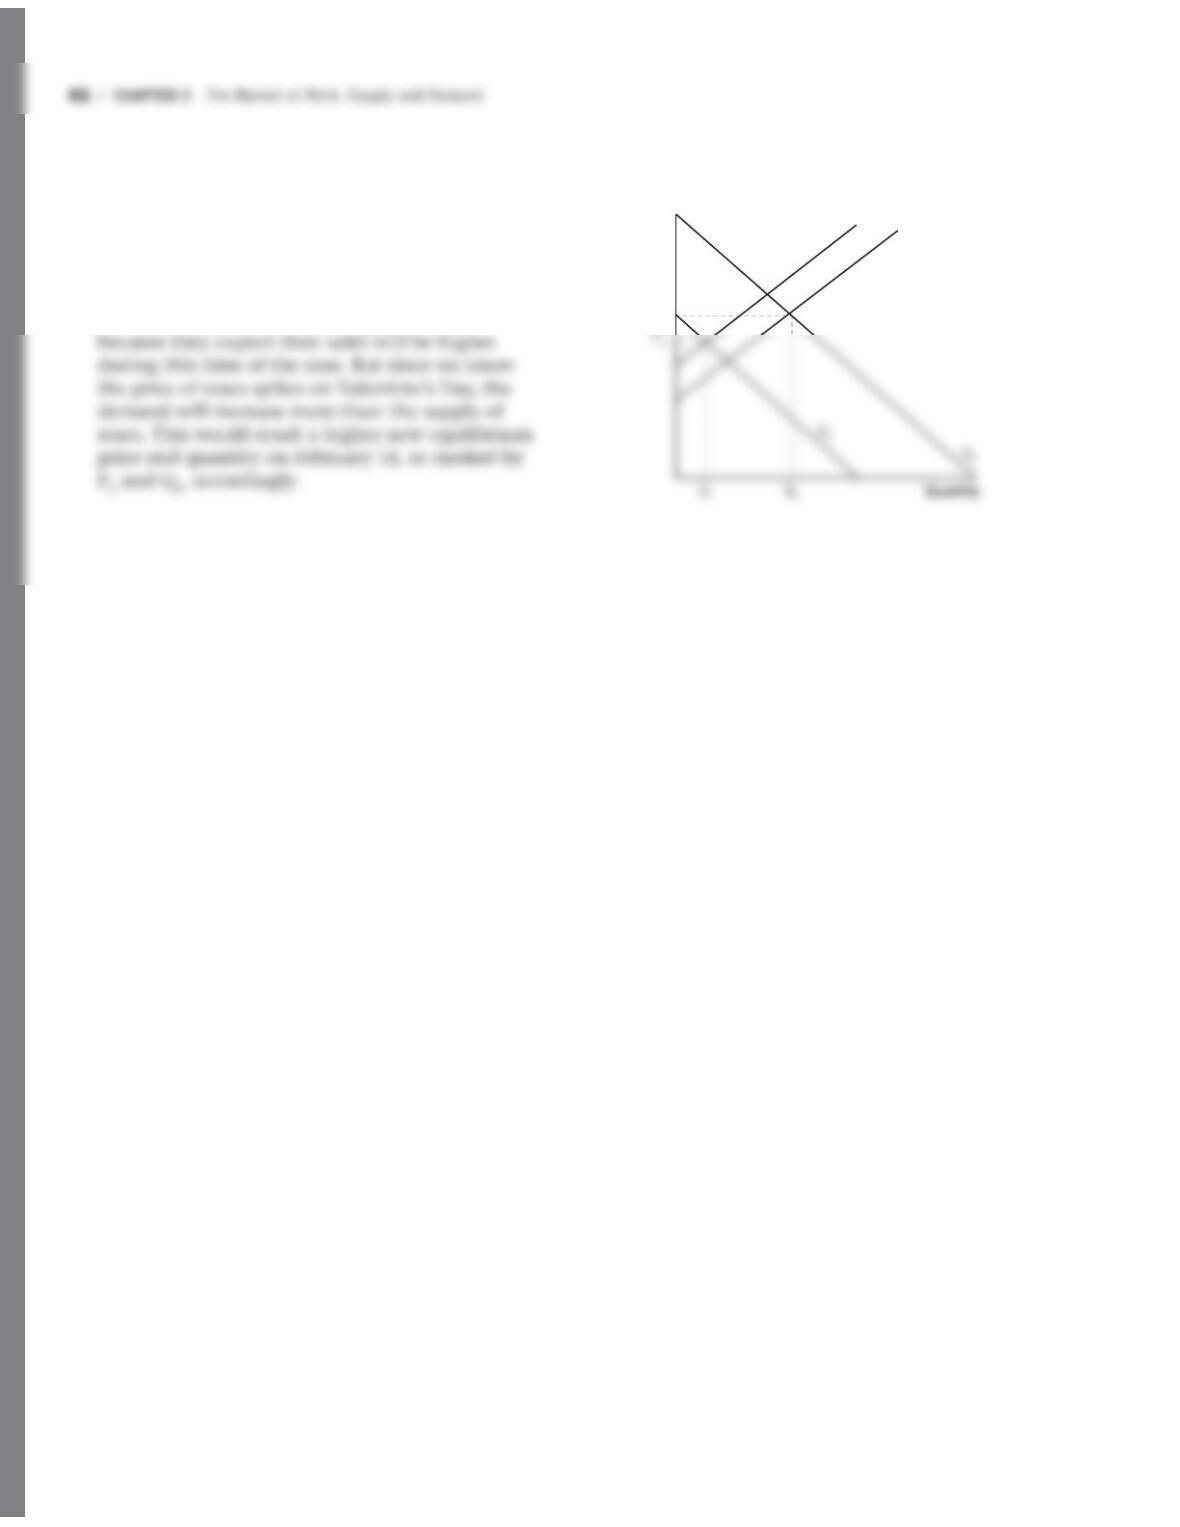
Note: If the supply of roses increases more
than the demand, then the price will be lower
than the original price.
Price
P
2
S
1
S
2
Appendix Study Prob lem
2. As shown in the following graph, an original
equilibrium price and quantity of roses are
marked by P1 and Q1 on January31. As Valen-
tine’s Day approaches, the demand for roses
increases, and the demand curve shifts to the
right. Stores and businesses that sell these beauti–
ful roses also increase their supply of roses