S-21
interactive activity
2 Appendix
Graphs in Economics
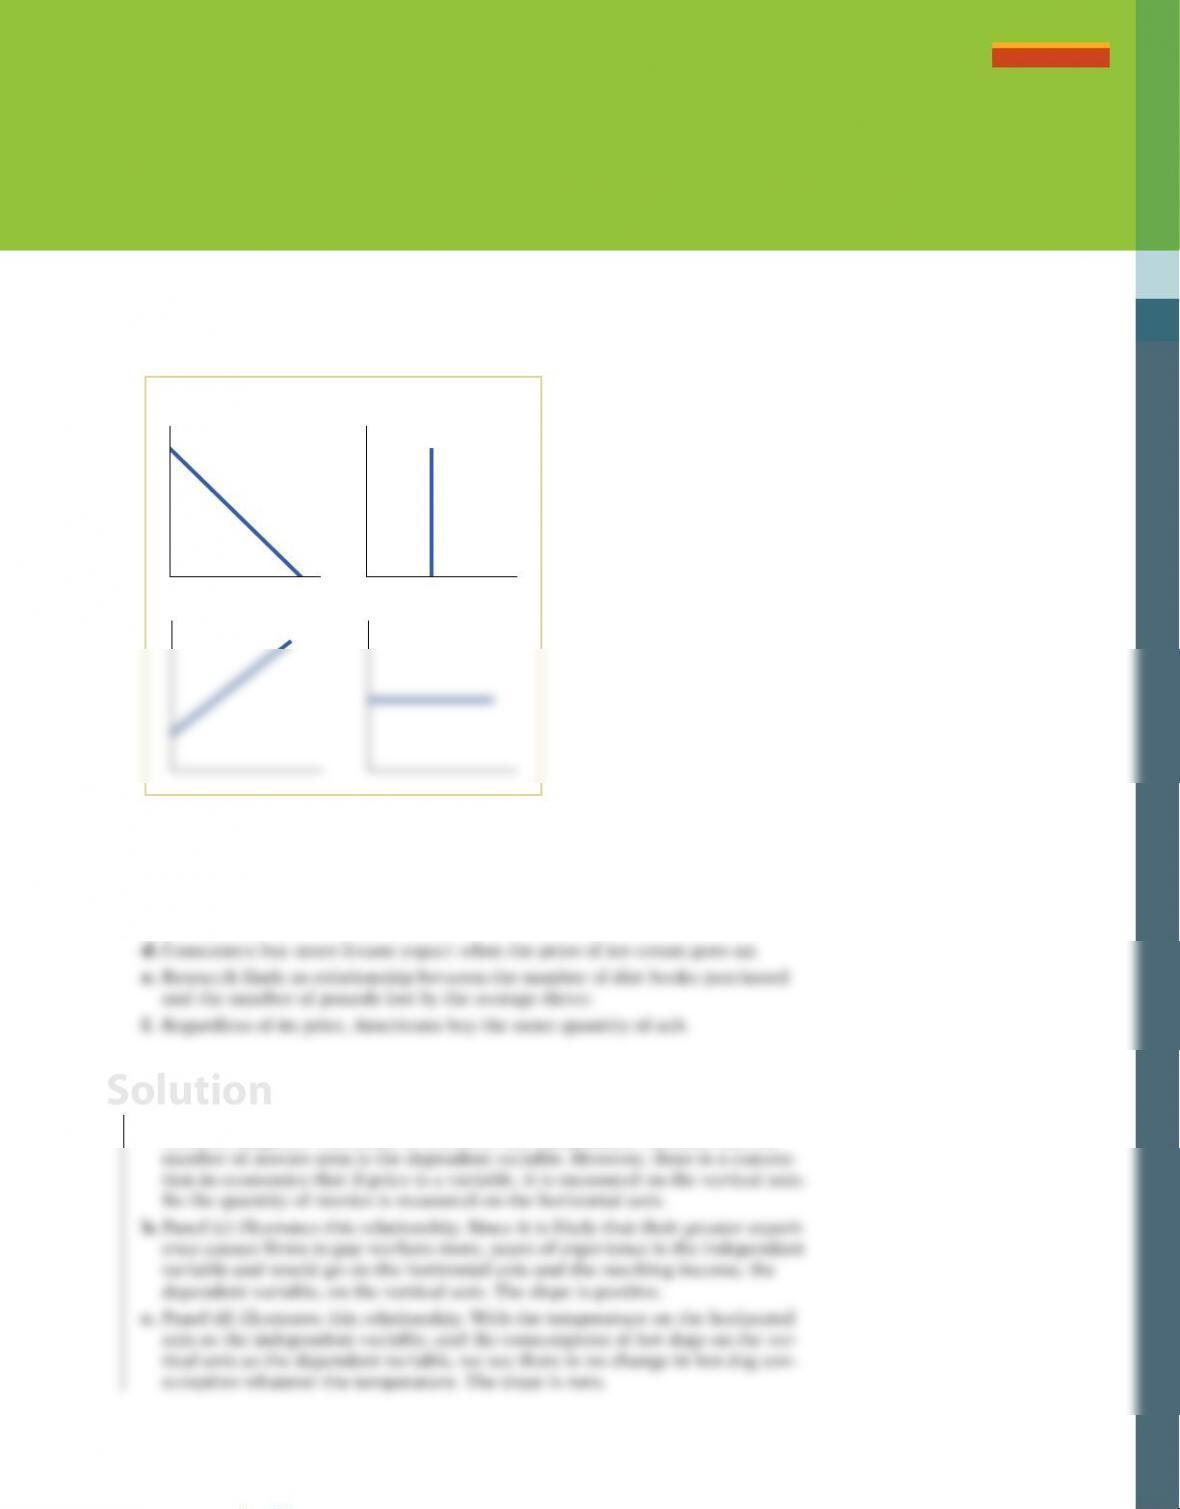
1. Study the four accompanying diagrams. Consider the following statements and
indicate which diagram matches each statement. Which variable would appear
on the horizontal and which on the vertical axis? In each of these statements, is
the slope positive, negative, zero, or infinity?
Panel (a) Panel (b)
Panel (c) Panel (d)
a. If the price of movies increases, fewer consumers go to see movies.
b. More experienced workers typically have higher incomes than less experienced
workers.
c. Whatever the temperature outside, Americans consume the same number of
hot dogs per day.
1. a. Panel (a) illustrates this relationship. The higher price of movies causes con-
sumers to see fewer movies. The relationship is negative, and the slope is
therefore negative. The price of movies is the independent variable, and the
Solution
S-22 2 APPENDIX Graphs in Economics
d. Panel (c) illustrates this relationship. When the price of ice cream goes up, this
causes consumers to choose a close alternative, frozen yogurt. The price of ice
cream is the independent variable and the consumption of frozen yogurt is the
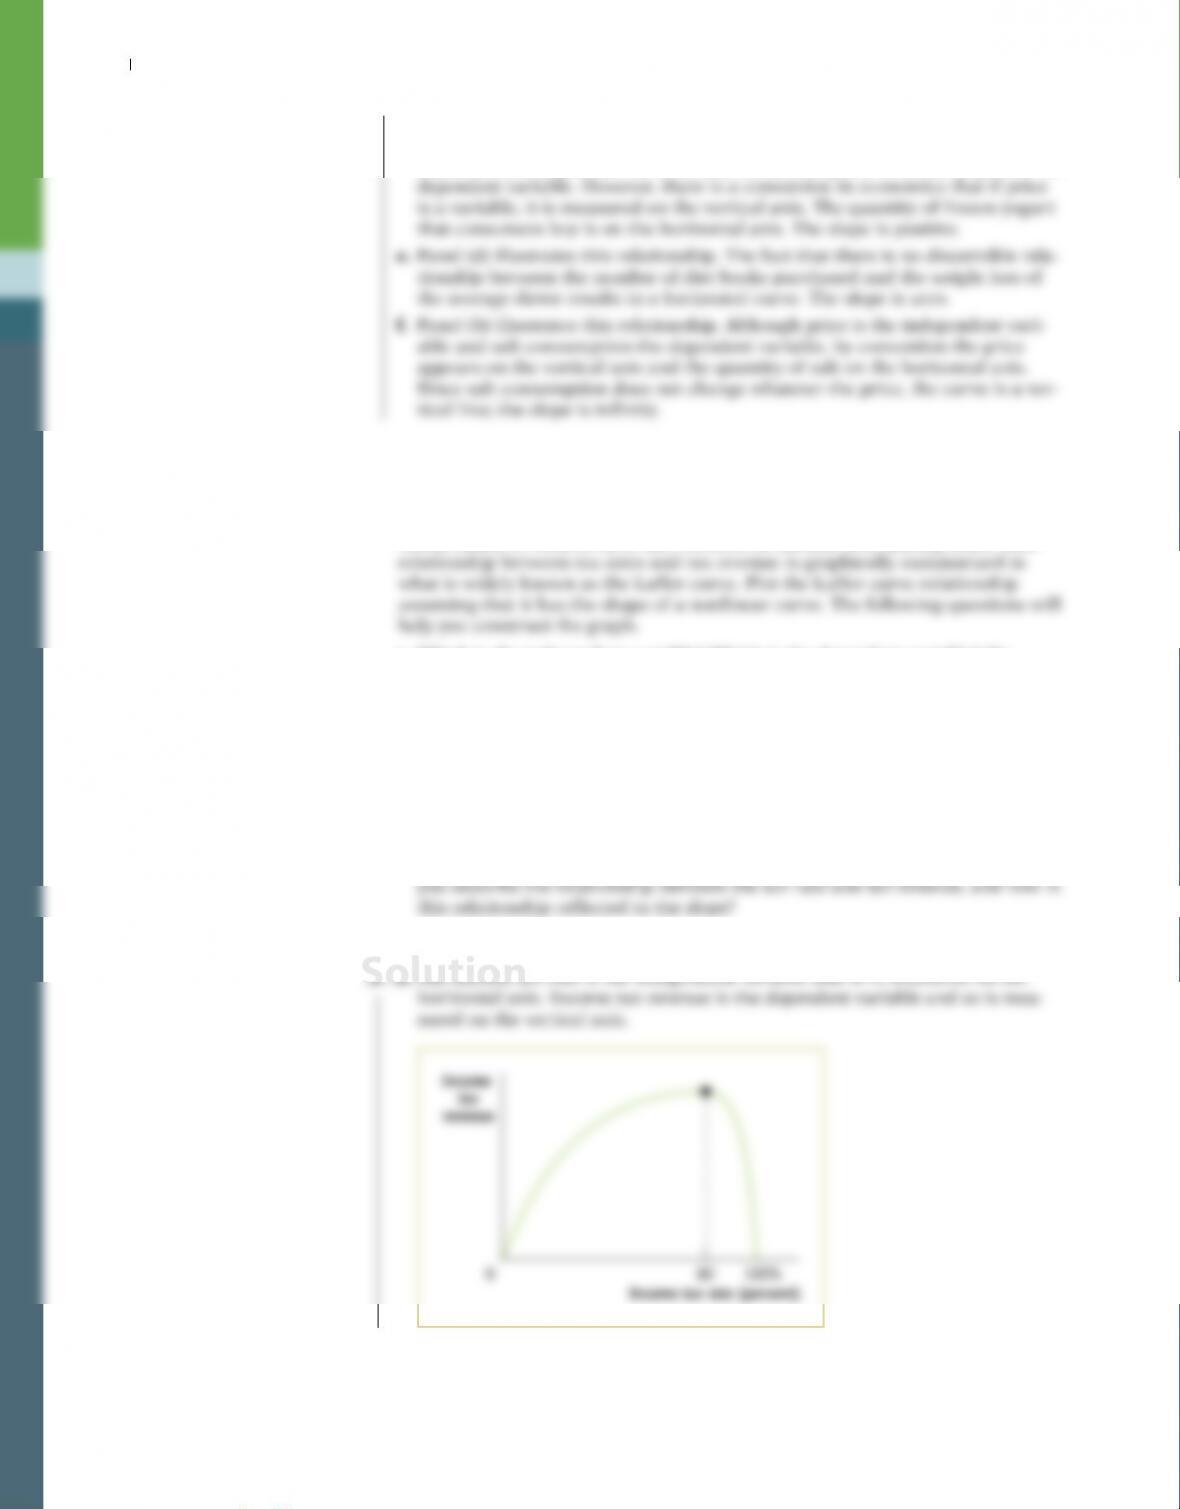
2. During the Reagan administration, economist Arthur Laffer argued in favor of
lowering income tax rates in order to increase tax revenues. Like most econo–
mists, he believed that at tax rates above a certain level, tax revenue would fall
because high taxes would discourage some people from working and that people
would refuse to work at all if they received no income after paying taxes. This
a. Which is the independent variable? Which is the dependent variable? On
which axis do you therefore measure the income tax rate? On which axis do
you measure income tax revenue?
b. What would tax revenue be at a 0% income tax rate?
c. The maximum possible income tax rate is 100%. What would tax revenue be at
a 100% income tax rate?
d. Estimates now show that the maximum point on the Laffer curve is (approxi-
mately) at a tax rate of 80%. For tax rates less than 80%, how would you
describe the relationship between the tax rate and tax revenue, and how is this
relationship reflected in the slope? For tax rates higher than 80%, how would
2 APPENDIX Graphs in Economics S-23
b. If the income tax rate is 0% (there is no tax), tax revenue is obviously zero.
c. If the income tax rate is 100% (all your income is taxed away), you will have
zero income left after tax. Since people are unwilling to work if they receive
no income after tax, no income will be earned. As a result, there is no income
tax revenue.
d. For tax rates less than 80%, tax rate and tax revenue are positively related and
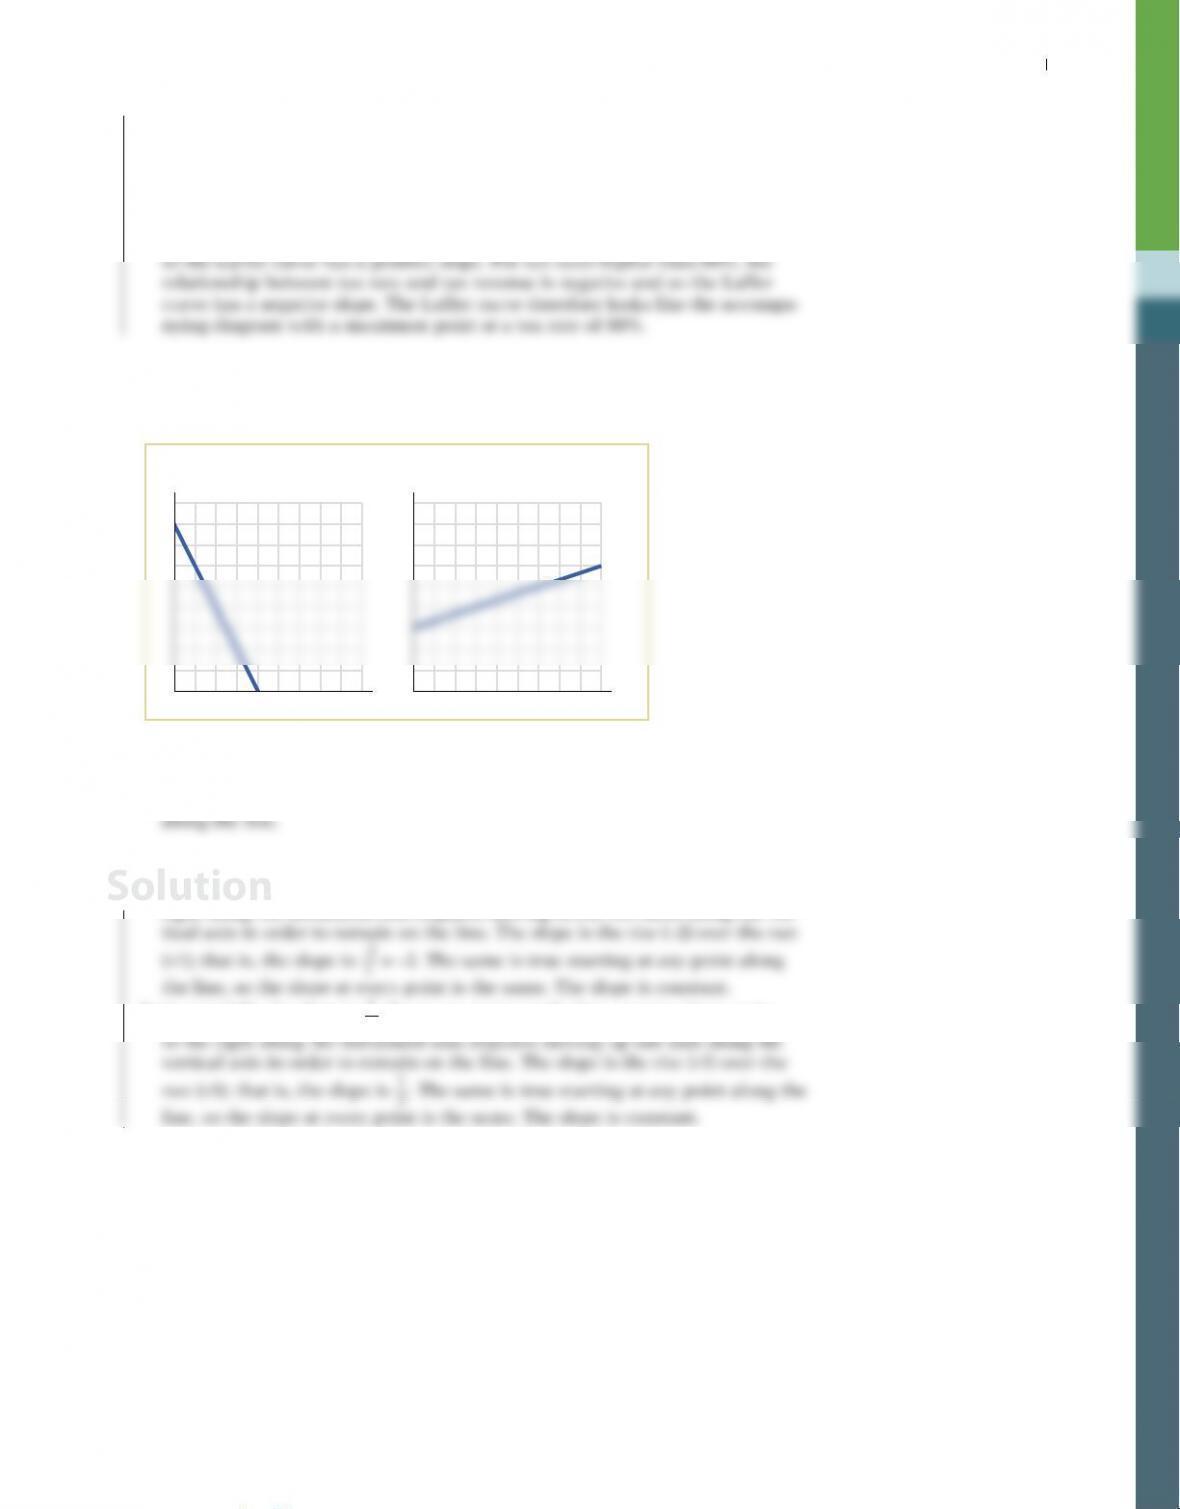
3. In the accompanying figures, the numbers on the axes have been lost. All you
know is that the units shown on the vertical axis are the same as the units on
the horizontal axis.
y
x
y
x
Panel (a) Panel (b)
a. In panel (a), what is the slope of the line? Show that the slope is constant along
the line.
b. In panel (b), what is the slope of the line? Show that the slope is constant
3. a. In panel (a), the slope is –2. From any point on the line, moving one unit to the
right along the horizontal axis requires moving down two units along the ver-
b. In panel (b), the slope is 1
3. From any point on the line, moving three units
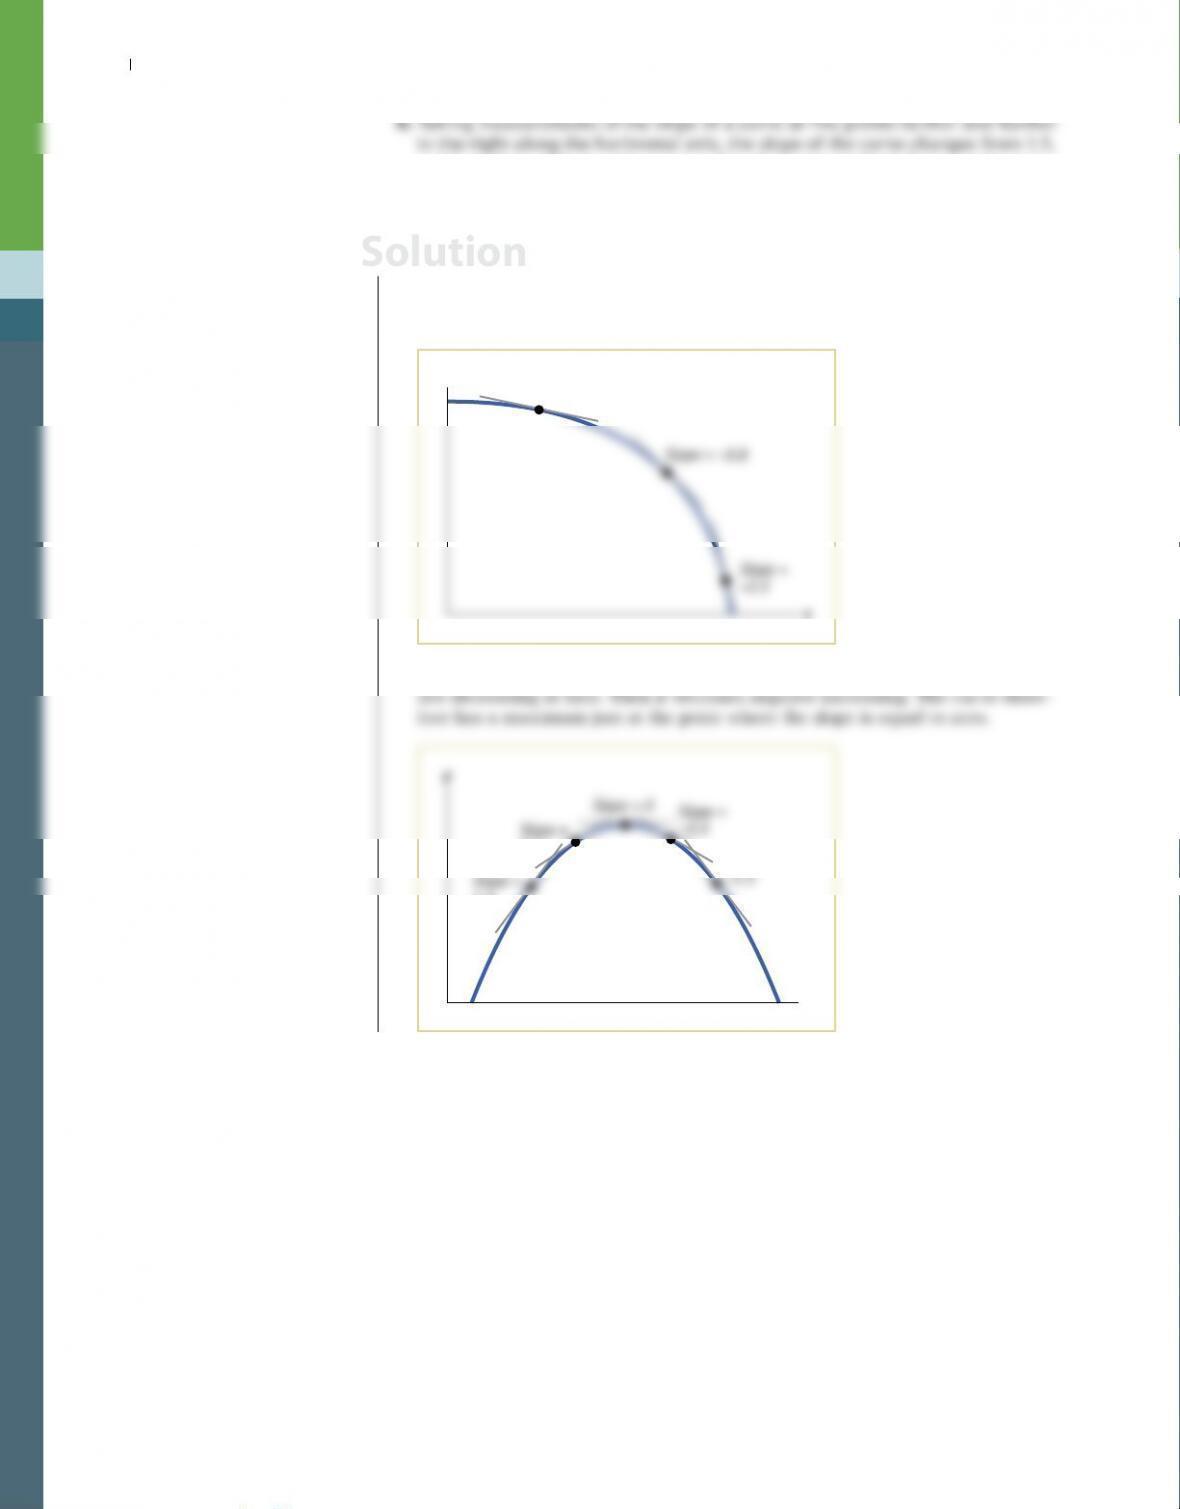
4. Answer each of the following questions by drawing a schematic diagram.
a. Taking measurements of the slope of a curve at three points farther and
farther to the right along the horizontal axis, the slope of the curve changes
from –0.3, to –0.8, to –2.5, measured by the point method. Draw a schematic
diagram of this curve. How would you describe the relationship illustrated in
your diagram?
Solution
S-24 2 APPENDIX Graphs in Economics
to 0.5, to 0, to –0.5, to –1.5, measured by the point method. Draw a schematic
diagram of this curve. Does it have a maximum or a minimum?
4. a. The accompanying diagram schematically shows this curve. The slope is nega–
tive throughout. That means that the curve is downward sloping. Because the
absolute value of the slope is increasing, the curve becomes steeper. The slope
is negative increasing.
y
x
Slope = –0.3
b. The accompanying diagram schematically shows this curve. The slope is posi-
Solution
2 APPENDIX Graphs in Economics S-25
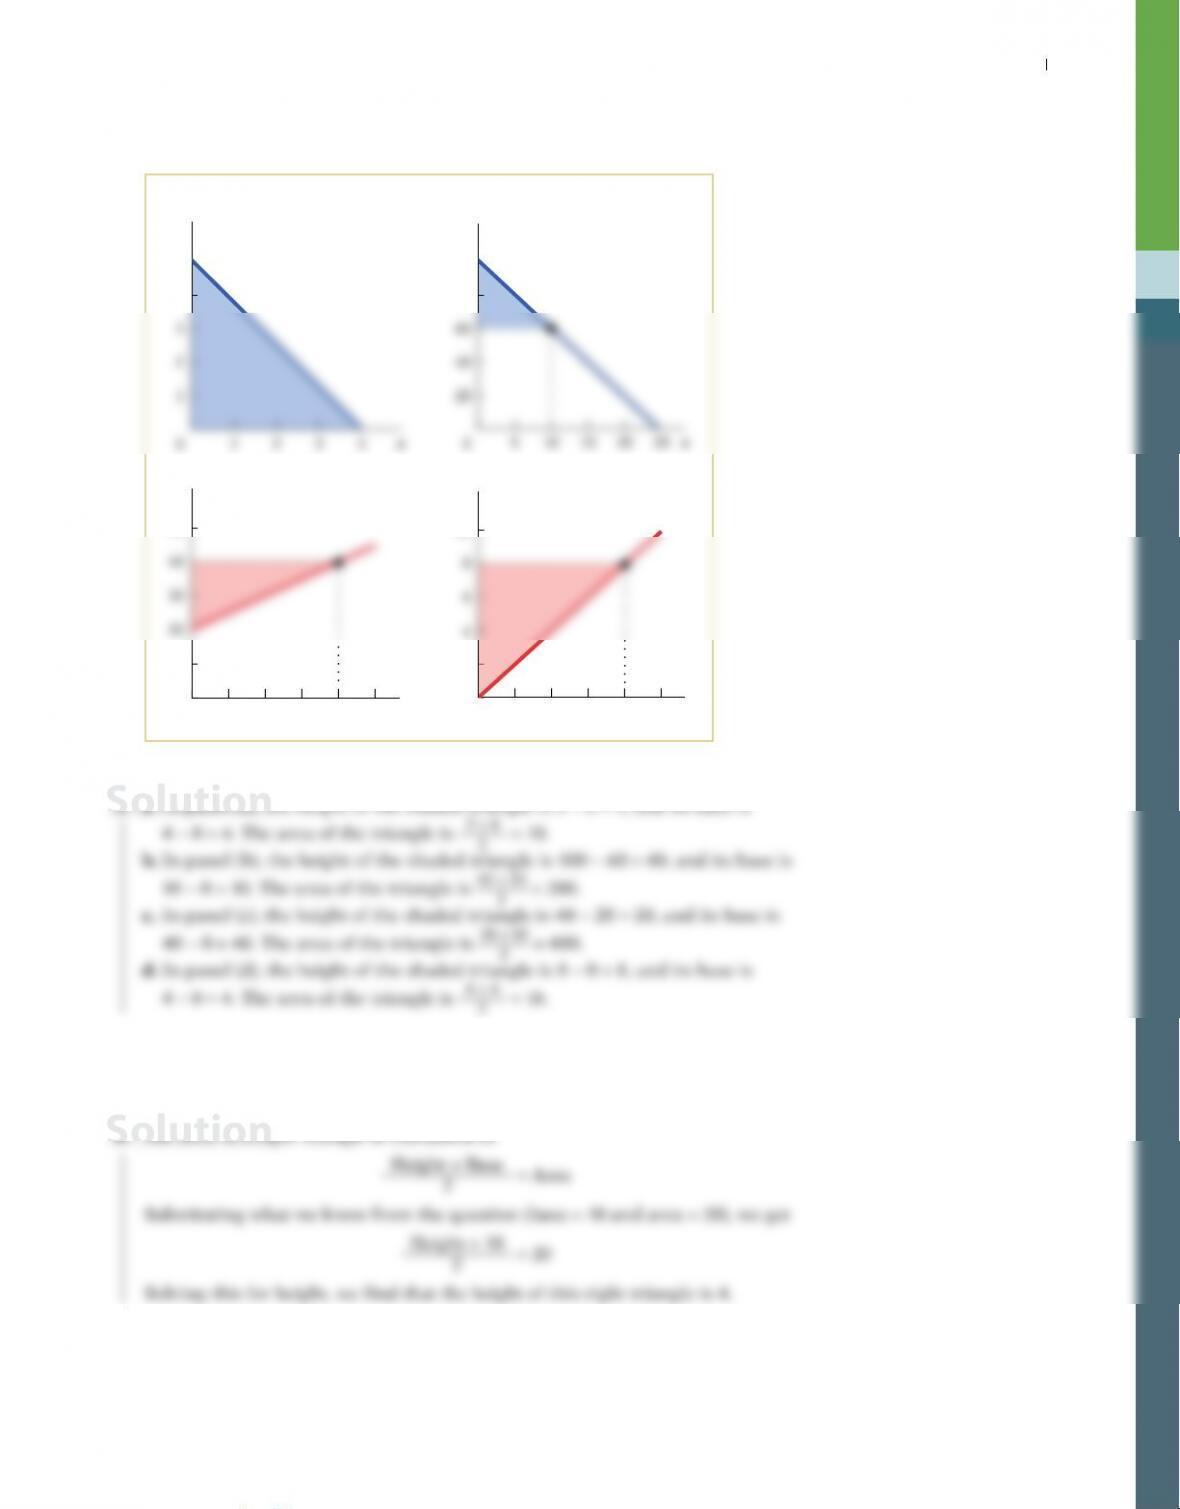
5. For each of the accompanying diagrams, calculate the area of the shaded right
triangle.
5
4
y
100
80
y
Panel (a) Panel (b)

7. The accompanying table shows the relationship between workers’ hours of work
per week and their hourly wage rate. Apart from the fact that they receive a dif-
ferent hourly wage rate and work different hours, these five workers are other-
wise identical.
Name
Quantity of labor
(hours per week)
Wage rate
(per hour)
Athena 30 $15
Diego 36 60
Emily 32 75
a. Which variable is the independent variable? Which is the dependent variable?
b. Draw a scatter diagram illustrating this relationship. Draw a (nonlinear) curve
that connects the points. Put the hourly wage rate on the vertical axis.
c. As the wage rate increases from $15 to $30, how does the number of hours
worked respond according to the relationship depicted here? What is the average
slope of the curve between Athena’s and Boris’s data points using the arc method?
7. a . If the wage rate is greater than your opportunity cost of time, you will choose
to work. So the wage rate is the independent variable and the number of hours
worked is the dependent variable.
b. The accompanying diagram illustrates the relationship between the hourly
wage rate and the number of hours worked. Since the hourly wage rate is the
price paid for labor, economists place wages on the vertical axis—just as in
the case of other types of prices.
$75
0
Wage rate
(per hour)
Quantity of labor (hours per week)
28 29 30 31 32 33 34 35 36 37
c. As the wage rate increases from $15 to $30, the number of hours worked
increases by 5. The average slope of the curve between the two points is
therefore 15
Solution
2 APPENDIX Graphs in Economics S-27
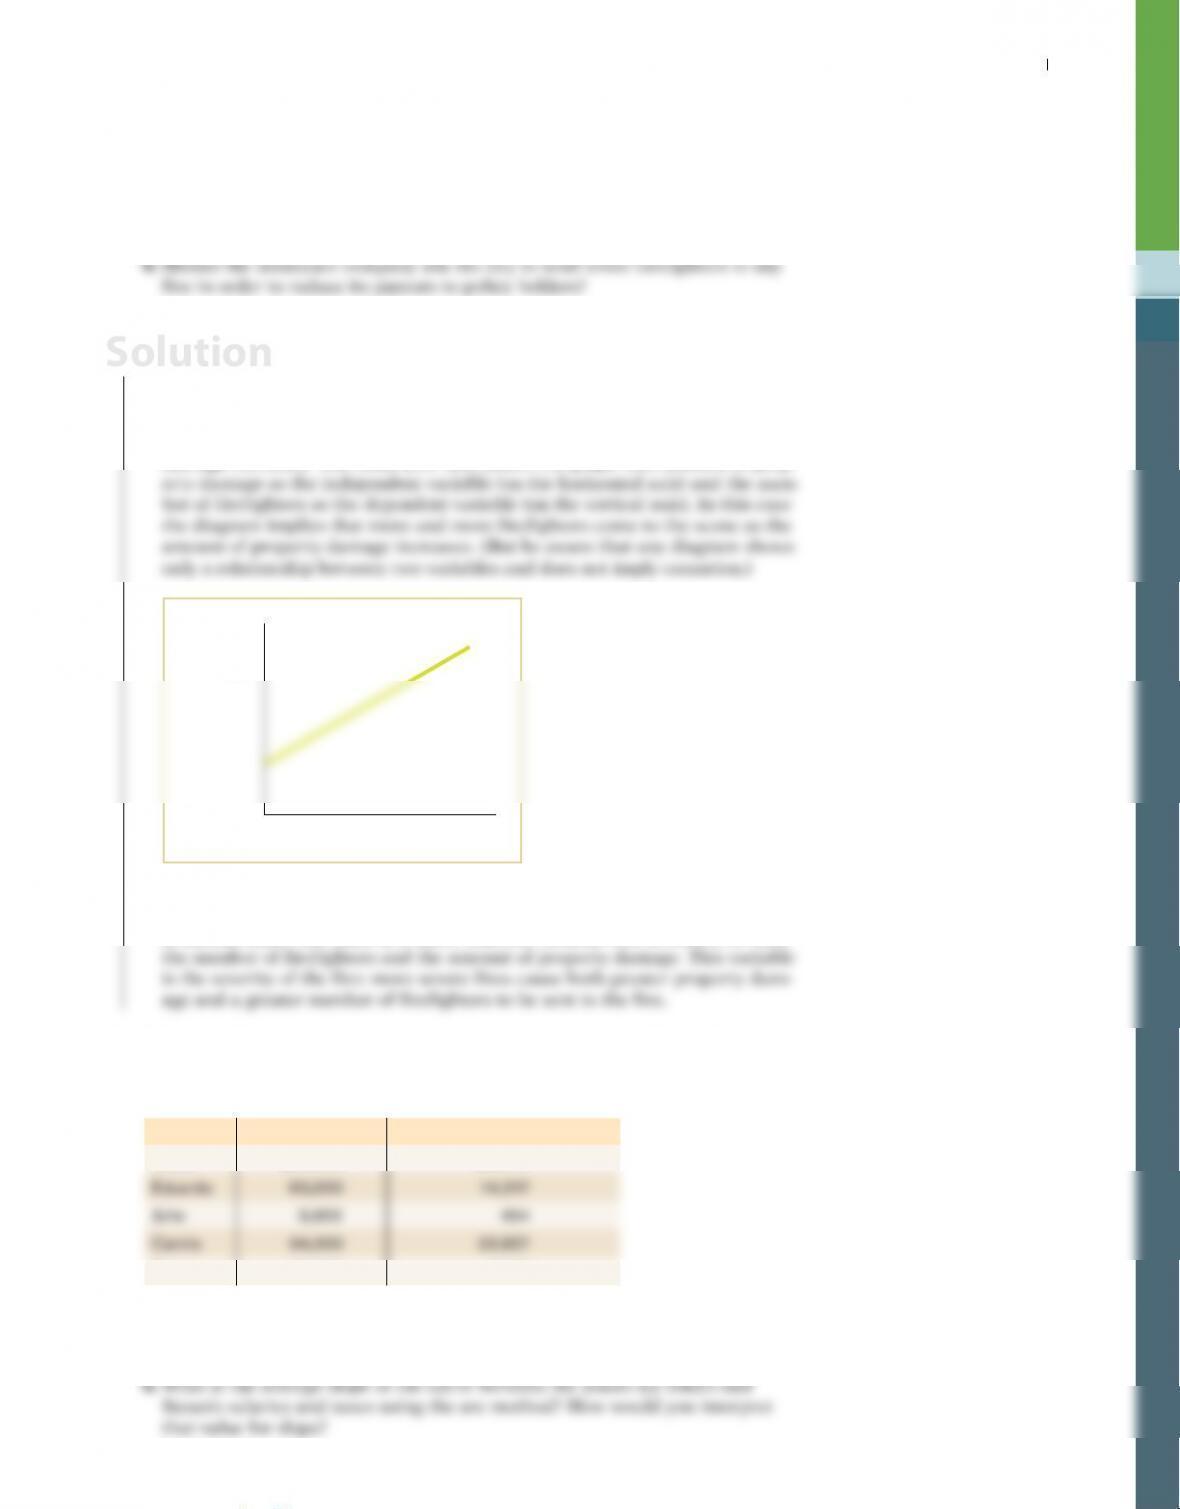
8. An insurance company has found that the severity of property damage in a fire
is positively related to the number of firefighters arriving at the scene.
a. Draw a diagram that depicts this finding with number of firefighters on the
horizontal axis and amount of property damage on the vertical axis. What is
the argument made by this diagram? Suppose you reverse what is measured
on the two axes. What is the argument made then?
8. a. By drawing the diagram with number of firefighters on the horizontal axis
and amount of property damage on the vertical axis, you are assuming that
the number of firefighters is the independent variable and amount of property
damage is the dependent variable. That graph is shown here. It makes the argu–
ment that as the number of firefighters on the scene increases, the amount of
damage increases. You could also have drawn the graph with amount of prop–
Amount of
property
damage
Number of firefighters
b. The statement implies that there is a causal link between the number of fire–
fighters and the amount of property damage, and this is likely not the case. It
is instead likely that there is a third, omitted, variable that is related to both
9. This table illustrates annual salaries and income tax owed by five individu-
als. Despite receiving different annual salaries and owing different amounts of
income tax, these five individuals are otherwise identical.
Name Annual salary Annual income tax owed
Susan $22,000 $3,304
Peter 37,000 7,020
a. If you were to plot these points on a graph, what would be the average slope
of the curve between the points for Eduardo’s and Camila’s salaries and taxes
using the arc method? How would you interpret this value for slope?
Solution
S-28 2 APPENDIX Graphs in Economics
c. What happens to the slope as salary increases? What does this relationship
9. a. Annual salary is the independent variable and so is measured on the horizon-
c. The slope is positive increasing. This implies that the tax scheme is “progres-
sive”: the higher the annual salary, the greater the amount of income tax owed
per dollar of income. Therefore, the incentive to earn more and more income
becomes weaker and weaker, since more of the additional income earned is
owed as income taxes.
WORK IT OUT Interactive step-by-step help with solving this
problem can be found online.
10. Studies have found a relationship between a country’s yearly rate of eco–
nomic growth and the yearly rate of increase in airborne pollutants. It
is believed that a higher rate of economic growth allows a country’s resi-
dents to have more cars and travel more, thereby releasing more airborne
pollutants.
a. Which variable is the independent variable? Which is the dependent
variable?
b. Suppose that in the country of Sudland, when the yearly rate of economic
growth fell from 3.0% to 1.5%, the yearly rate of increase in airborne pol-
lutants fell from 6% to 5%. What is the average slope of a nonlinear curve
between these points using the arc method?
c. Assume that when the yearly rate of economic growth rose from 3.5% to
4.5%, the yearly rate of increase in airborne pollutants rose from 5.5% to
7.5%. What is the average slope of a nonlinear curve between these two
points using the arc method?
d. How would you describe the relationship between the two variables here?
–1.5 = 2
3.
c. The change in the growth rate is +1. The change in the rate of increase in
Solution