CHAPTER 27
Simple Analytics of Supply and Demand
LEARNING OBJECTIVES
Define and explain the basics of supply and demand analysis.
OUTLINE OF CHAPTER
I. The Market System and Individual Markets
Supply, Demand, and Prices
II. Progressive Criticisms of Supply and Demand Analysis
III. Summary
KEY TERMS
demand
the quantity of the good buyers would be willing and able to purchase during a given period, at
various price levels, holding all other things constant
demand curve
illustrates graphically the relationship between prices and the quantity demanded
demand schedule
various prices
says there is an inverse relationship between price and quantity demanded
declares that a positive relationship exists b
etween price and the quantity supplied of any good
all other things constant
ANSWERS TO END OF CHAPTER REVIEW QUESTIONS
Define and explain the basics of supply and demand analysis.
1. Explain what is mea
Market refers to the process through which buyers and sellers exchange money for goods
2. State the law of demand. State the law of supply. What is meant by the phrase
The law of demand says there is an inverse relationship between price and quantity
3. What is equilibrium? Why is it significant? Does it ever change?
Understand the context in which the supply and demand model is developed.
4. Explain why the focus of supply and demand analysis is strictly limited to exchange?
5. Does the demand curve in the supply and demand model capture all the people who want
or desire a good? Why or why not?
Explain the progressive critiques of supply and demand analysis.
6. What happens to supply and demand analysis if the government intervenes in the market?
7. Are there many real world examples of perfectly competitive markets? What might that
mean for supply and demand analysis? Give an example.
Equilibrium
LEARNING OBJECTIVES FOR APPENDIX 27.1
Define equilibrium and explain what it means.
OUTLINE OF APPENDIX
I. Equilibrium
II. Changes in Quantity Demanded versus Changes in Demand
KEY TERMS
change in demand
a situation in which the entire demand schedule or line shifts either out (to the right) or in (to the
left)
change in quantity demanded
when a change in price causes the quanti
ty demanded for a good to change
change in quantity supplied
when a change in price causes the quantity supplied for a good to change
change in supply
left)
the quantity demanded exceeds the quantity supplied
the quantity supplied will exceed the quantity d
ANSWERS TO APPENDIX 27.1 REVIEW QUESTIONS
Define equilibrium and explain what it means.
1. What is equilibrium? Why is it such an important concept?
When the quantity demanded for a particular good are equal at a particular price. At
Understand and describe what happens when a market is not in equilibrium.
2. Use supply and demand to explain excess supply. What might cause excess supply?
Describe the process that eliminates excess supply.
Excess supply is a surplus, which means that quantity supplied exceeds the quantity
3. Use supply and demand to explain excess demand. What might cause excess demand?
Describe the process that eliminates excess demand.
Explain how equilibrium changes in the market.
4. Carefully distinguish between a change in demand and a change in the quantity –
demanded.
A change in demand refers to a change in the entire demand schedule the line shifts out
5. What three factors can cause a change in demand? What factor can cause a change in the
quantity demanded?
6. Carefully distinguish between a change in supply and a change in the quantity supplied.
A change in supply refers to a situation where the entire supply schedule or line shifts
7. What factors can cause a change in supply? What causes a change in the quantity –
supplied?
A change in supply may occur as a result of anything that changes the costs of

8. Draw a simple supply and demand curve diagram for coffee. Assume that incomes of
consumer are rising. What happens to demand and supply? What happens to equilibrium
price and quantity?
Higher consumer income causes an increase in demand. Equilibrium price and quantity
9. Assume that for some reason the coffee price in the previous question is above the
equilibrium price. What pressures would cause this market to tend toward equilibrium?
10. Assume that the price of coffee is below equilibrium. What pressures would cause this
market to tend toward equilibrium?
11. Suppose that the market for wooden Number 2 lead pencils is in equilibrium. Determine
how the following shocks will affect the equilibrium price and quantity. Draw a graph to
illustrate each of your answers.
a. Professors begin to require ink on all exams.
Demand for pencils will decrease. Equilibrium P and Q will fall.
Q
b. The price of lead increases.
Supply will decrease. Equilibrium price will rise, and quantity will fall.
c. School attendance falls.
Demand for pencils will decrease. Equilibrium P and Q will fall.

d. Legislation restricts lumber harvests.
Supply for pencils will fall. Equilibrium P will rise, Q will fall.
e. Pencil makers receive a large wage increase.
Supply for pencils will fall. Equilibrium P will rise, Q will fall.

f. The price of ballpoint pens falls.
Equilibrium price and quantity increase.
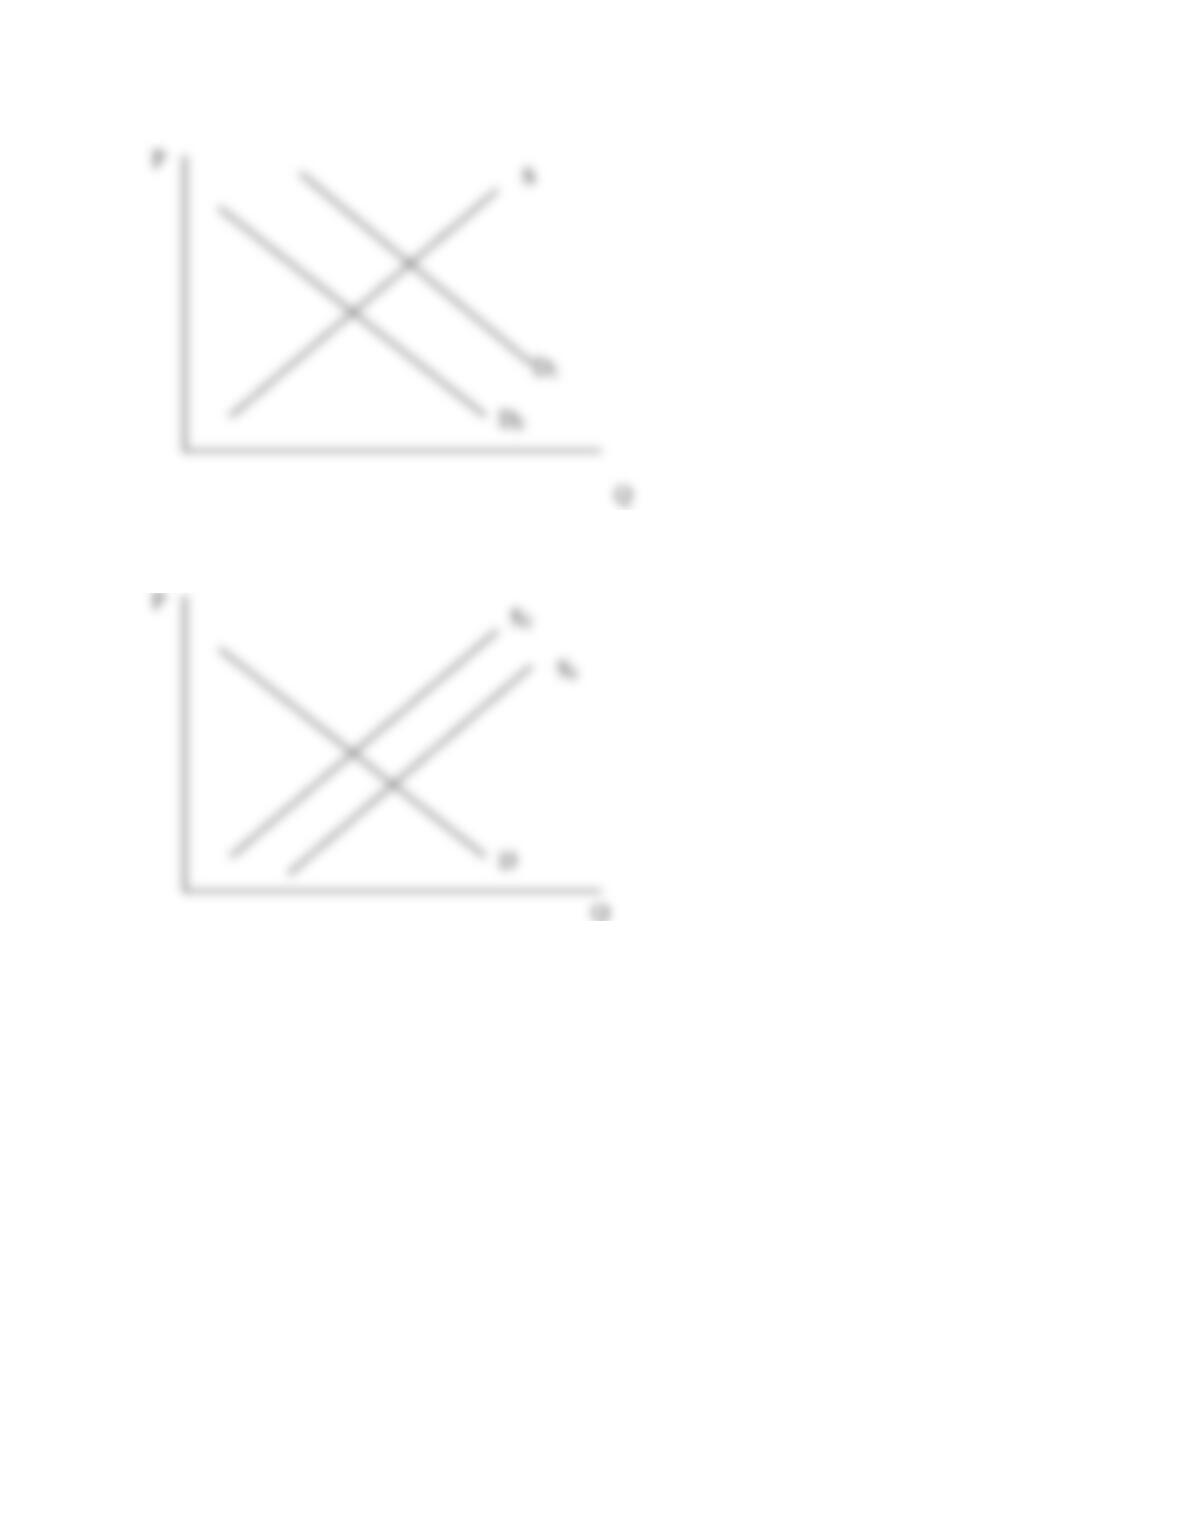
12. Suppose that the market for PC laptop computers is in equilibrium. Determine how the
following shocks will affect the equilibrium price and quantity. Draw a fully labeled
demand and supply curve diagram to illustrate each of your answers.
a. Computers become easier to use.
Demand for computers rises. Equilibrium P and Q rise.

b. The price of memory chips falls.
Supply of computers rises. Equilibrium P falls and Q rises.
c. Software prices fall.
Demand for computers rises. Equilibrium P and Q rise.
Q
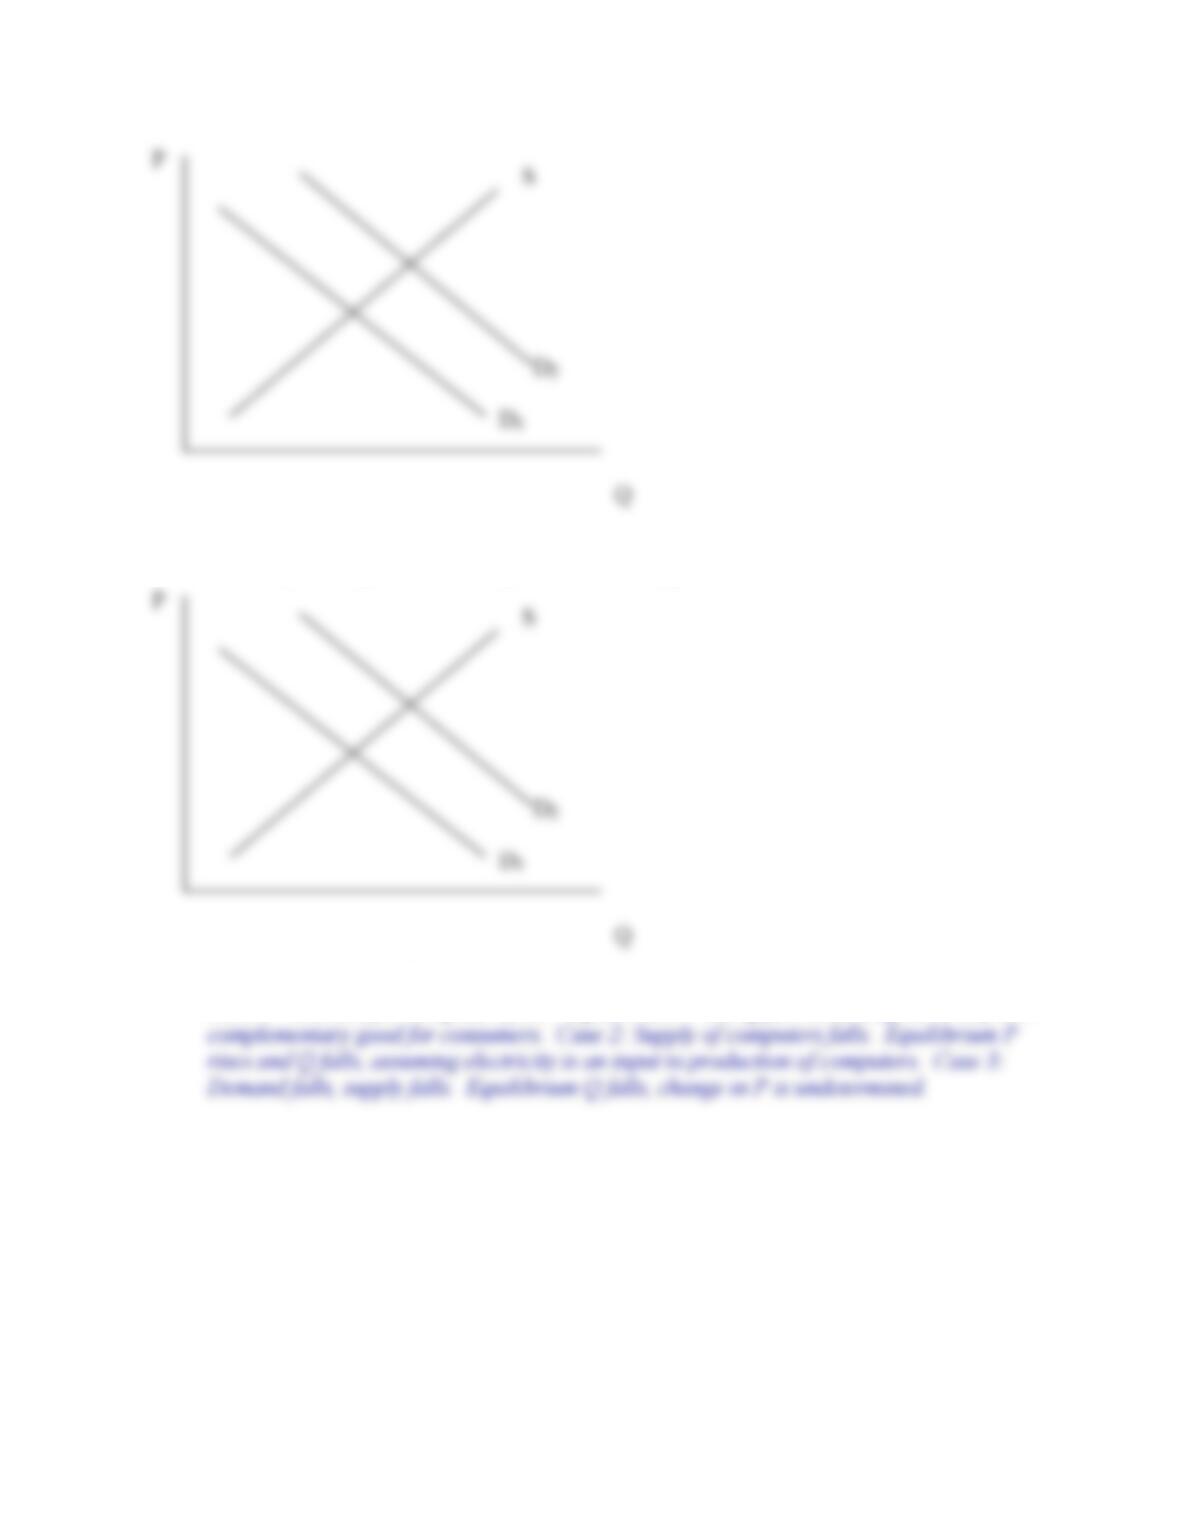
d. All college students are required to own personal computers.
Demand for computers rises. Equilibrium P and Q rise.
e. The price of electricity rises substantially.
Case 1: Demand for computers falls. Equilibrium P and Q fall, assuming electricity is a
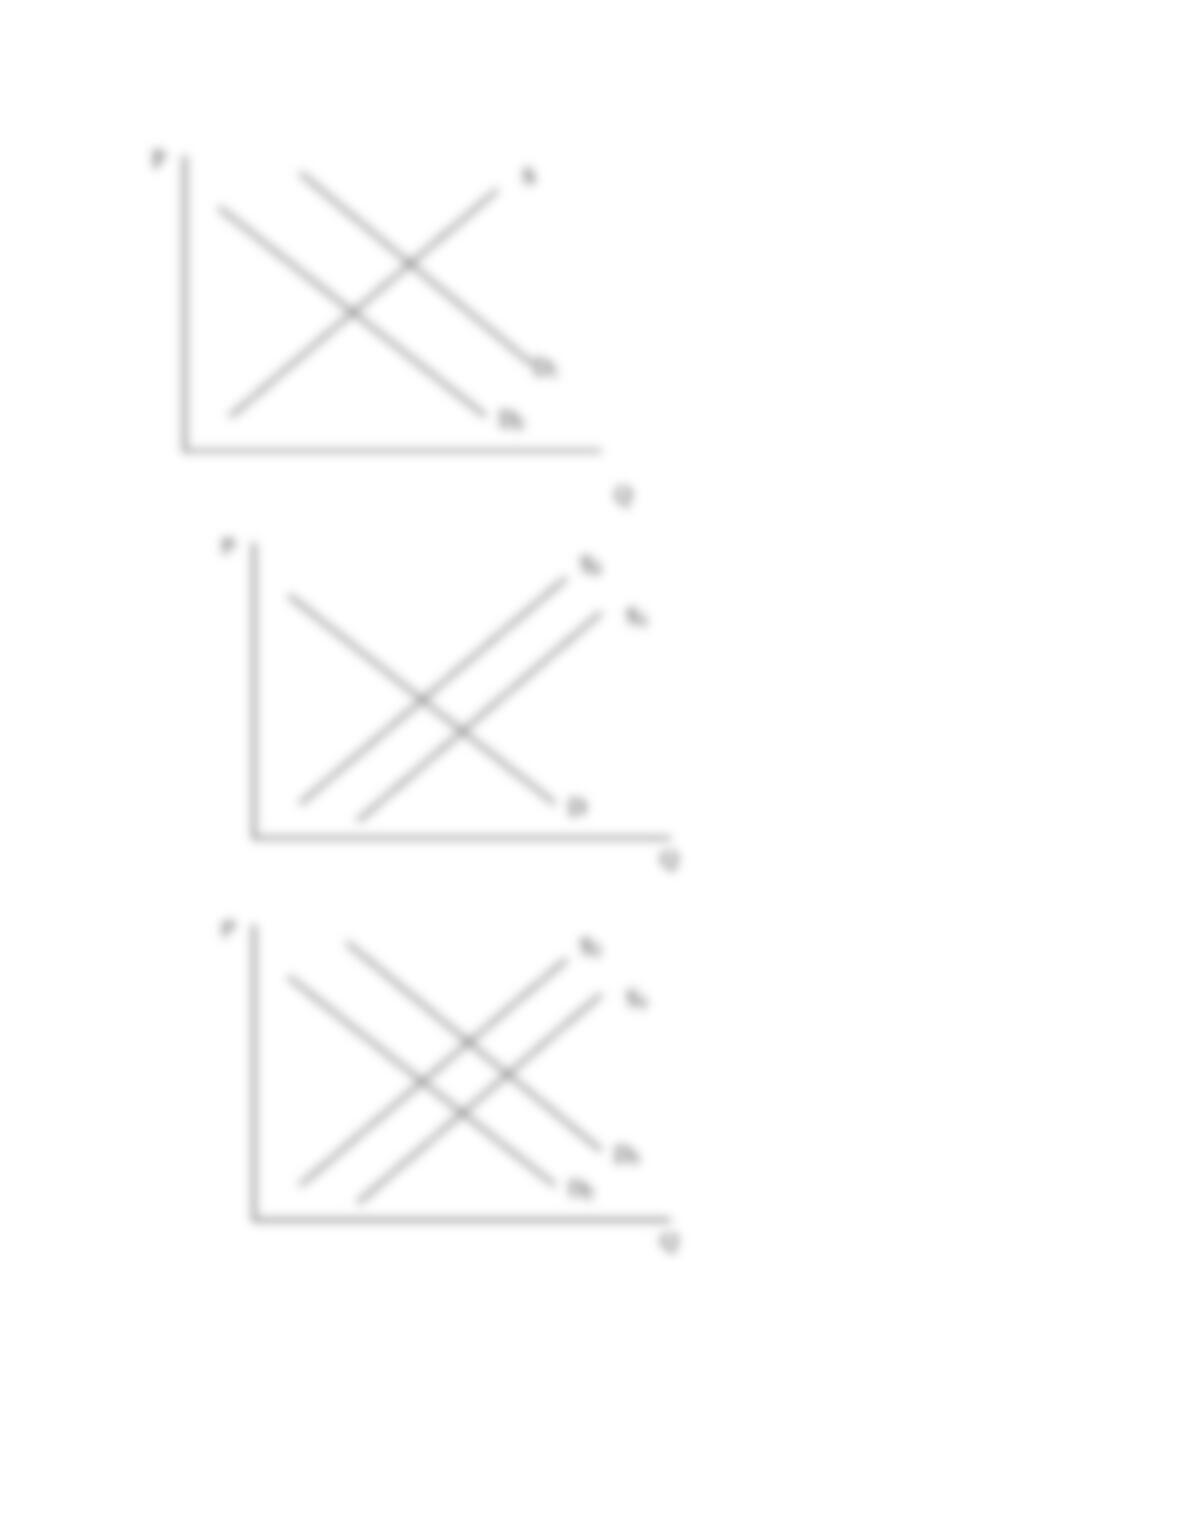
f. Doctors warn of health risks from radiation from video terminals.
Demand for computers falls. Equilibrium P and Q fall.
APPENDIX 27.2
Elasticity
LEARNING OBJECTIVES FOR APPENDIX 27.2
Understand price elasticities of demand and supply and how they are used
Show the relationship between price elasticity of demand and total revenue and how this
relationship is important to firms and policymakers.
OUTLINE OF APPENDIX
I. Elasticity: Basic Concepts and Computations
Price Elasticity of Demand
II. Ranges of Price Elasticity of Demand
Determinants of Price Elasticity of Demand
Special Cases
1. Vertical Demand Curves
Elasticity and Total Revenue
1. Other Kinds of Elasticity
III. Summary
KEY TERMS
complementary goods
goods that are typically consumed together and characterized by a positive cross-price elasticity
of demand
cross-price elasticity
a measure of the relative responsiveness of the demand for one good to the relative price change
of another good
quantity demanded that is much larger than the percentage change in the price
the data available cannot be identified as being on either a single demand or supply curve
change in income
income rises, the demand for inferior goods falls
luxury goods
goods with an income elasticity greater than one
necessity goods
normal goods with an income elasticity of demand of less than one
normal goods
goods whose consumption increases when income increases
perfectly elastic
situation in which the demand curve is perfectly horizontal and elasticity approaches infinity
perfectly inelastic
situation in which there is no change in the quantity demanded regardless of the change in price;
the demand curve is perfectly vertical
ANSWERS TO APPENDIX 27.2 REVIEW QUESTIONS
Understand price elasticities of demand and supply and how they are used
1. What does the measure of price elasticity try to capture? Why might this measure be
useful information?
Elasticity is a measure of responsiveness. Elasticity is useful for a firm to be able to
2. What are the main determinants of price elasticity of demand? What are the main
determinants of price elasticity of supply?
Price elasticity of demand is affected by the availability of substitutes and price of good
3. How is price elasticity of demand calculated? Why do we use absolute values for price
elasticity of demand?
Price elasticity of demand is equal to the percentage change in quantity demanded
4. How is price elasticity of supply calculated?
5. Explain why all downward-sloping linear demand curves have elastic, inelastic, and
unitary elastic regions.
A linear demand curve has a constant slope, but elasticity varies at every point along the
6. What is the difference between elasticity and slope?
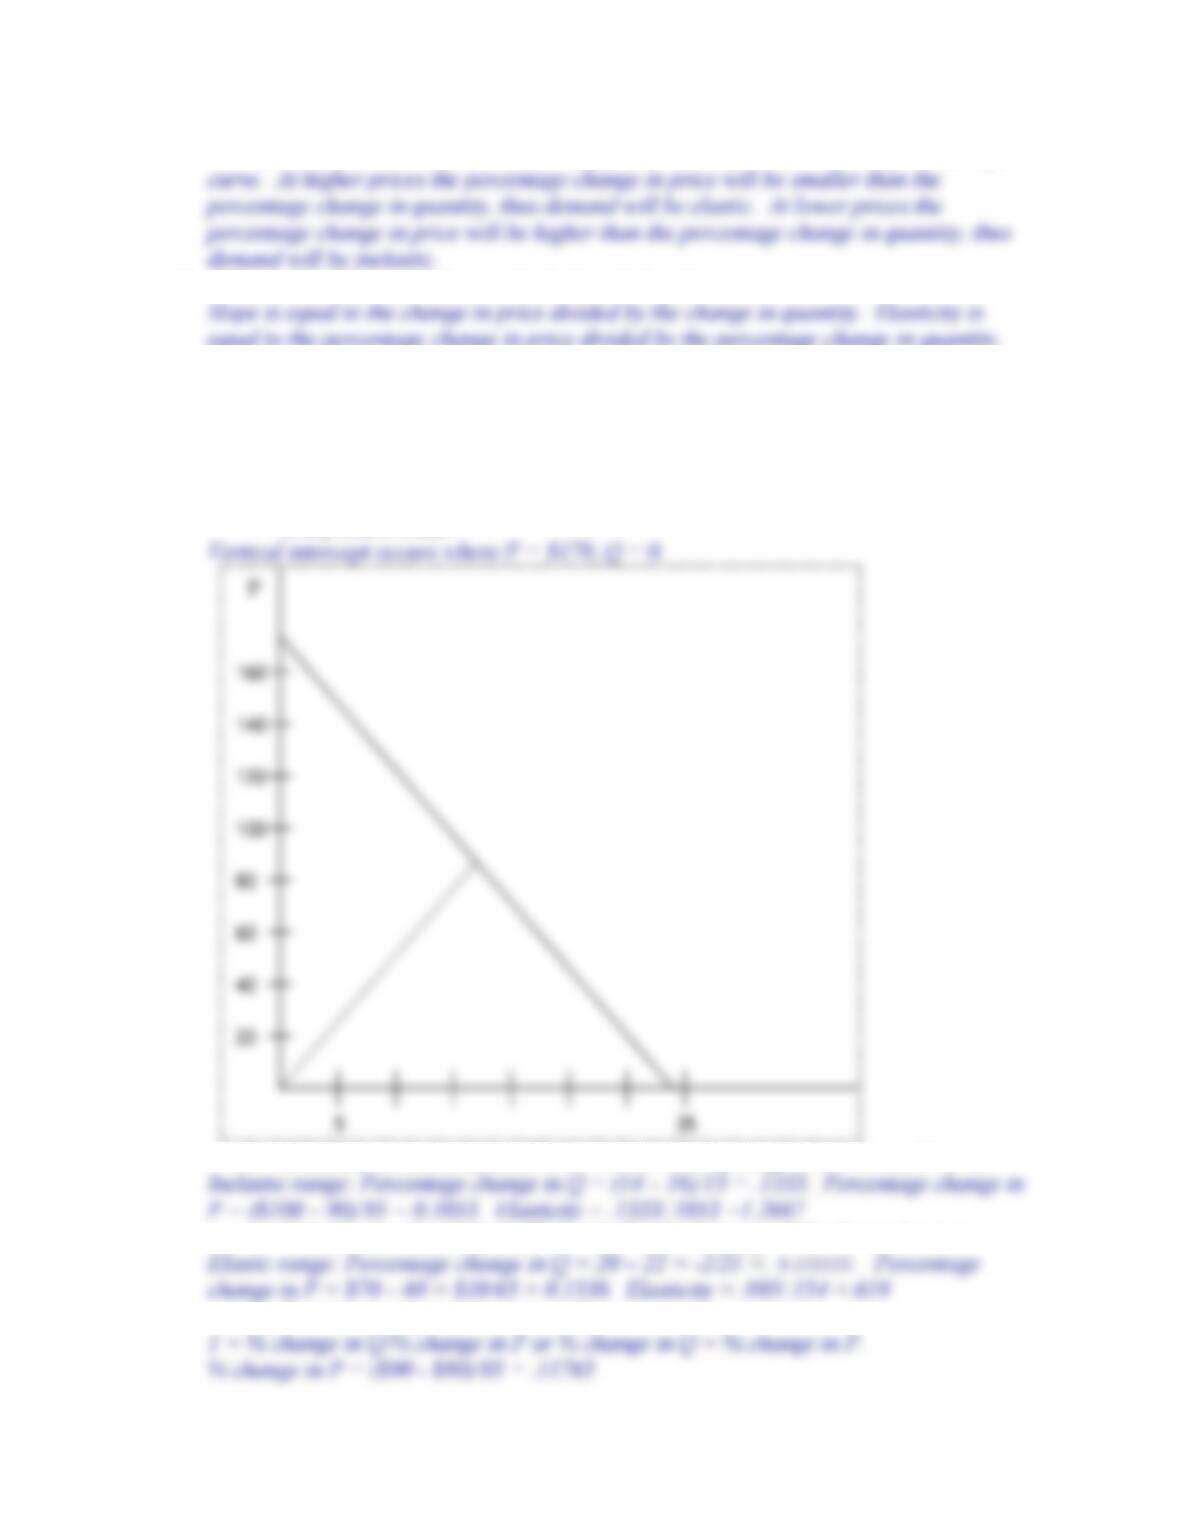
7. Suppose that the demand schedule is given as
Q
20
22
24
26
28
30
32
34
P
$70
60
50
40
30
20
10
0
a. Graph this data and find the vertical intercept. Assume the demand curve is
everywhere linear.
b. Calculate an elasticity coefficient in the inelastic range of the demand curve.
c. Calculate an elasticity coefficient in the elastic range of the demand curve.
d. Find the point of unitary elasticity.
%change in Q = (16 18)/17 = .11765
e. Find the point of maximum total revenue. What is the maximum total revenue at
that point?
8. Suppose that a supply curve is given as:
Q
30
28
26
24
22
20
P
$60
50
40
30
20
10
a. Graph this data.
b. Calculate an elasticity of supply coefficient.
Show the relationship between price elasticity of demand and total revenue and how this
relationship is important to firms and policymakers.
9. How are total revenue and price elasticity of demand related?
When demand is elastic, an increase in price will produce a more than proportional
10. Would a firm planning a price increase be better off if the demand for its product was
elastic or inelastic? Explain.
11. As manager of the Eagle Crest Ski Resort and Lodge, you announce an increase in the
price of lift tickets from $35 to $50. The number of skiers falls, but your total revenue
increases.
a. What does this say about the elasticity of demand for lift tickets? Should you
b. Your friend, an avid skier and economics major but in no way affiliated with
the ski lodge says she is actually happy that you raised the ticket prices. How
could she think such a thing?
12. Use price elasticity to explain the following observations:
a. The price of gasoline is higher near the freeway than at a gas station two miles
b. Airline tickets are less expensive if purchased a month before you plan to fly than
if purchased one day before you plan to fly.
c. Prices in grocery stores in low-income areas of town might actually be higher
than in a more affluent area of town.
Calculate and explain the use of income elasticity.
13. What is income elasticity? What is it used to measure?
Income elasticity measures the responsiveness of a change in demand to a change in
14. Use income elasticity to explain the differences between normal, inferior, luxury, and
necessity goods.
Normal goods have a positive income elasticity, inferior goods have a negative income
15. Look at each of the following pairs and discuss which component has a higher price and
income elasticity. Briefly explain your answer.
a. movies/taxi cabs
Movies are like to have a higher price elasticity of demand and income elasticity,
b. tobacco/gasoline
c. electricity/water
Both are necessity goods; however, water is more necessary for life in most cases. On
d. mobile phone service/clothing
A reasonable argument could be made that both are relatively elastic. In general, mobile
e. intercity busses
Define cross-price elasticity and show how it is used to define necessity and luxury goods.
16. What is a complement and what is a substitute good? Give examples of goods that are
complements and goods that are substitutes.
Complements are goods that are consumed together. Examples of complements are
17. What is cross-price elasticity? What is the formula for calculating cross-price elasticity?
18. Using cross-price elasticity, how is it determined whether a good is a complement or
substitute?
Explain the limitations of elasticity (demand, supply, income, and cross-price).
19. What are some problems with measuring the various types of elasticities?
20.
The identification problem occurs when the data available cannot be identified as being