CHAPTER 26
Scarcity and Choice
Neoclassical View
LEARNING OBJECTIVES
Explain the concept of scarcity and how people make choices according to neoclassical
analysis.
Describe how the production possibilities curve captures production choices in a society.
OUTLINE OF CHAPTER
I. Neoclassical View of Scarcity and Choice
Choice, Scarcity and the Production Possibilities Curve
KEY TERMS
choice
which goods he or she wants to consu
me
institutions
sets of customs, laws, and norms that influence, enable, or constrain human behavior
and time
individuals
ANSWERS TO END OF CHAPTER REVIEW QUESTIONS

Explain the concept of scarcity and how people make choices according to neoclassical
analysis.
1. List the underlying assumptions that neoclassical economist make about people.
(1) Human beings make rational choices by weighing the costs and benefits of a decision.
2. Explain the foundation of neoclassical analysis. What are two key assumptions made
about people and how they make decisions?
The foundation of neoclassical analysis is the isolated individual.
3. What creates scarcity, according to neoclassical analysis? Explain the difference between
what people need and what people want and desire and how this difference creates scarcity.
Scarcity is created by the fact that there is never enough production to satisfy the wants
Describe how the production possibilities curve captures production choices in a society.
4. Explain what the production possibilities curve (PPC) demonstrates. What assumptions
are made when creating a PPC?
5. What does it mean if a society is producing on the frontier or directly on the PPC?
6. If a society is producing on the frontier, what happens if society decides it wants more of
one of the goods being produced?
In order to produce more of one good, society must produce less of the other good.
7. Is it always impossible to produce more of one good without giving up some of the other
good? Why or why not?
Society could produce more of one good without giving up some of the other good if there
Describe what progressive economists see as the primary shortcomings of the neoclassical
scarcity perspective.
8. What is the progressive criticism of the analysis of the economy, starting with isolated
individuals? What is the critique of the assumptions about individuals and how
individuals make decisions? What is the progressive alternative?
The assumption of isolated individuals does not describe life in a highly complex society
9. Why is the context in which individuals make decisions important? How do social and
cultural norms play into how individuals make decisions? Give an example of how a
social norm may influence an economic decision.
Few decisions are made in isolation. People often make decisions based on reasons
10. What is the progressive criticism of the neoclassical notion of scarcity? Give a specific
example. What is the progressive alternative?
Under capitalist economic institutions in peacetime, there is no problem of scarcity. The
11. A progressive economist would claim we should not assume a market economy is always
producing on the PPC. Explain. What does this mean about the decision to produce
additional amounts of one good? Both goods?
Capitalist economies often produce at less than full employment of all resources, i.e. the
12. Progressive economists claim the types of choices different people make are very
different from the simple choices presented in the overview of neoclassical choice.
Explain.
Progressive economists reject the neoclassical focus on scarcity and isolated individuals,
APPENDIX 26.1
More on the Production Possibility Curve
LEARNING OBJECTIVES FOR APPENDIX 26.1
List the assumptions behind the PPC
Use the PPC to illustrate scarcity, choice, constant opportunity costs, and the law of
OUTLINE OF APPENDIX
I. The Simplest, Linear PPC for Individuals
II. Linear Opportunity Costs
KEY TERMS
attainable region
production points on the frontier or inside the frontier of the PPC.
comparative Advantage
producing a good or service at the lowest opportunity cost
constant marginal opportunity costs
eventually rise.
the value of what is given up when a choice is made to do something else
production possibilities curve (PPC)
a curve showing the production combinations available to an economy given finite inputs and
techn
ology
resources/inputs
the assets needed in production and development of an economy, including land, labor, capital,
and time
technology
the existing level of knowledge, techniques, and types of tools available for the production of
goods and services
to get one additional thing, something else must be given up

ANSWERS TO APPENDIX 26.1 REVIEW QUESTIONS
List the assumptions behind the PPC
1. What do we assume about inputs, institutions, and technology in building the PPC?
2. What does the PPC represent?
The PPC shows the production combinations available to an economy given finite inputs
and technology.
3. What is an opportunity cost? Give an example of an opportunity cost involved in a
decision you made today.
4. What does marginal cost mean? Create an example of a marginal cost.
The additional cost of producing an additional item.
5.
Use the PPC to illustrate scarcity, choice, constant opportunity costs, and the law of
increasing marginal opportunity cost.
6. Draw a PPC diagram and illustrate the attainable region and unattainable region. Label a
combination of goods representing efficient production.
7. Why are typical textbook PPCs bowed outward?
8. What does it mean when PPCs are illustrated with a straight line?
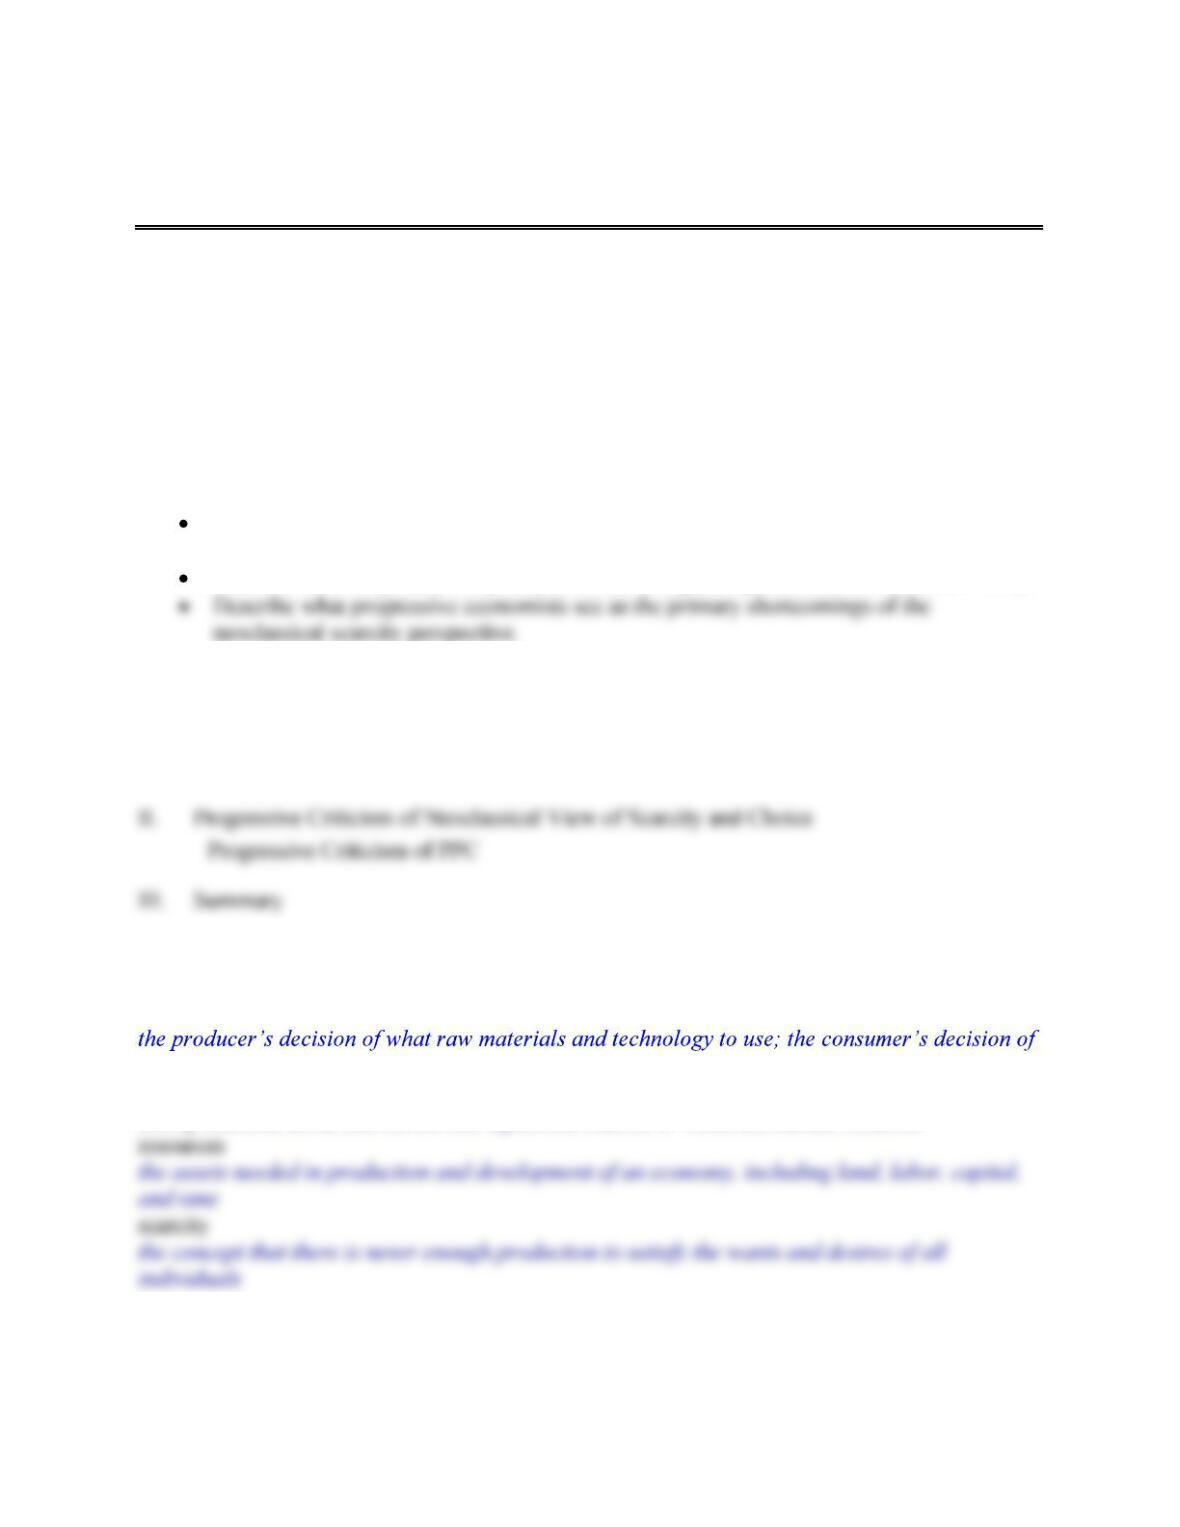
9. Draw a linear PPC. Label two points on this diagram and explain how these points are
consistent with the idea of constant marginal opportunity costs.
The slope between Point 1 and Point 2 demonstrates the amount of Good B given up for
Unattainable
region
Attainable
region
Good A
Good B
Efficient combination of
Good A and Good B
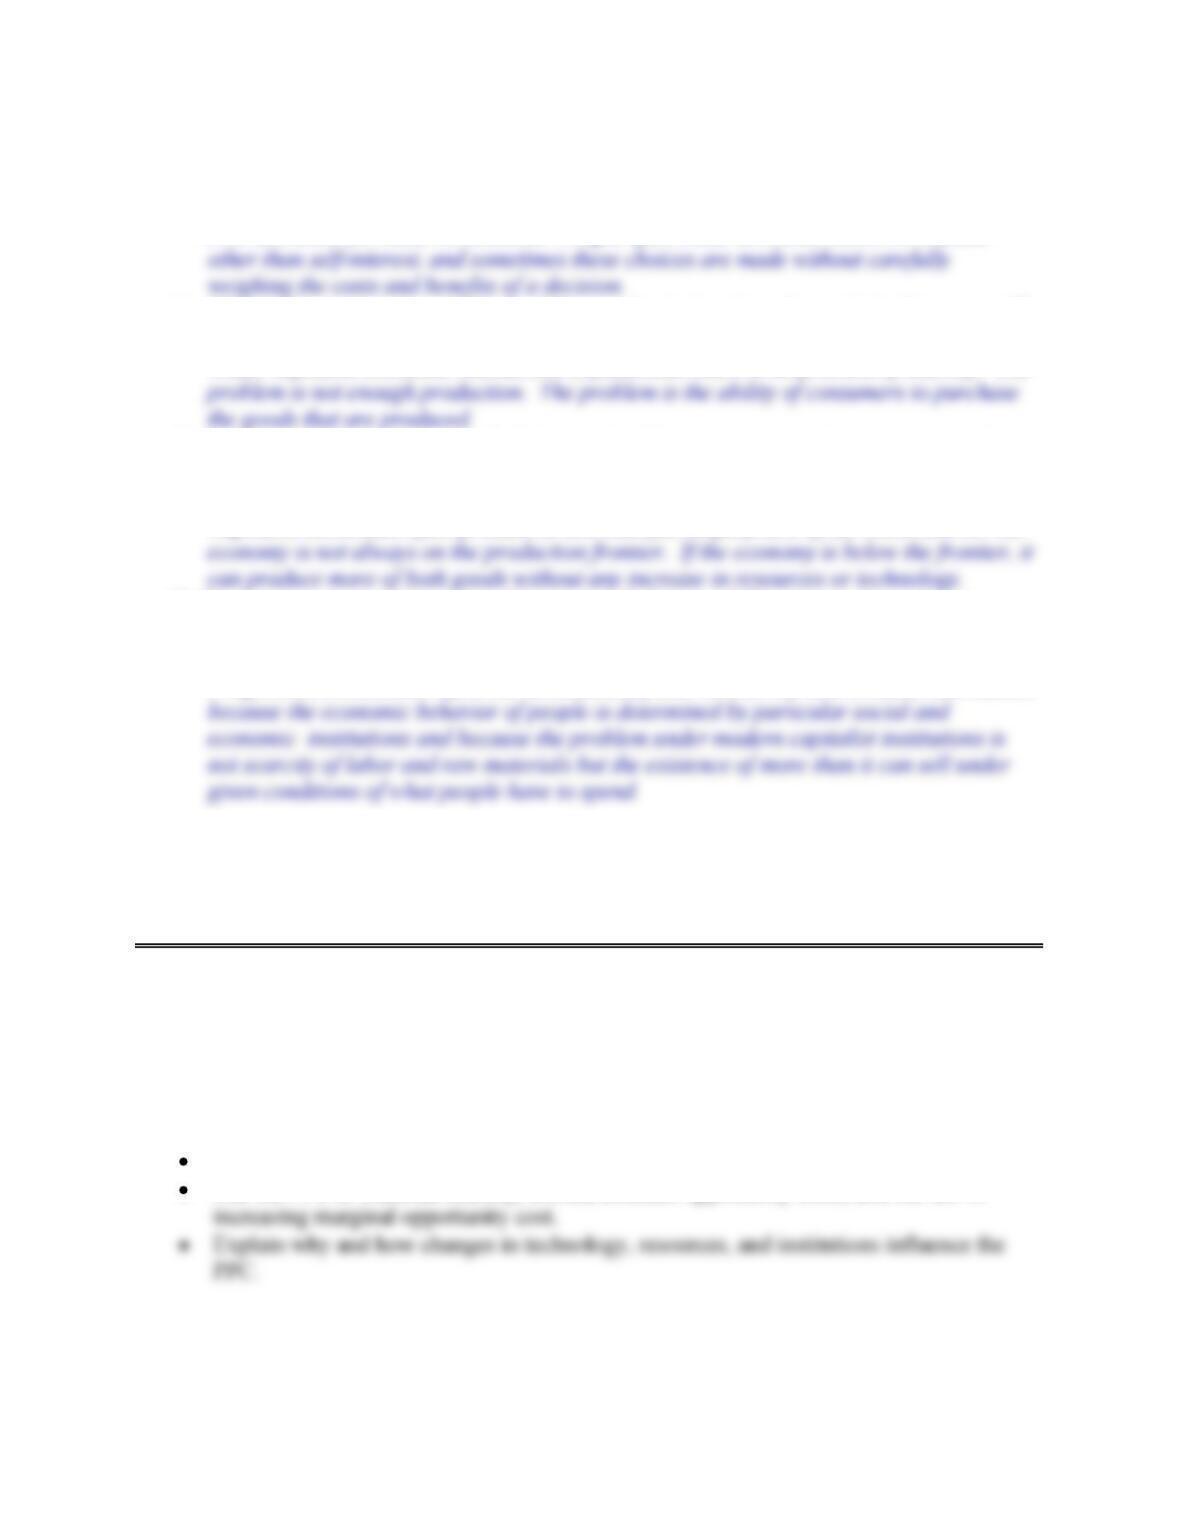
10. Draw a concave PPC. Label two points on this diagram and how these points are
consistent with the law of increasing opportunity costs.
The amount of Good B that must be given up for each additional unit of Good A
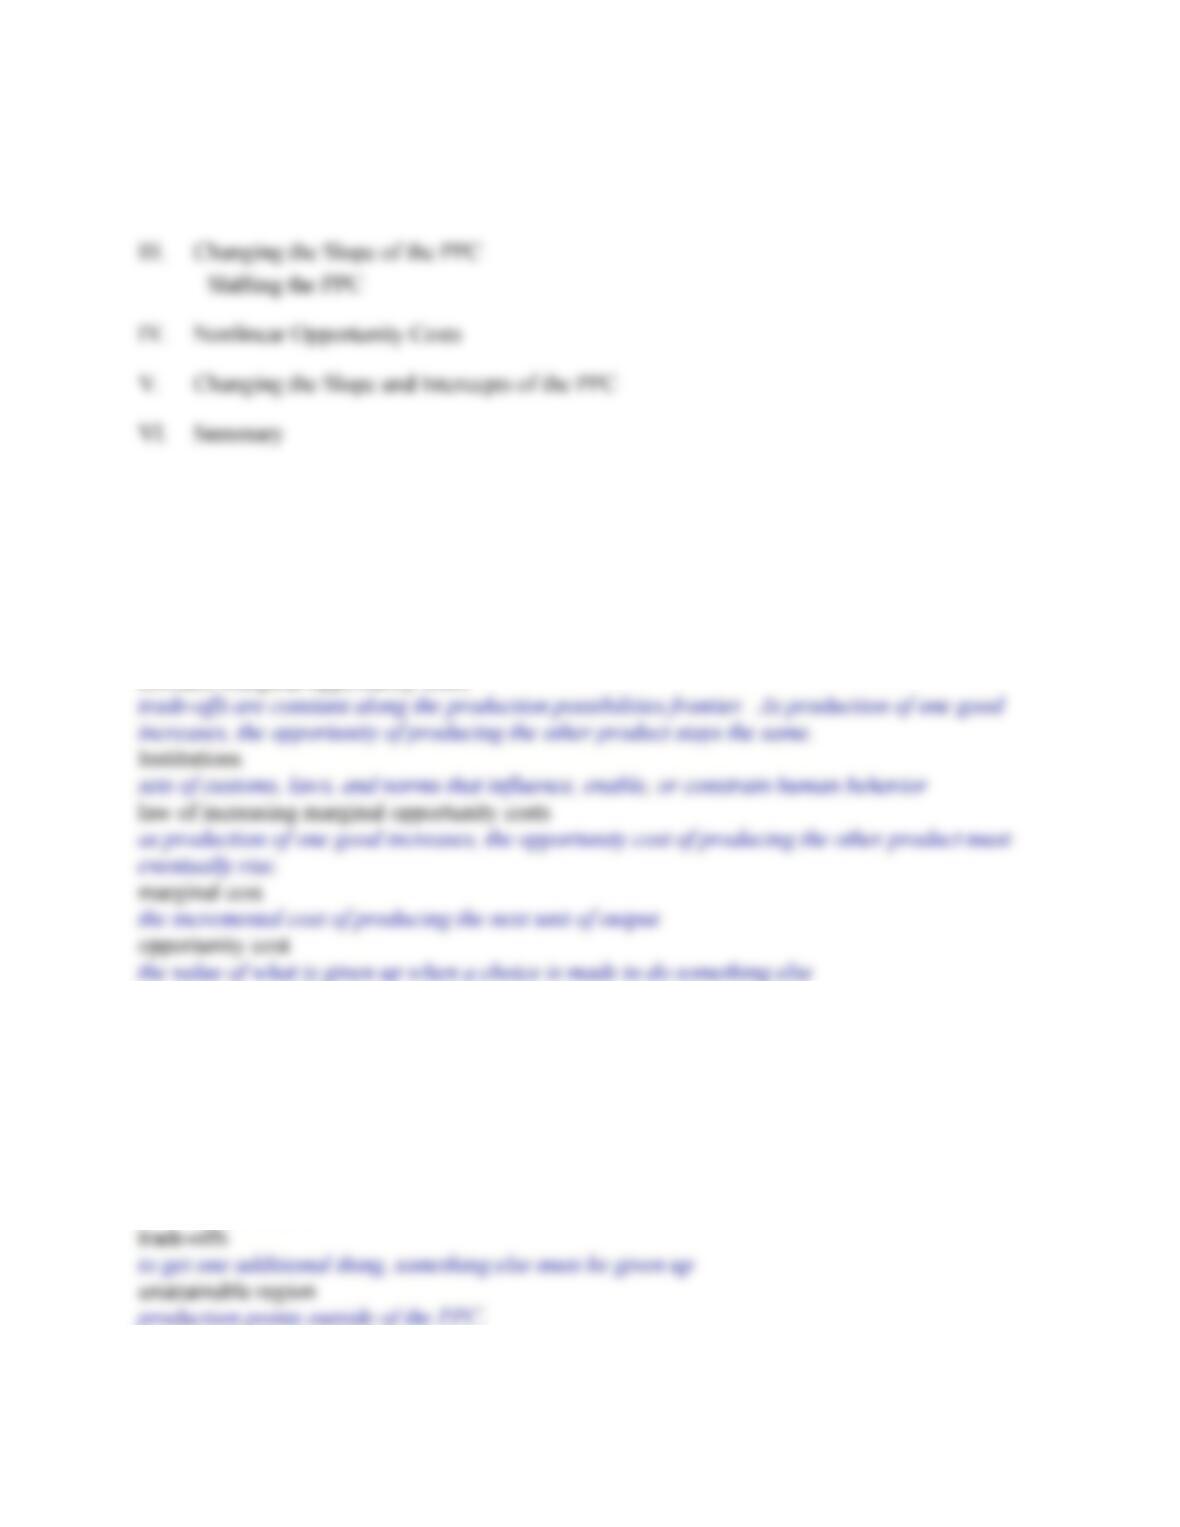
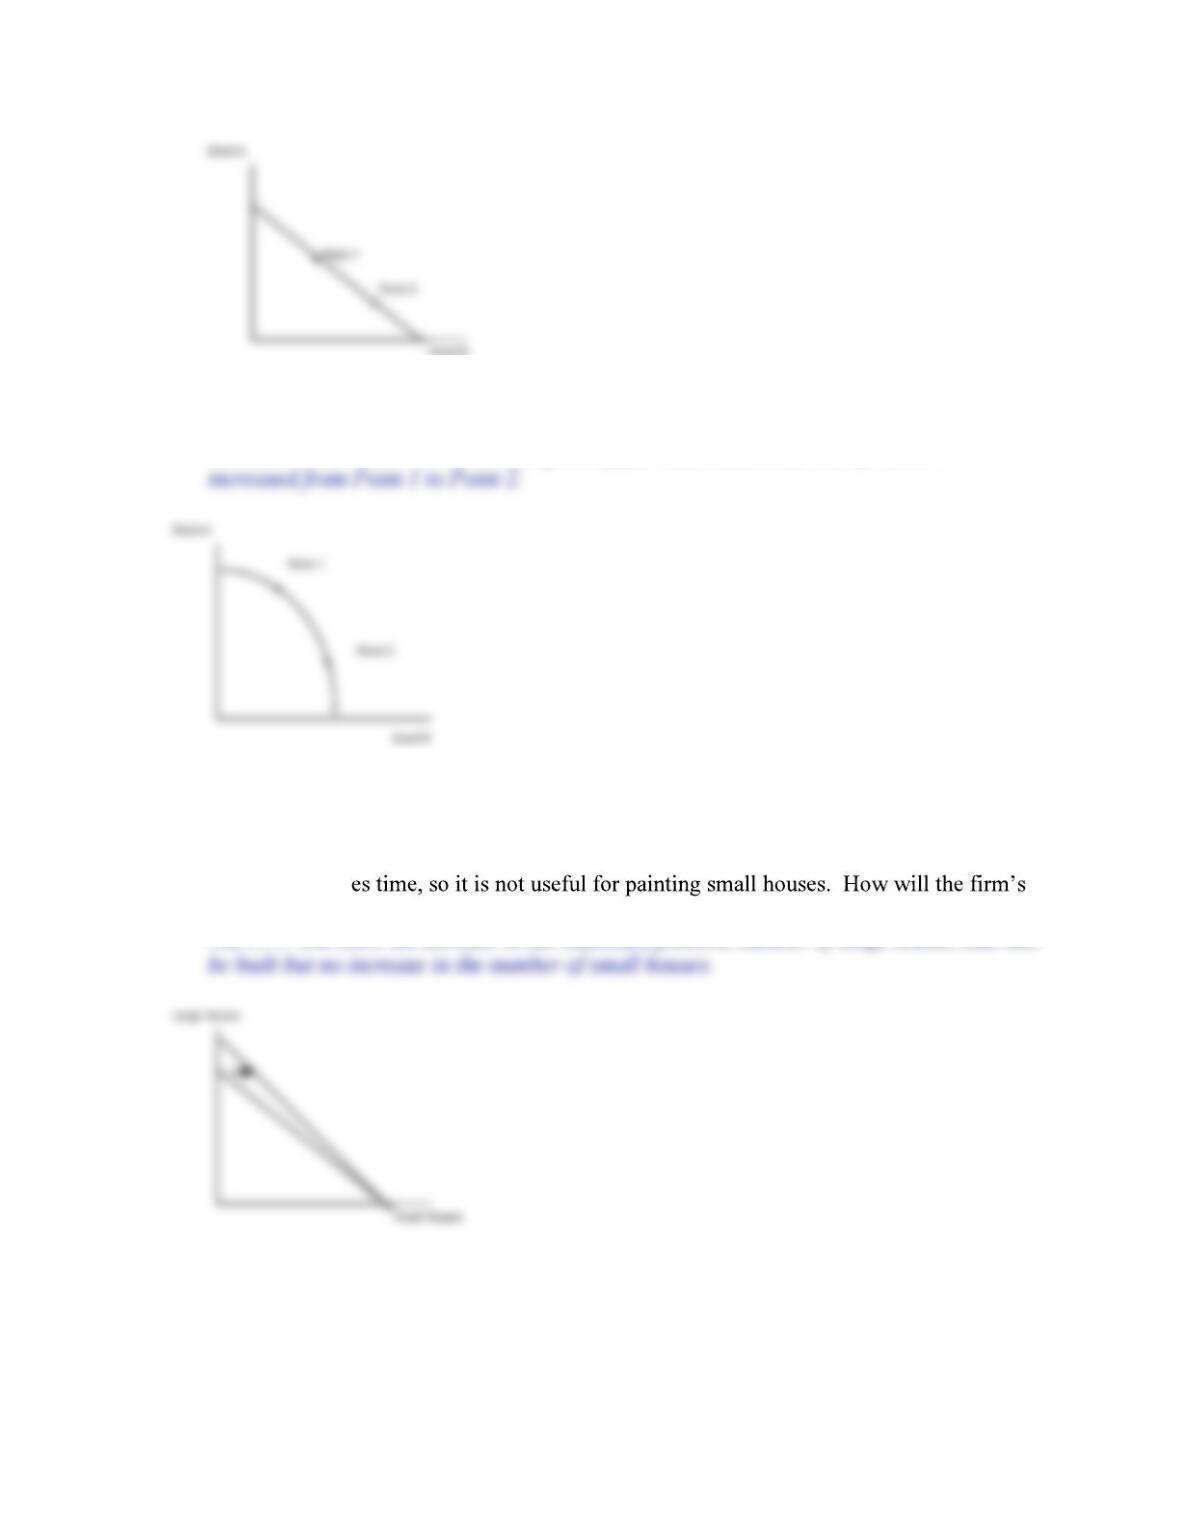
11. Draw a linear PPC like that illustrating the work of Student Painters. On the vertical axis,
label large houses, and on the horizontal axis, put small houses. Assume that the
company begins using a special kind of scaffolding for painting big houses. However,
setting it up tak
PPC be affected by this new resource?
The PPC will show an increase in the maximum possible number of large houses that can
12. In the 1980s, rates of growth in Japan were higher than in the United States. One
argument given for the stronger growth in Japan was higher level s of investment. Draw
a PPC for both the United States and Japan. On the axes, label the goods as investment
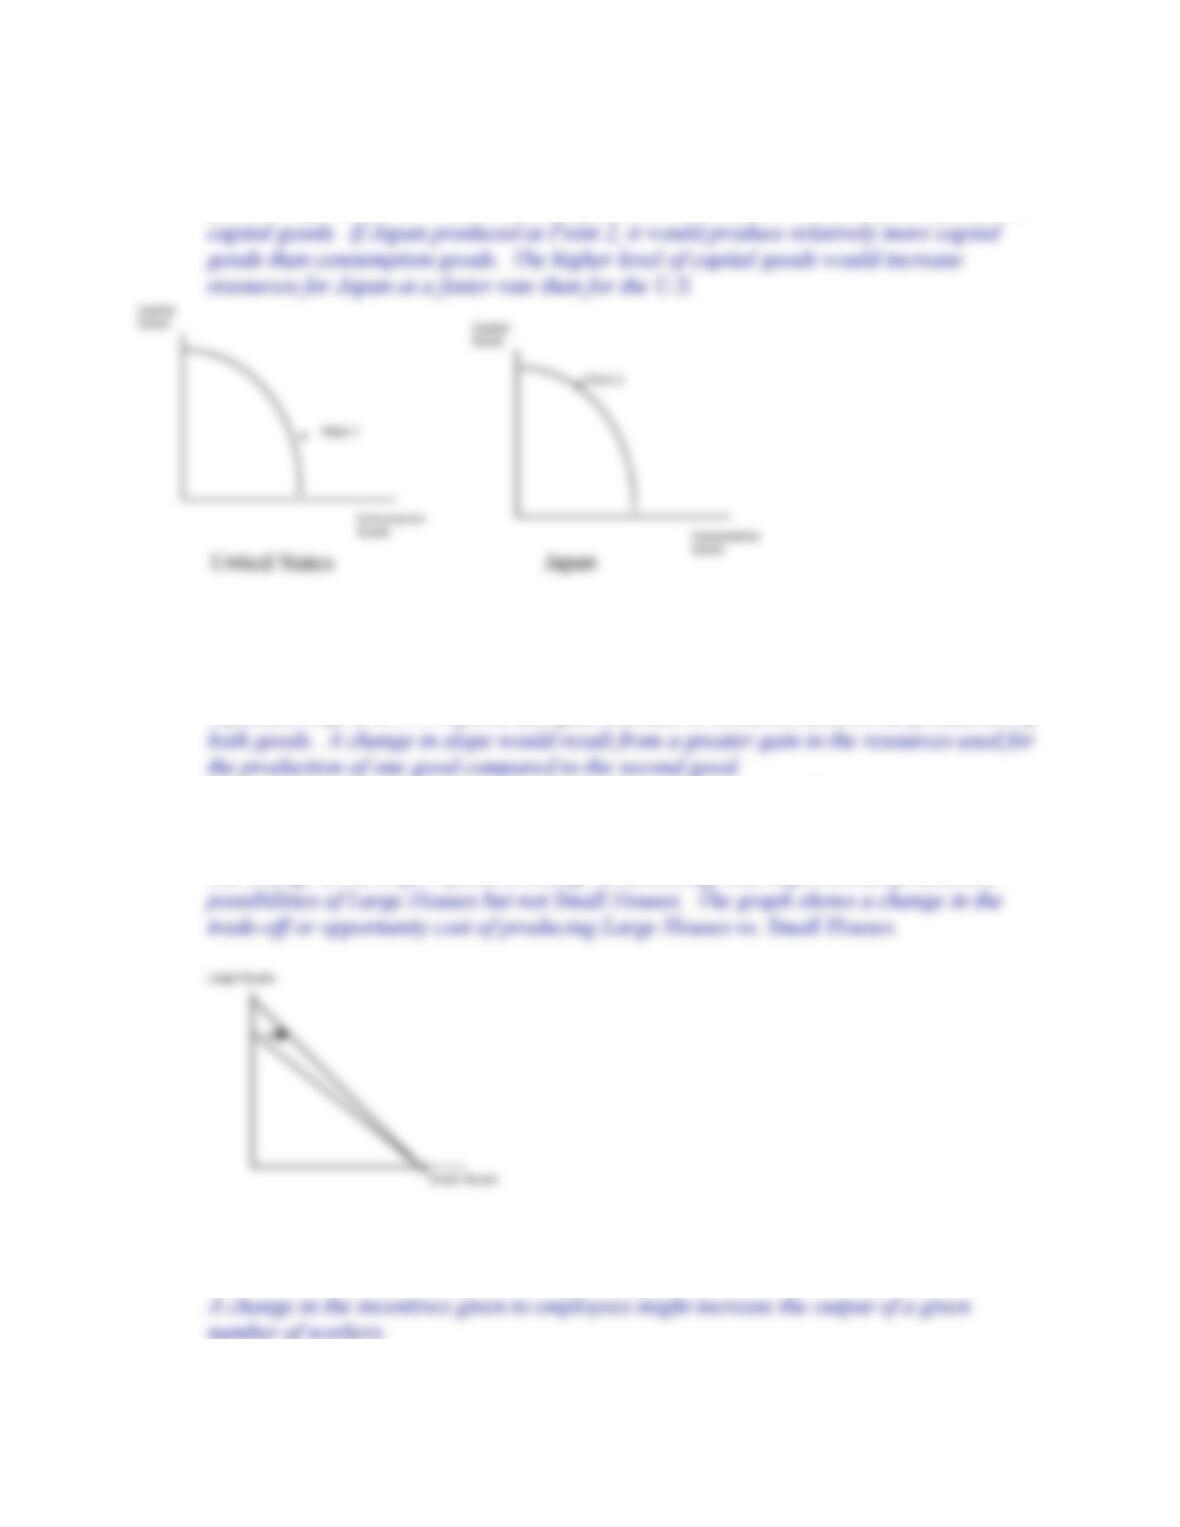
goods and consumption goods. Use these two diagrams to explain why Japan
experienced faster growth than did the United States.
If the U.S. produced at Point 1, it would produce relatively more consumption goods and
Explain why and how changes in technology, resources, and institutions influence the PPC.
13. What would cause a parallel shift in a PPC? What would cause a change in its slope?
A parallel shift in a PPC reflects an equal increase in resources used in the production of
14. Give an example of how a change in technology might have an effect on the production
of one good and not the other, and illustrate this situation with a PPC. What changed in
the graph?
The change in the slope reflects a change in technology that improves the production
15. What kind of institutional changes could cause an increase in production even though no
other inputs increased and no technology changed?
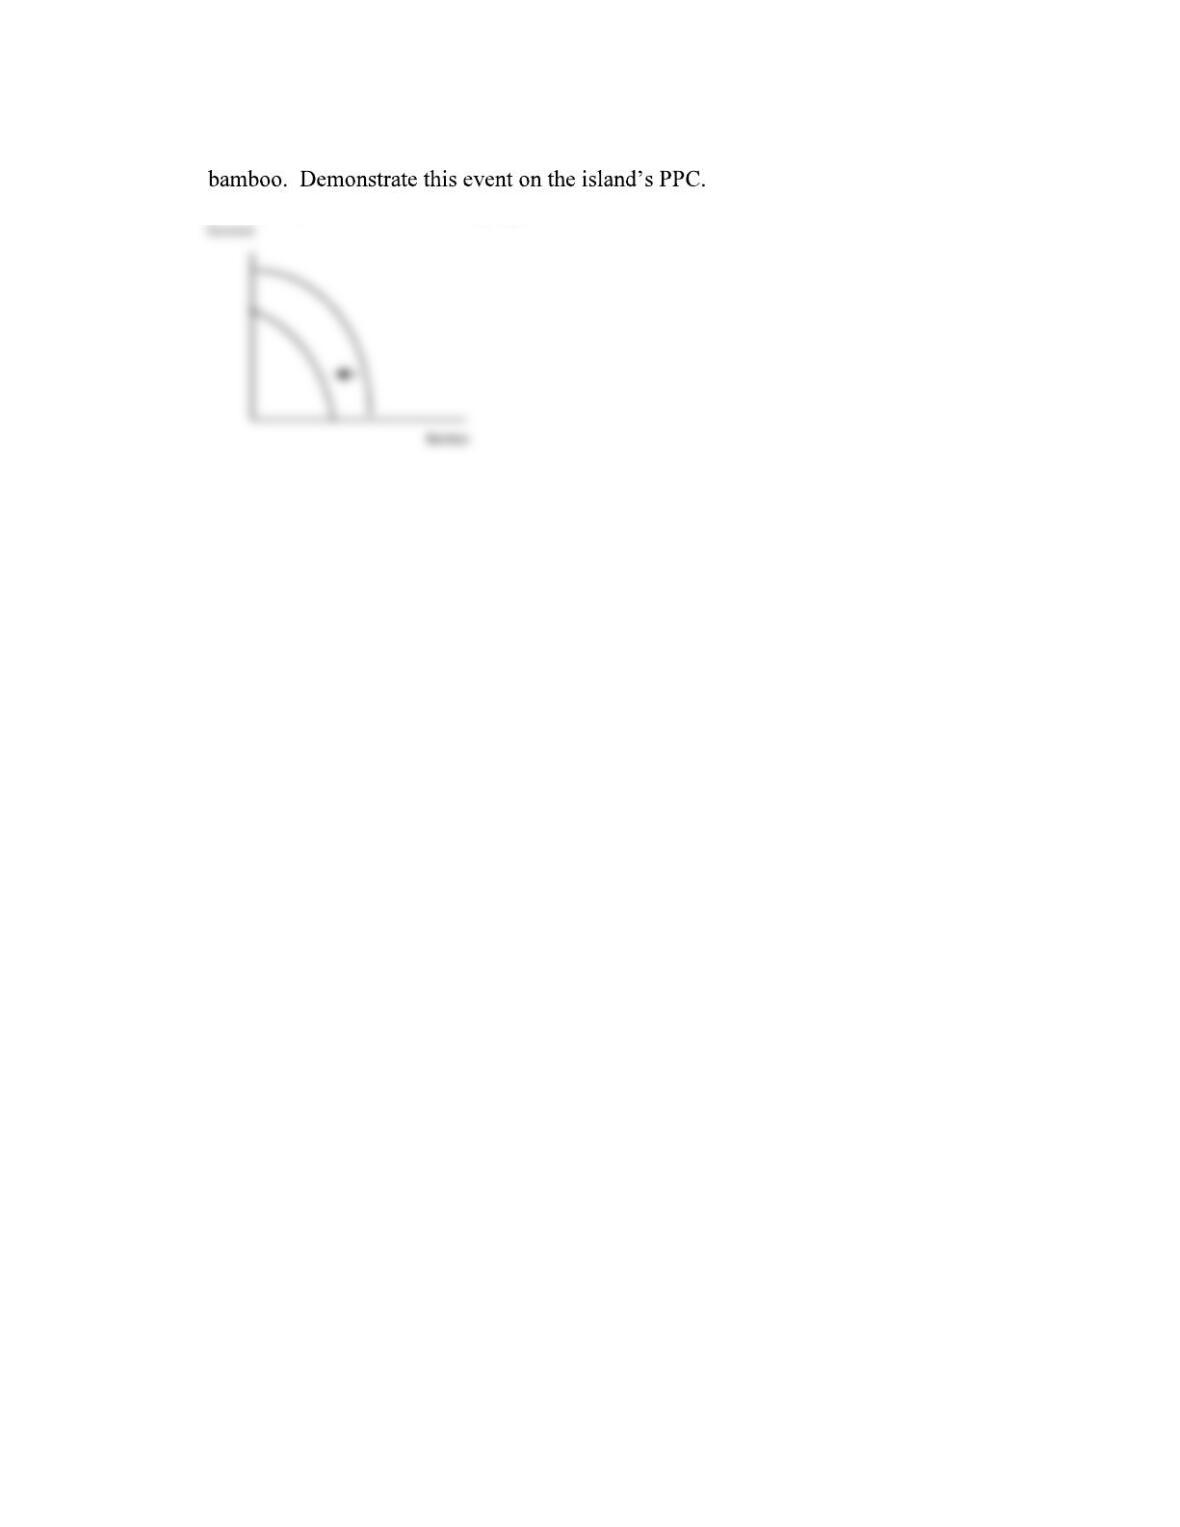
16. Assume a hurricane devastated an island economy that produced only coconuts and
There would be an inward shift of the PPC.