Solution 12/8/2012
Chapter: 25
Problem: 7
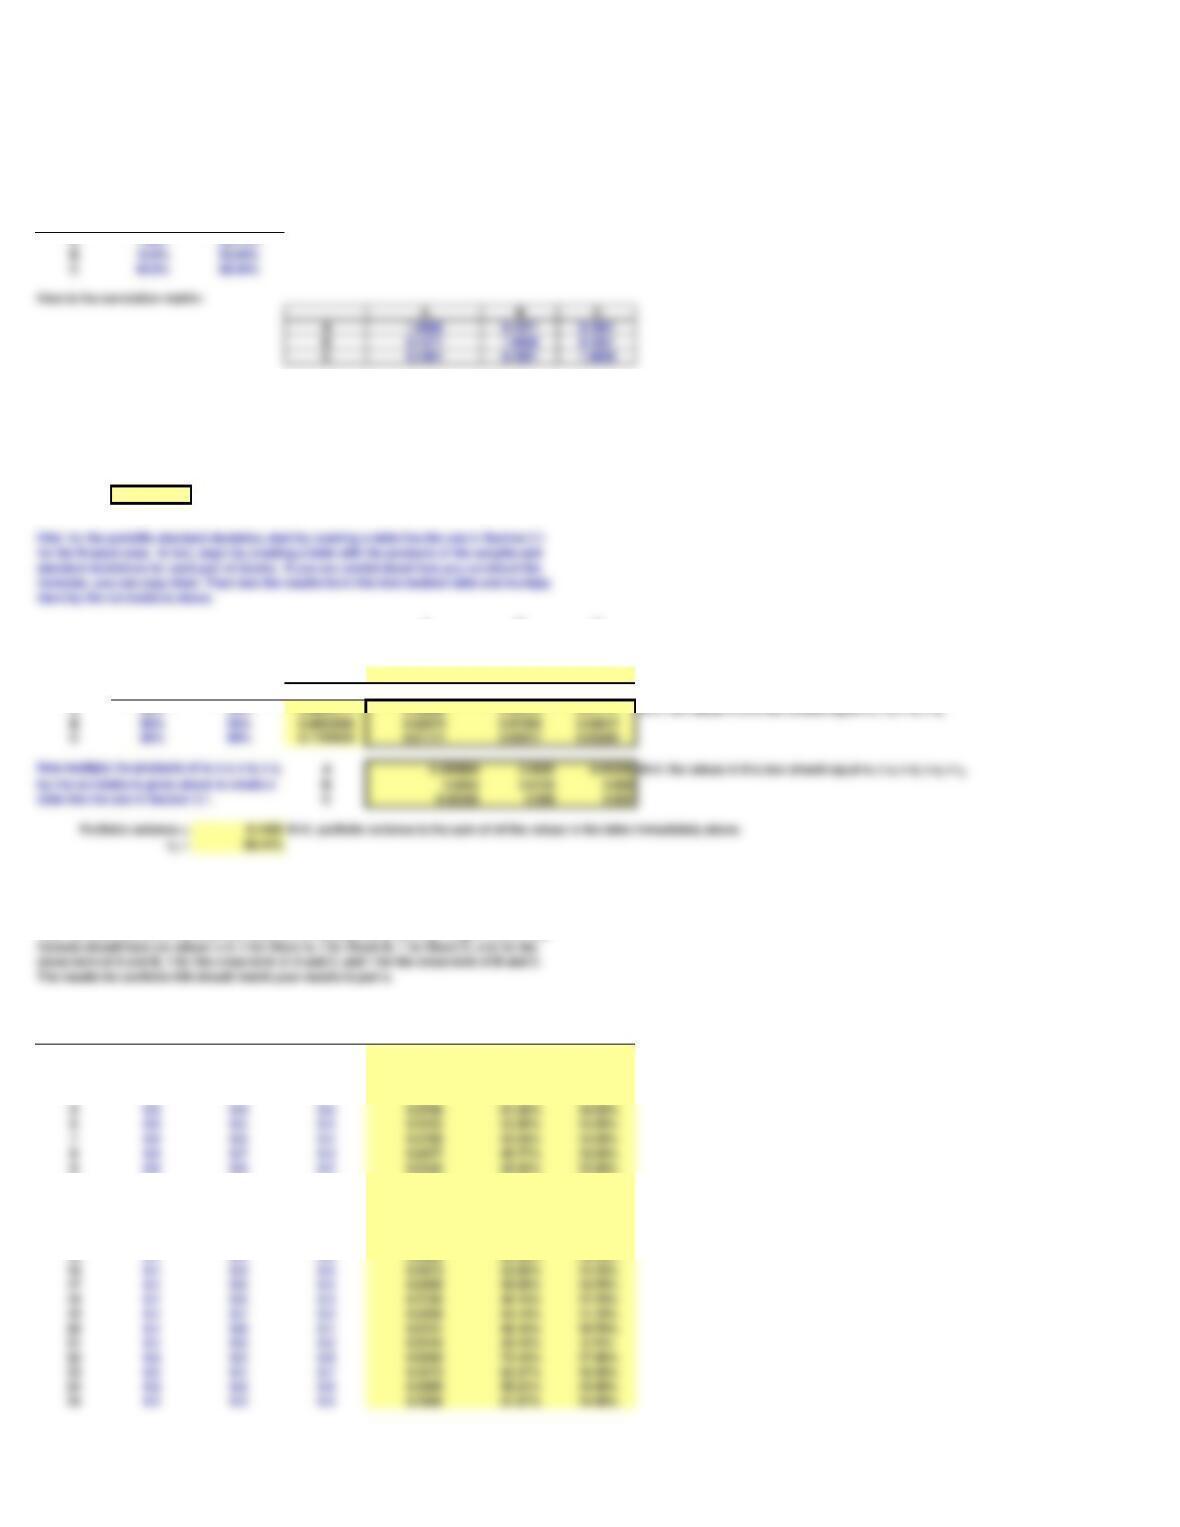
Here are the expected returns and standard deviations for stocks A, B, and C:
Stock
risi
wA = 30%
wB = 50%
wC = 20%
rp = 11.10%
A B C
wi = 30% 50% 20%
si = 33.11% 53.85% 89.44%
wi x si = 0.0993177 0.2692582 0.1788854 Hint: put the products of weights and standard deviations for each stock in this row.
wisiwi x si
A30% 33% 0.0993177 0.00986 0.02674 0.01777
Hint: the values in this box should equal wi x si x wj x sj.
Portoflio #
wA wB wC Variance sp rp
10.0 0.0 1.0 0.8000 89.44% 20.00%
20.0 0.1 0.9 0.6653 81.57% 19.00%
30.0 0.2 0.8 0.5492 74.11% 18.00%
40.0 0.3 0.7 0.4517 67.21% 17.00%
50.0 0.4 0.6 0.3728 61.06% 16.00%
60.0 0.5 0.5 0.3125 55.90% 15.00%
70.0 0.6 0.4 0.2708 52.04% 14.00%
80.0 0.7 0.3 0.2477 49.77% 13.00%
90.0 0.8 0.2 0.2432 49.32% 12.00%
10 0.0 0.9 0.1 0.2573 50.72% 11.00%
11 0.0 1.0 0.0 0.2900 53.85% 10.00%
12 0.1 0.0 0.9 0.6592 81.19% 18.70%
13 0.1 0.1 0.8 0.5383 73.37% 17.70%
14 0.1 0.2 0.7 0.4361 66.03% 16.70%
15 0.1 0.3 0.6 0.3524 59.36% 15.70%
16 0.1 0.4 0.5 0.2873 53.60% 14.70%
17 0.1 0.5 0.4 0.2409 49.08% 13.70%
18 0.1 0.6 0.3 0.2130 46.15% 12.70%
19 0.1 0.7 0.2 0.2038 45.14% 11.70%
21 0.1 0.9 0.0 0.2410 49.10% 9.70%
22 0.2 0.0 0.8 0.5343 73.10% 17.40%
23 0.2 0.1 0.7 0.4273 65.37% 16.40%
24 0.2 0.2 0.6 0.3389 58.21% 15.40%
25 0.2 0.3 0.5 0.2690 51.87% 14.40%
Following is information for the required returns and standard deviations of returns for A, B,
a. Suppose a portfolio has 30 percent invested in A, 50 percent in B, and 20 percent in C.
What are the expected return and standard deviation of the portfolio?
formulas, you can copy them. Then take the results from this intermediate table and multiply
them by the correlations above.
b. The partial model lists 66 different combinations of portfolio weights. For each
combination of weights, find the required return and standard deviation.
Hint: Use the formula to calculate the variance for each portfolio and then copy it down. This
Here is the correlation matrix:
A B C
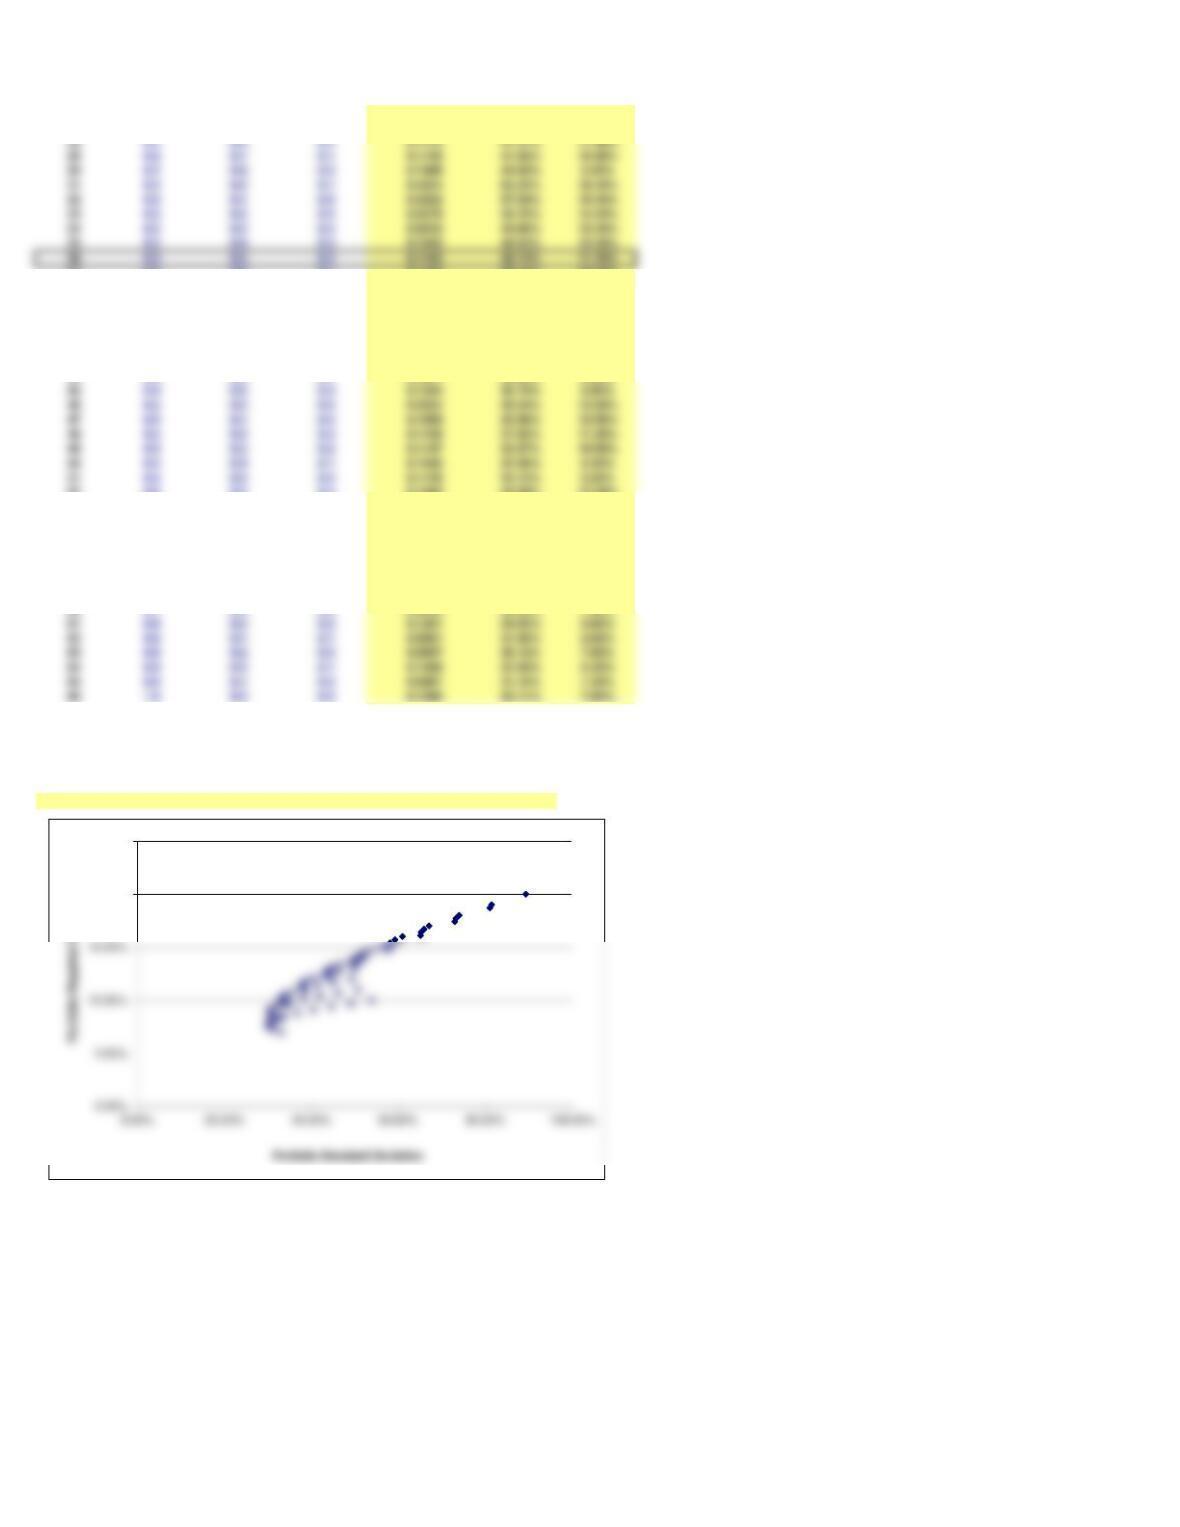
26 0.2 0.4 0.4 0.2178 46.67% 13.40%
27 0.2 0.5 0.3 0.1852 43.04% 12.40%
37 0.3 0.6 0.1 0.1453 38.12% 10.10%
38 0.3 0.7 0.0 0.1637 40.46% 9.10%
39 0.4 0.0 0.6 0.3324 57.66% 14.80%
40 0.4 0.1 0.5 0.2531 50.31% 13.80%
41 0.4 0.2 0.4 0.1923 43.86% 12.80%
42 0.4 0.3 0.3 0.1502 38.76% 11.80%
43 0.4 0.4 0.2 0.1267 35.59% 10.80%
44 0.4 0.5 0.1 0.1217 34.89% 9.80%
45 0.4 0.6 0.0 0.1354 36.79% 8.80%
46 0.5 0.0 0.5 0.2554 50.54% 13.50%
47 0.5 0.1 0.4 0.1899 43.58% 12.50%
48 0.5 0.2 0.3 0.1430 37.82% 11.50%
49 0.5 0.3 0.2 0.1147 33.87% 10.50%
50 0.5 0.4 0.1 0.1050 32.40% 9.50%
51 0.5 0.5 0.0 0.1139 33.75% 8.50%
52 0.6 0.0 0.4 0.1943 44.08% 12.20%
53 0.6 0.1 0.3 0.1427 37.77% 11.20%
54 0.6 0.2 0.2 0.1096 33.11% 10.20%
55 0.6 0.3 0.1 0.0952 30.85% 9.20%
56 0.6 0.4 0.0 0.0993 31.51% 8.20%
57 0.7 0.0 0.3 0.1492 38.63% 10.90%
58 0.7 0.1 0.2 0.1114 33.38% 9.90%
59 0.7 0.2 0.1 0.0922 30.36% 8.90%
60 0.7 0.3 0.0 0.0916 30.26% 7.90%
61 0.8 0.0 0.2 0.1201 34.65% 9.60%
62 0.8 0.1 0.1 0.0961 31.00% 8.60%
63 0.8 0.2 0.0 0.0907 30.12% 7.60%
64 0.9 0.0 0.1 0.1069 32.69% 8.30%
65 0.9 0.1 0.0 0.0967 31.10% 7.30%
66 1.0 0.0 0.0 0.1096 33.11% 7.00%
Hint: you could sort the date above by rp and sp.
c. The partial model provides a scatter diagram (shown below) showing the required returns and standard
deviations calculated above. This provides a visual indicator of the feasible set. If you would like a return of
10.50 percent, what is the smallest standard deviation that you must accept?
For rp = 10.50%, the smallest (and the only) standard deviation is 33.87%; see portfolio #49.
20.00%
25.00%
28 0.2 0.6 0.2 0.1712 41.37% 11.40%
29 0.2 0.7 0.1 0.1758 41.92% 10.40%
30 0.2 0.8 0.0 0.1989 44.60% 9.40%
31 0.3 0.0 0.7 0.4254 65.22% 16.10%
32 0.3 0.1 0.6 0.3322 57.64% 15.10%
33 0.3 0.2 0.5 0.2576 50.76% 14.10%
34 0.3 0.3 0.4 0.2016 44.90% 13.10%