358 ❖ Chapter 21/The Theory of Consumer Choice
a. The increase in the interest rate raises the price of “consumption when young.” The
substitution effect suggests that Saul would lower the amount of consumption when
young and save more for the future.
7. Because of this ambiguity, it is not clear how changing the way interest income is taxed will
affect overall savings rates.
SOLUTIONS TO TEXT PROBLEMS:
Quick Quizzes
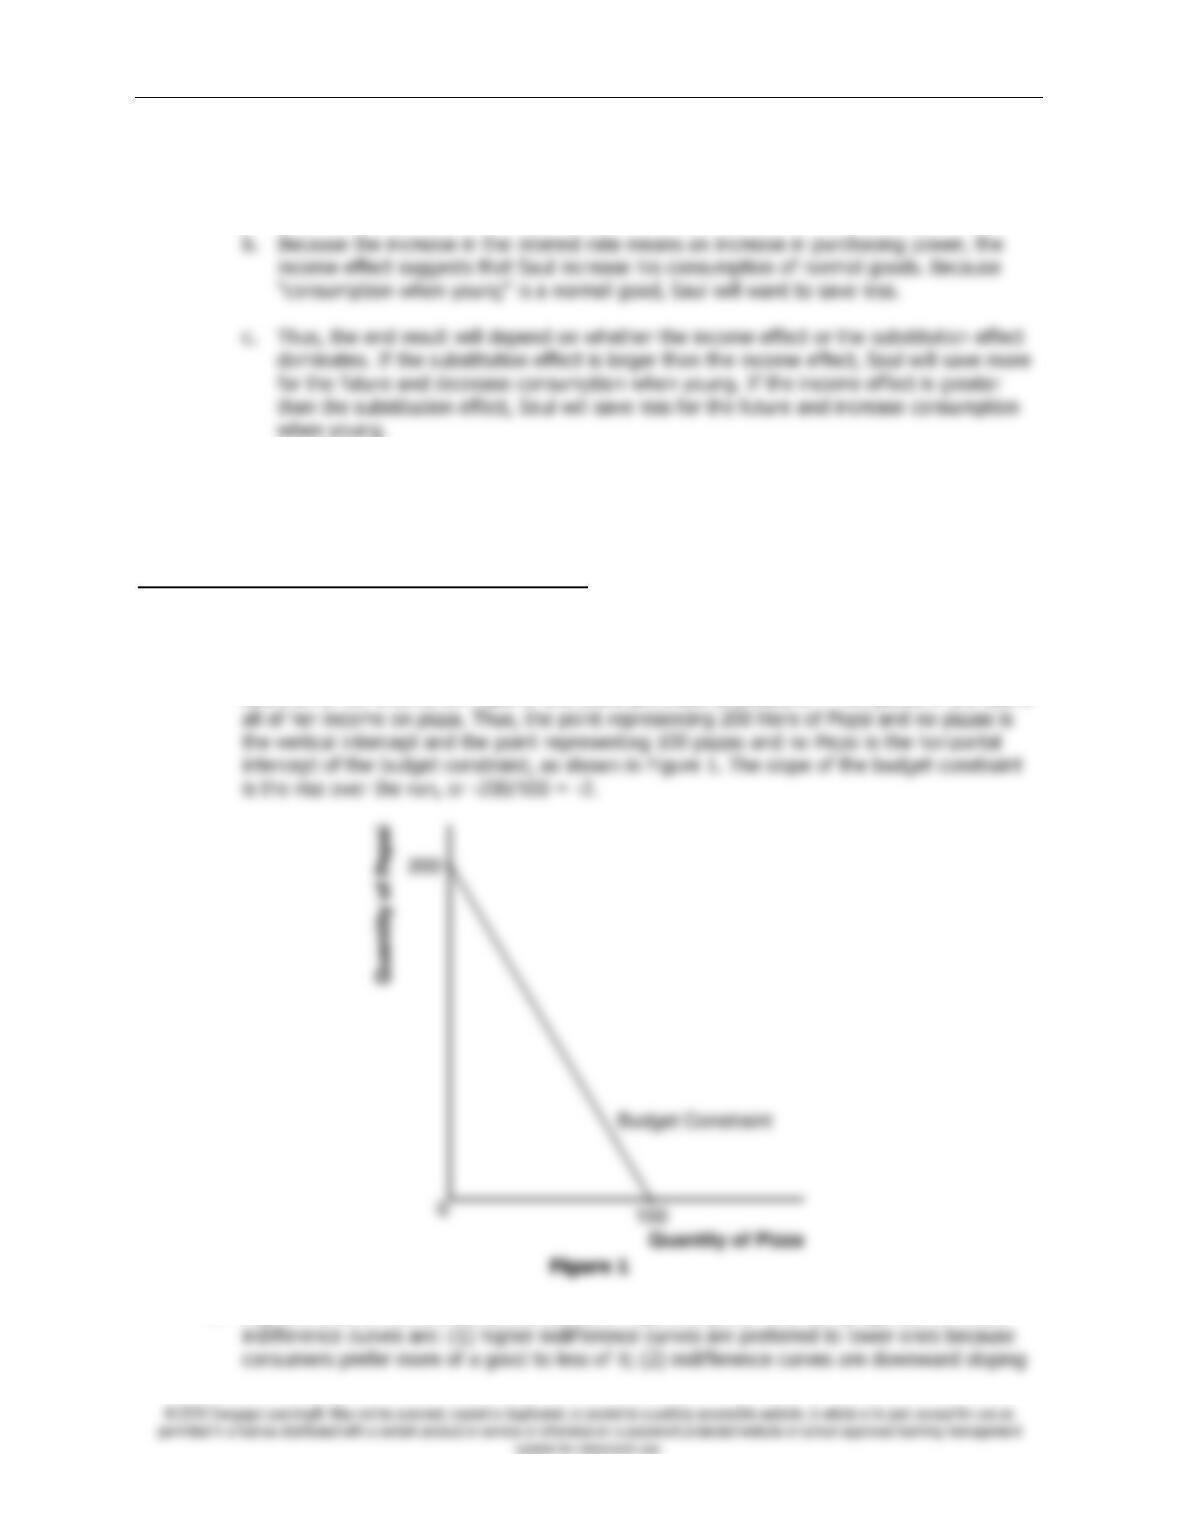
1. A person with an income of $1,000 could purchase $1,000/$5 = 200 liters of Pepsi if she
spent all of her income on Pepsi or she could purchase $1,000/$10 = 100 pizzas if she spent
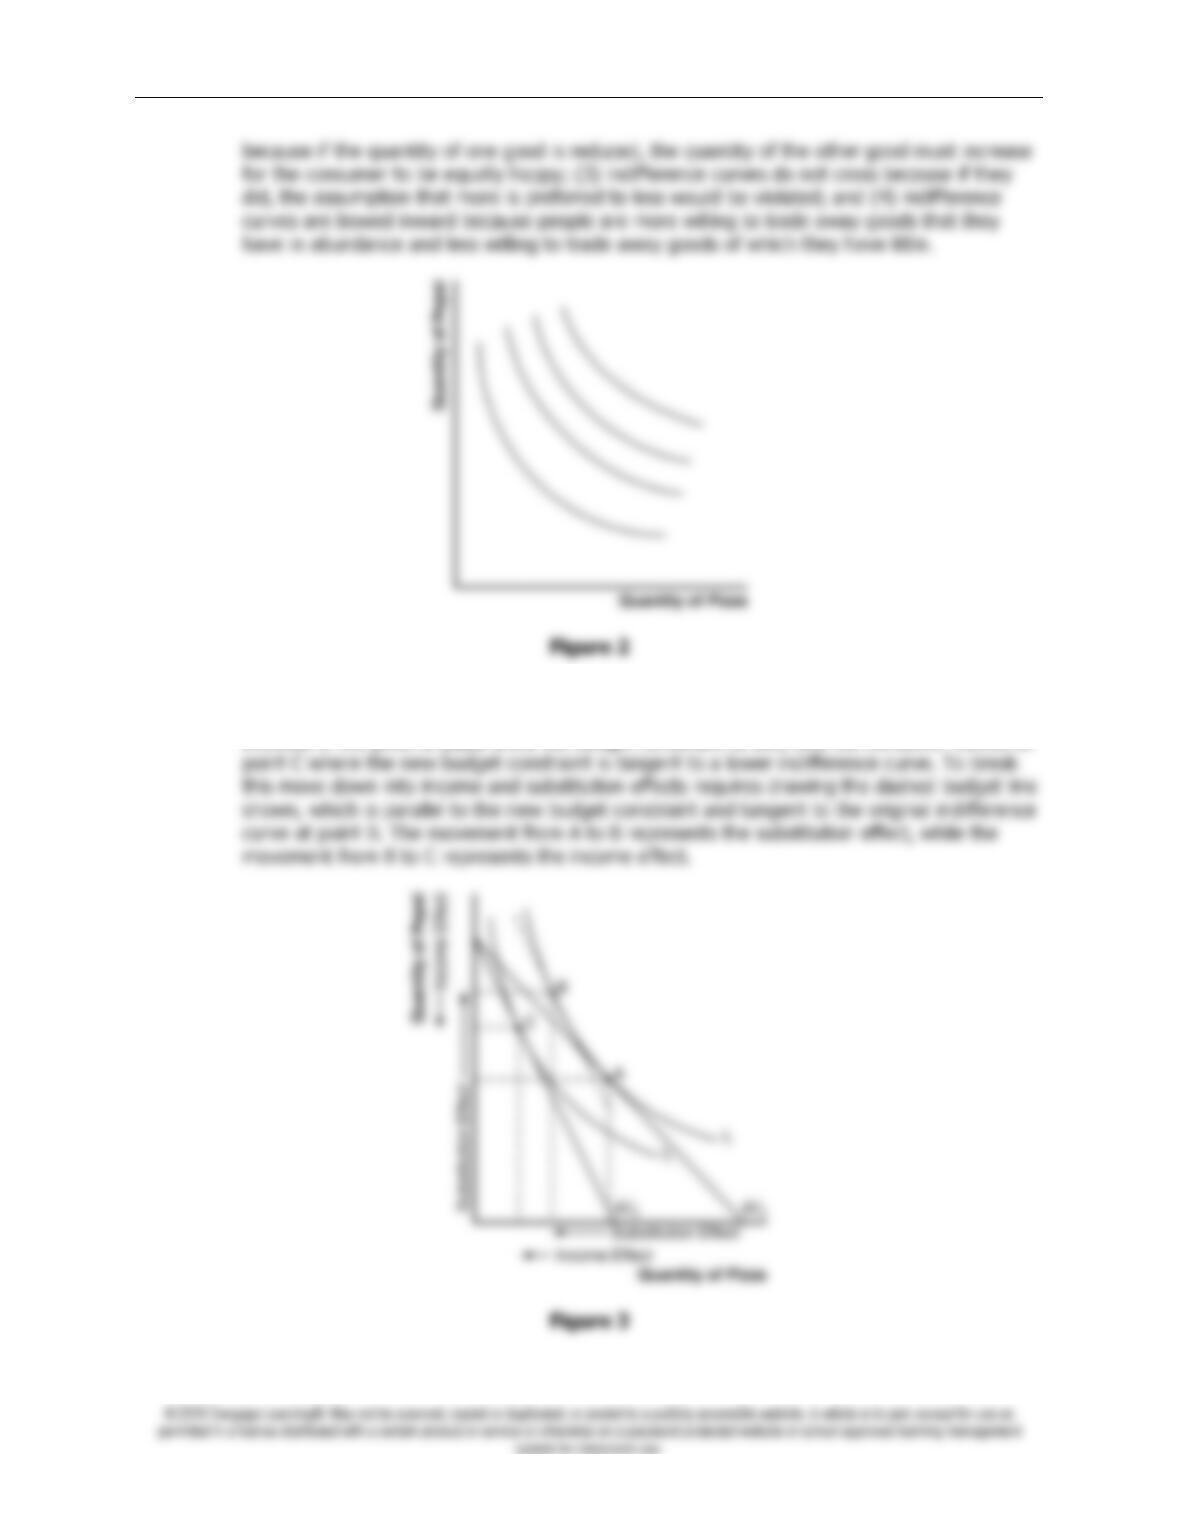
2. Figure 2 shows indifference curves between Pepsi and pizza. The four properties of these
Chapter 21/The Theory of Consumer Choice ❖ 359
3. Figure 3 shows the budget constraint (
BC
1) and two indifference curves. The consumer is
initially at point A, where the budget constraint is tangent to an indifference curve. The
increase in the price of pizza shifts the budget constraint to
BC
2, and the consumer moves to
360 ❖ Chapter 21/The Theory of Consumer Choice
4. An increase in the wage can potentially decrease the amount that a person wants to work
Chapter Quick Quiz
1. d
Questions for Review
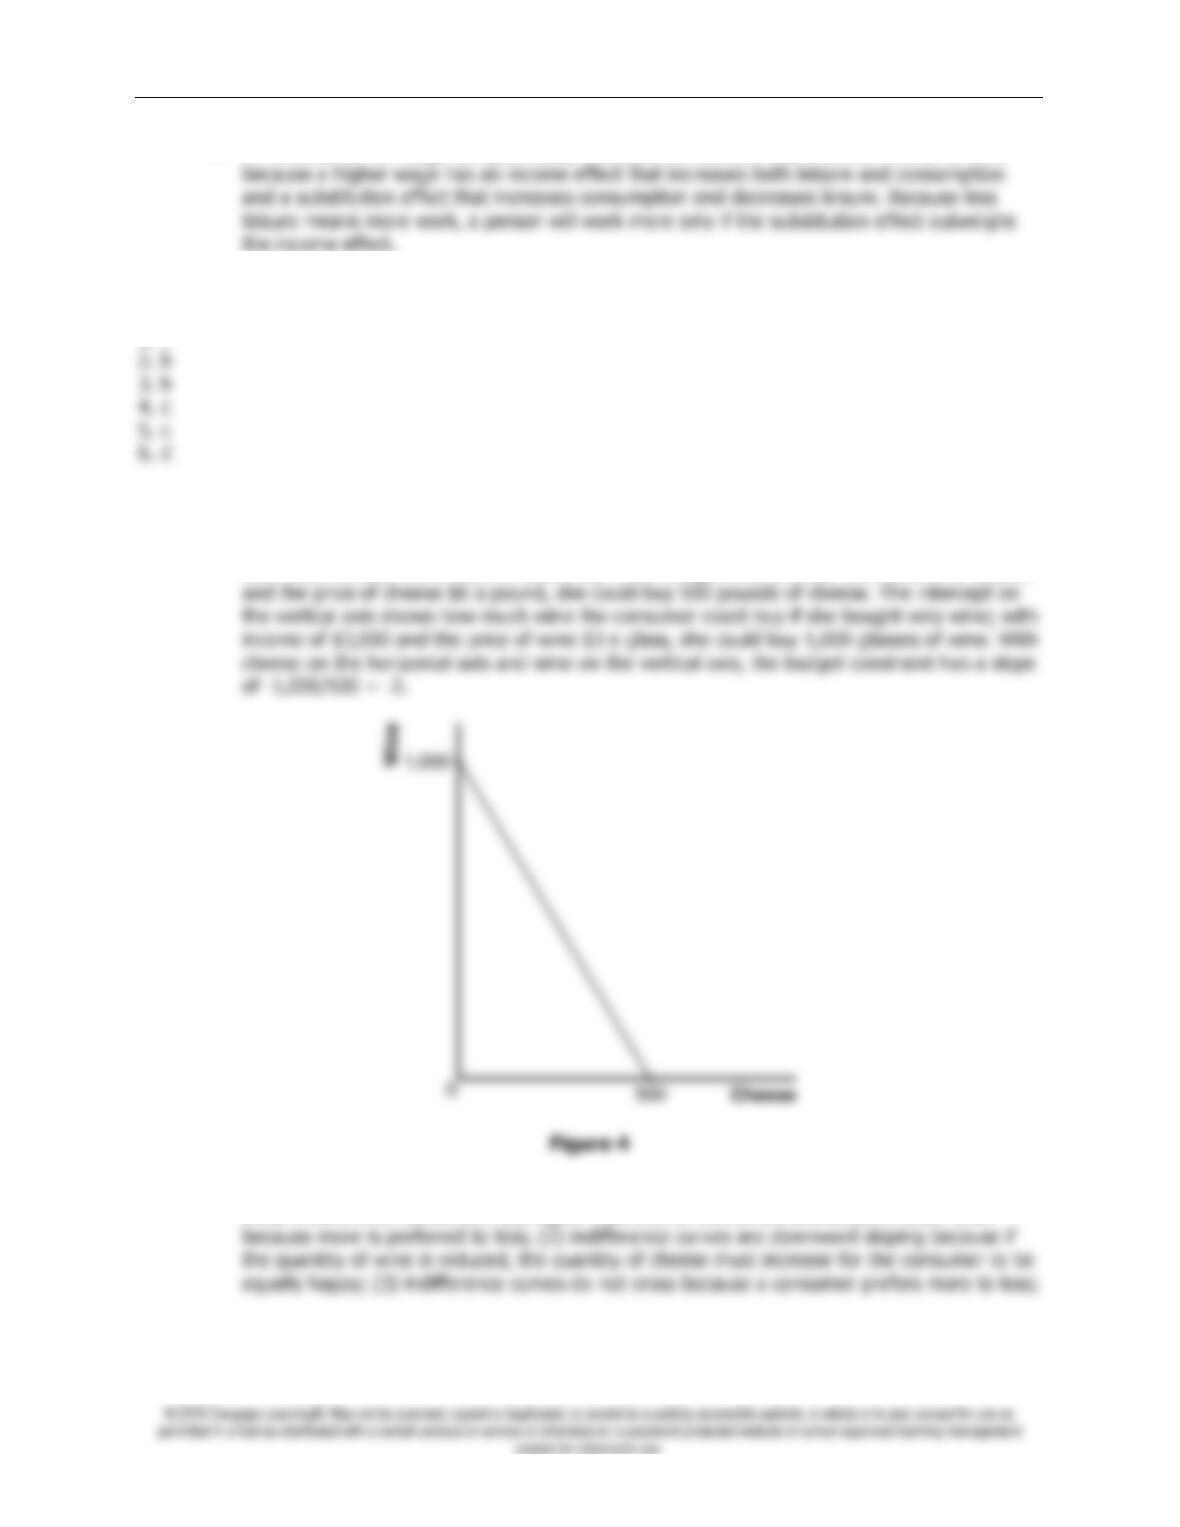
1. Figure 4 shows the consumer’s budget constraint. The intercept on the horizontal axis shows
how much cheese the consumer could buy if she bought only cheese; with income of $3,000
2. Figure 5 shows a consumer’s indifference curves for wine and cheese. Four properties of
these indifference curves are: (1) higher indifference curves are preferred to lower ones
Chapter 21/The Theory of Consumer Choice ❖ 361
and (4) indifference curves are bowed inward because a consumer is more willing to trade
away wine if she has a lot of it and less willing to trade away wine if she has little of it.
3. In Figure 5, the marginal rate of substitution (
MRS
) of one point on an indifference curve is
shown. The marginal rate of substitution shows the amount of wine the consumer would be
willing to give up to get one more pound of cheese.
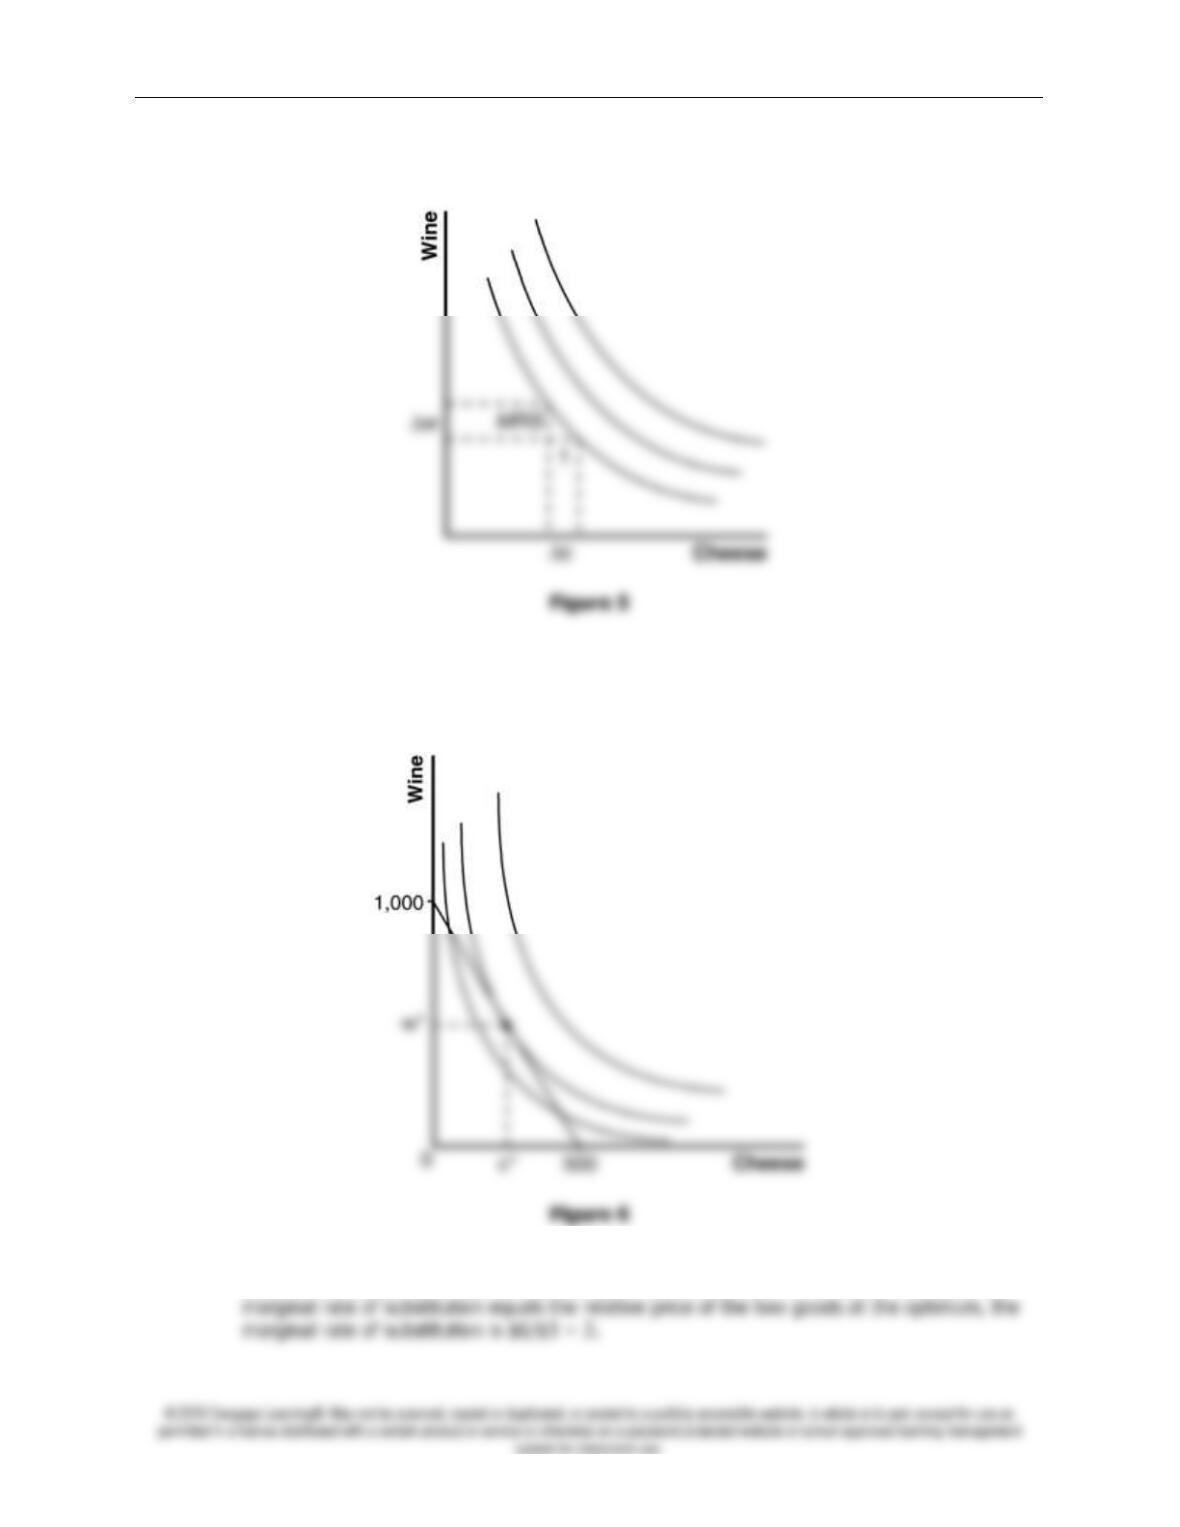
4. Figure 6 shows the consumer’s budget constraint and indifference curves for wine and
cheese. The consumer’s optimum consumption choice is shown as w* and c*. Because the
362 ❖ Chapter 21/The Theory of Consumer Choice
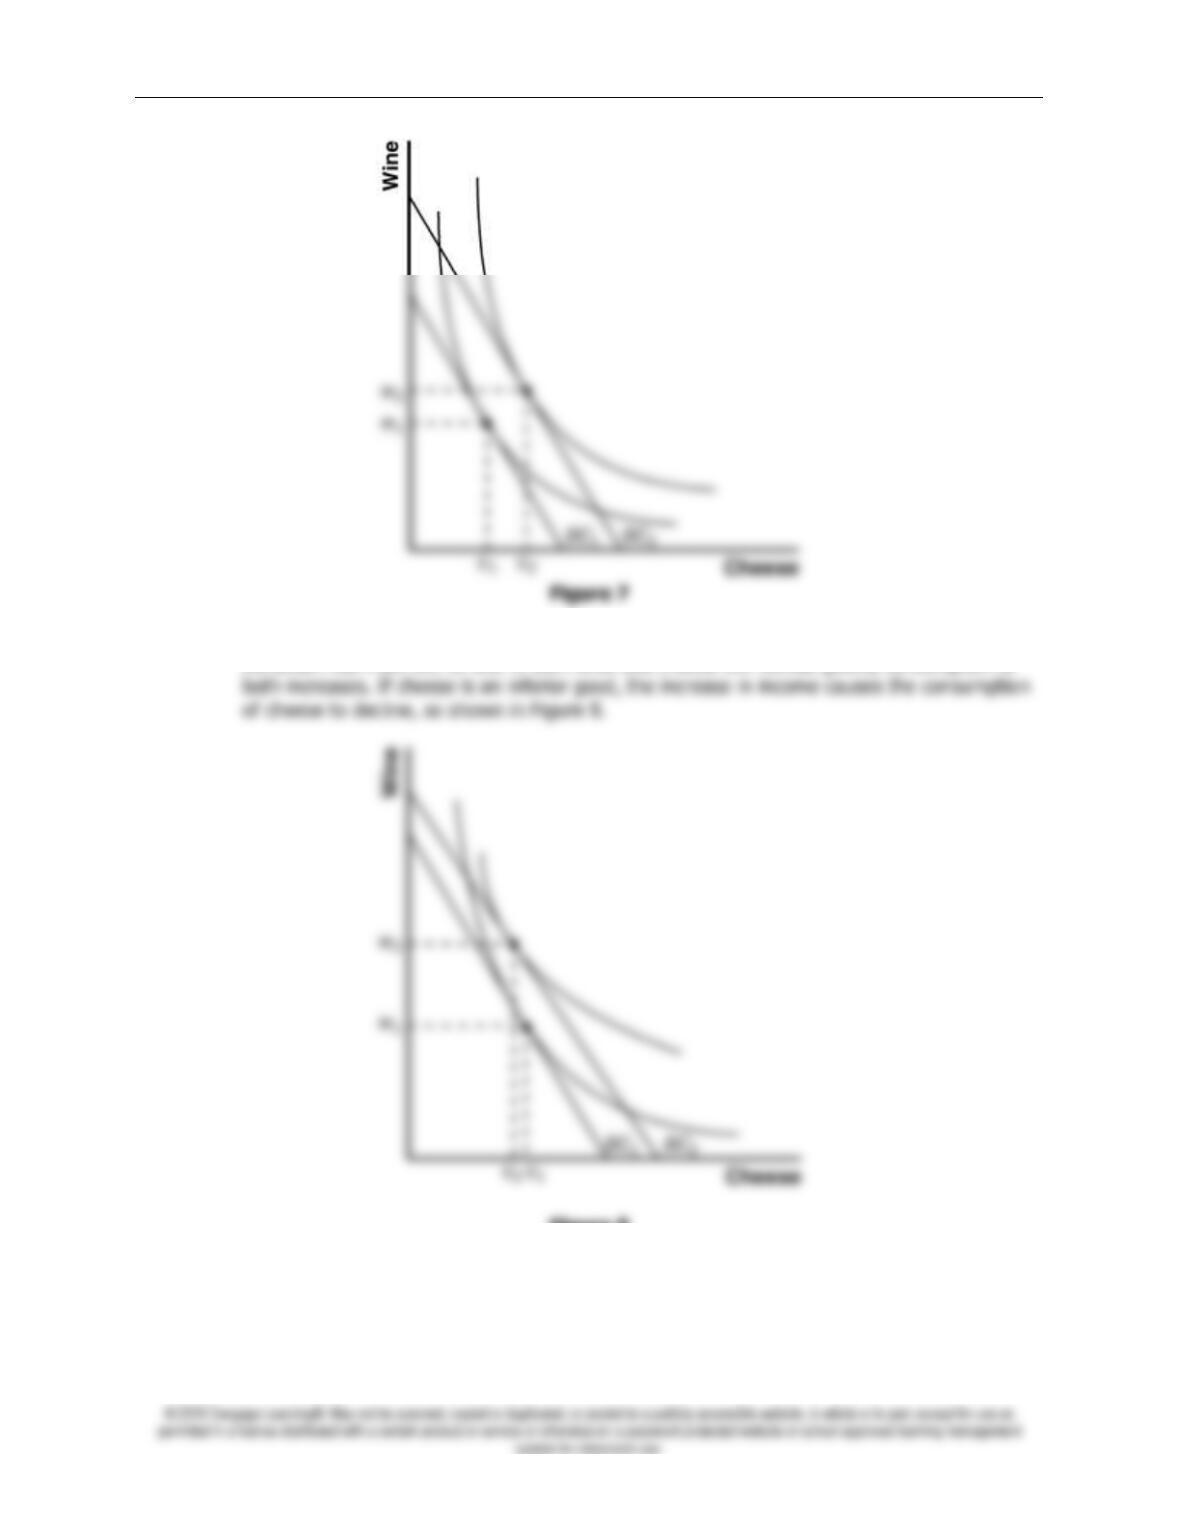
5. Figure 7 shows the effect of an increase in income. The rise in income shifts the budget
constraint out from
BC
1 to
BC
2. If both wine and cheese are normal goods, consumption of
Figure 8
Chapter 21/The Theory of Consumer Choice ❖ 363
Figure 9
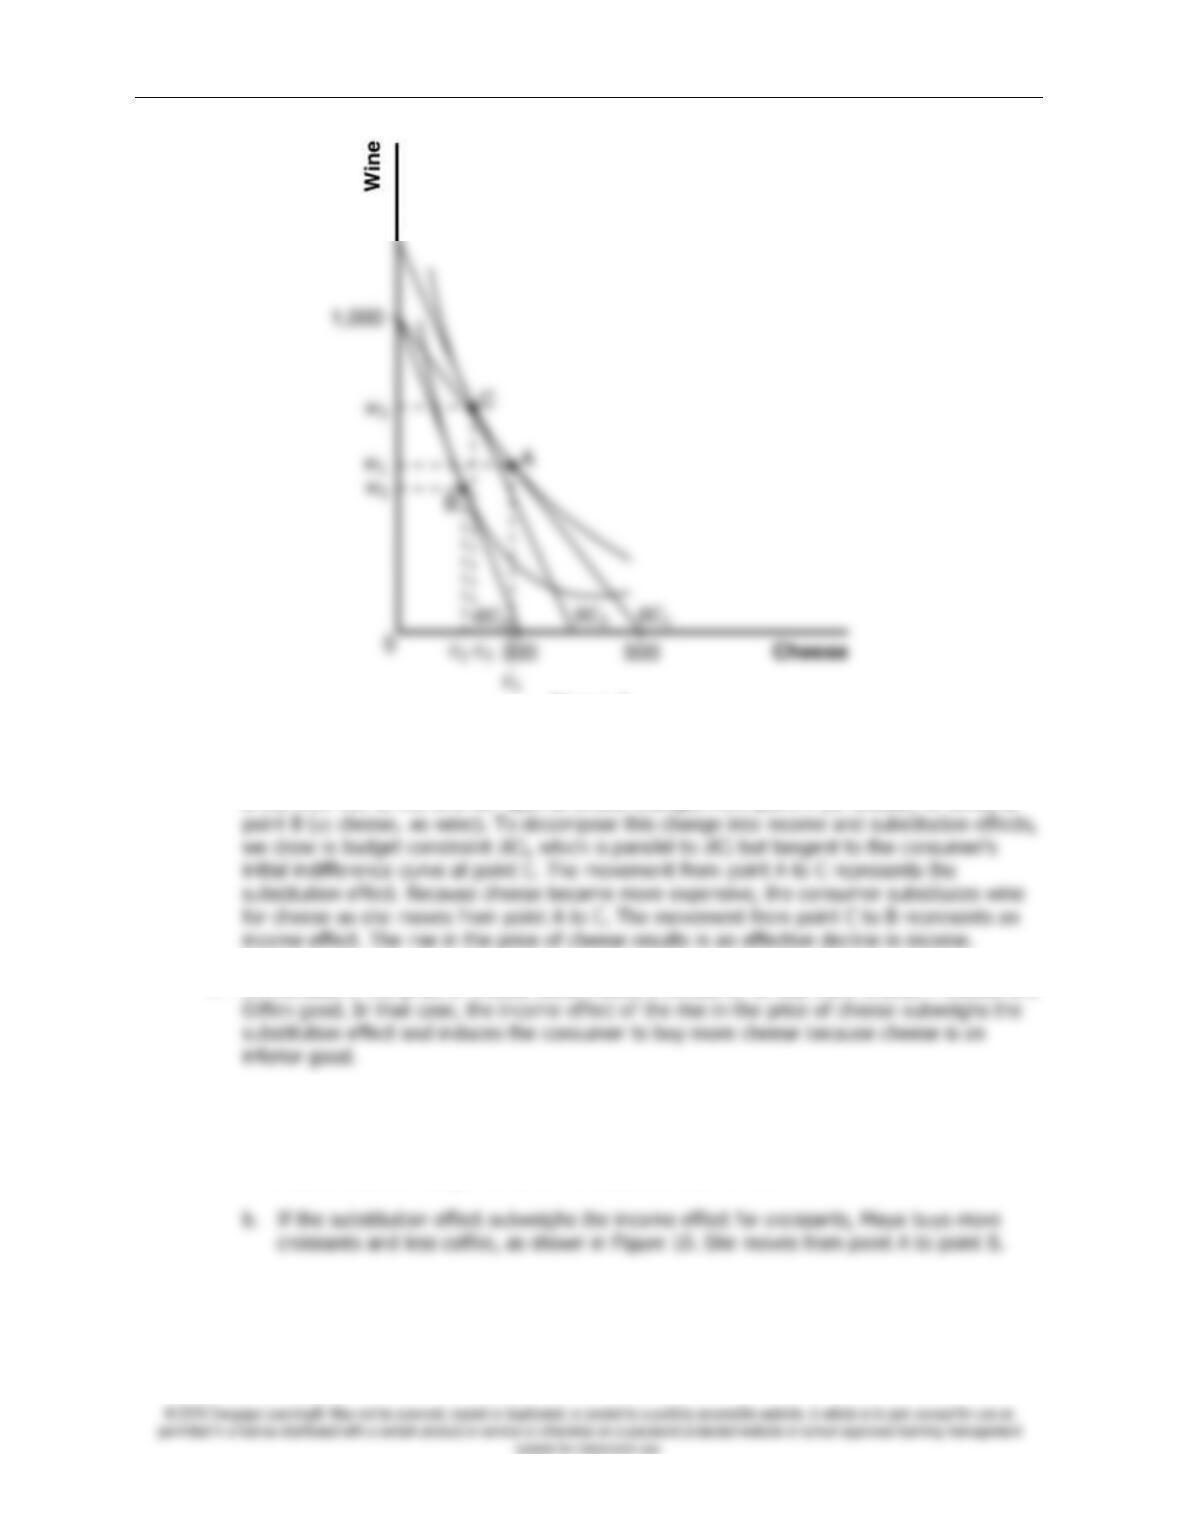
6. A rise in the price of cheese from $6 to $10 a pound makes the horizontal intercept of the
budget line decline from 500 to 300, as shown in Figure 9. The consumer’s budget constraint
shifts from
BC
1 to
BC
2 and her optimal choice changes from point A (
c
1 cheese,
w
1 wine) to
7. An increase in the price of cheese could induce a consumer to buy more cheese if cheese is a
Problems and Applications
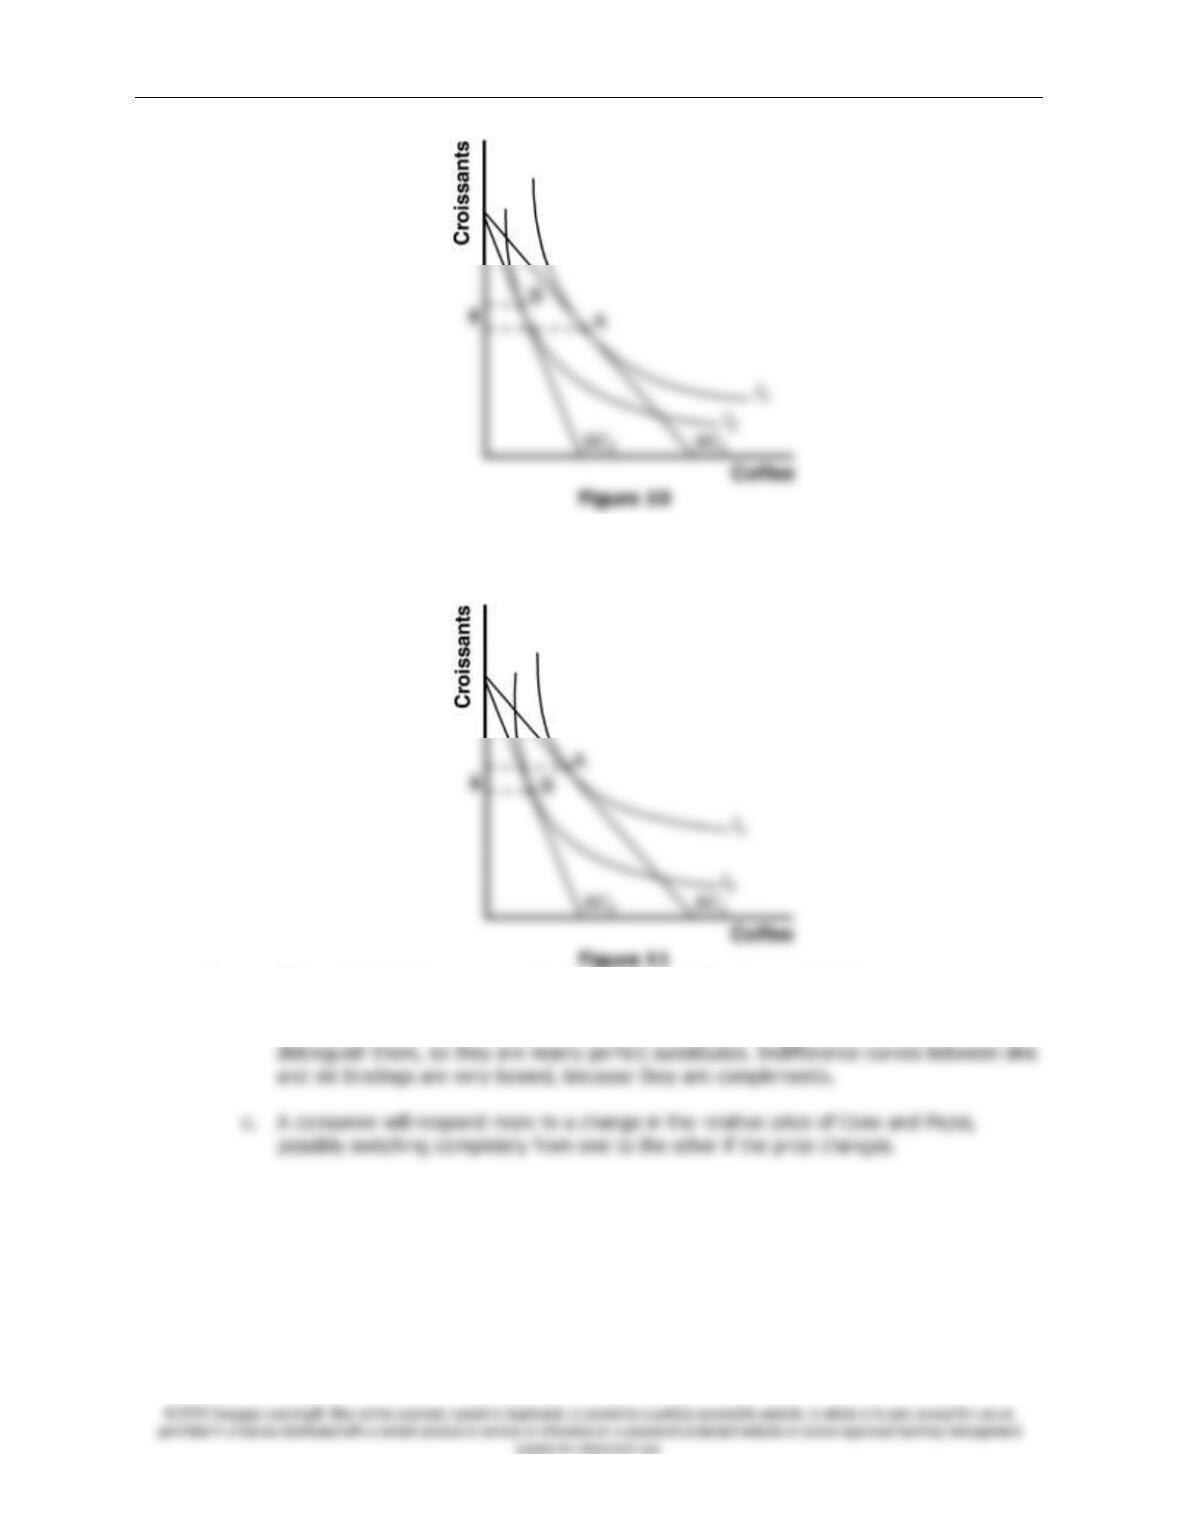
1. a. Figure 10 shows the effect of the frost on Maya’s budget constraint. Because the price of
coffee rises, her budget constraint rotates from
BC
1 to
BC
2.
364 ❖ Chapter 21/The Theory of Consumer Choice
c. If the income effect outweighs the substitution effect for croissants, Maya buys fewer
croissants and less coffee, moving from point A to point B in Figure 11.
2. a. Skis and ski bindings are complements. Coke and Pepsi are substitutes.
b. Indifference curves between Coke and Pepsi are fairly straight, because there is little to
Chapter 21/The Theory of Consumer Choice ❖ 365
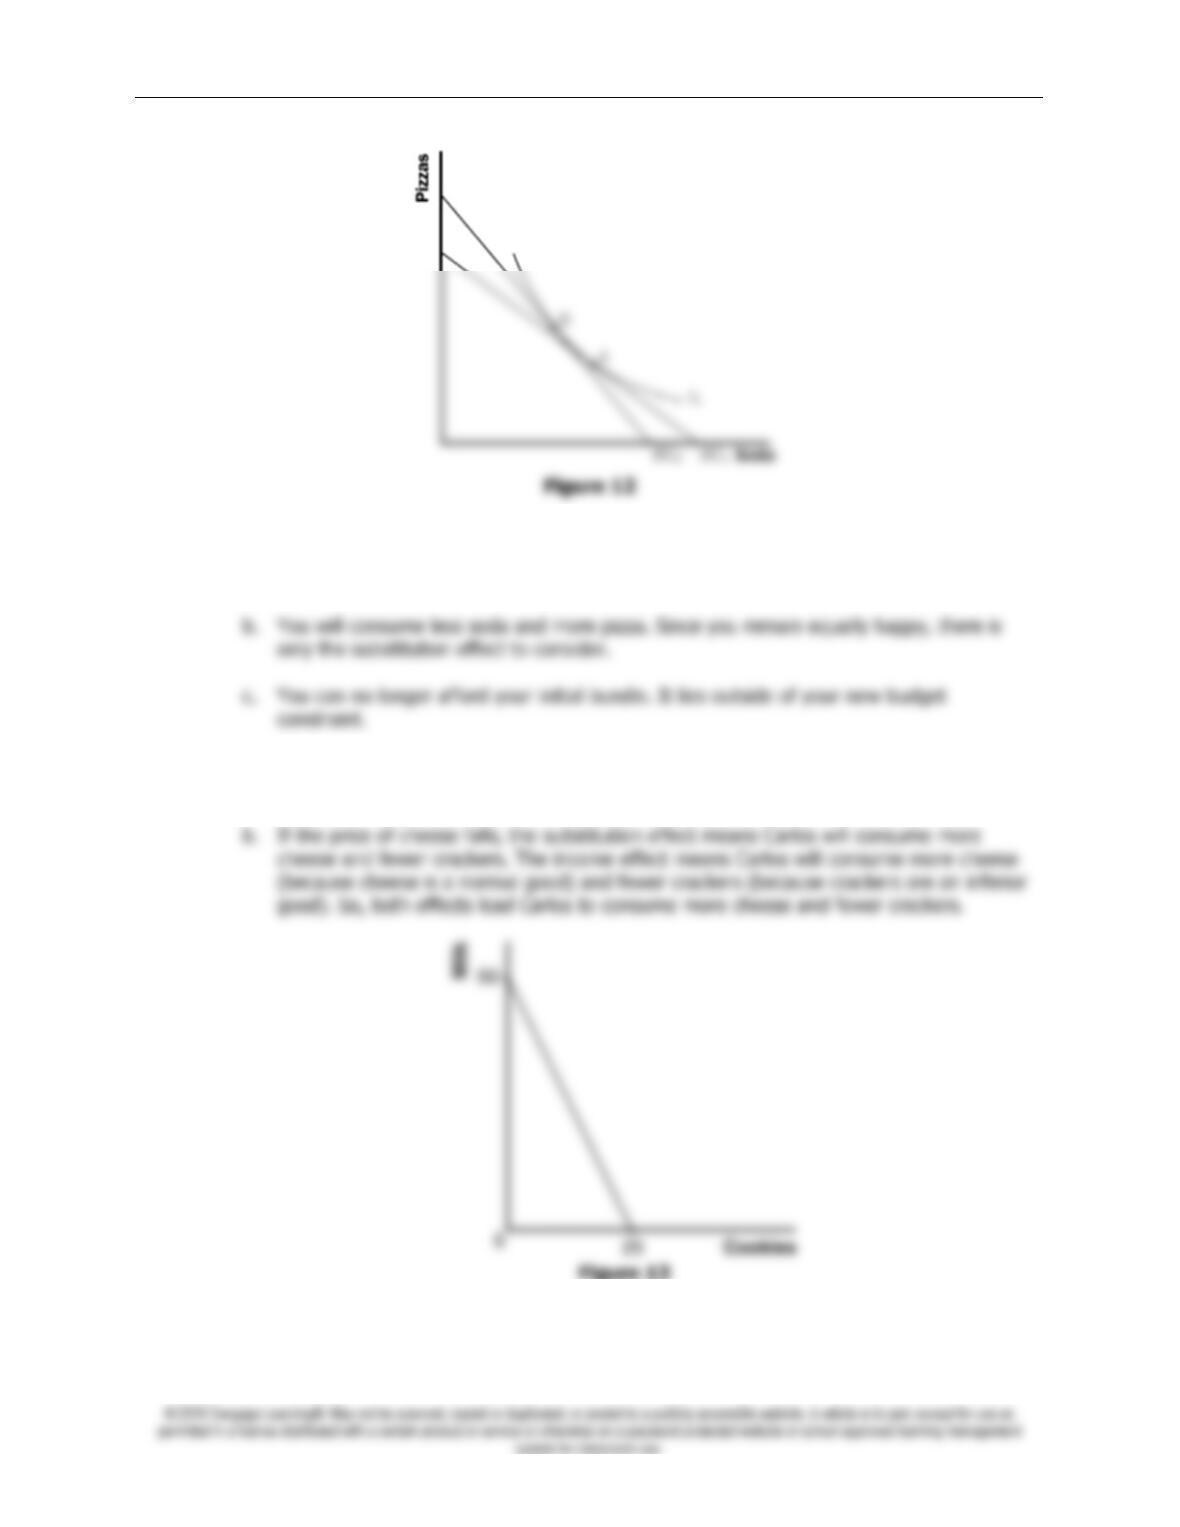
3. a. Figure 12 shows the effects of these price changes. If you are equally happy, you will
remain on the same indifference curve. However, both the increase in the price of soda
and the decline in the price of pizza make the budget constraint steeper.
4. a. Cheese and crackers cannot both be inferior goods, because if Carlos’s income rises he
must consume more of something.
5. a. Figure 13 shows Jacob’s budget constraint. The vertical intercept is 50 quarts of milk,
because if Jacob spent all his money on milk he would buy $100/$2 = 50 quarts of it.
366 ❖ Chapter 21/The Theory of Consumer Choice
6. a. This statement is true. All Giffen goods are inferior goods. It is impossible to have a
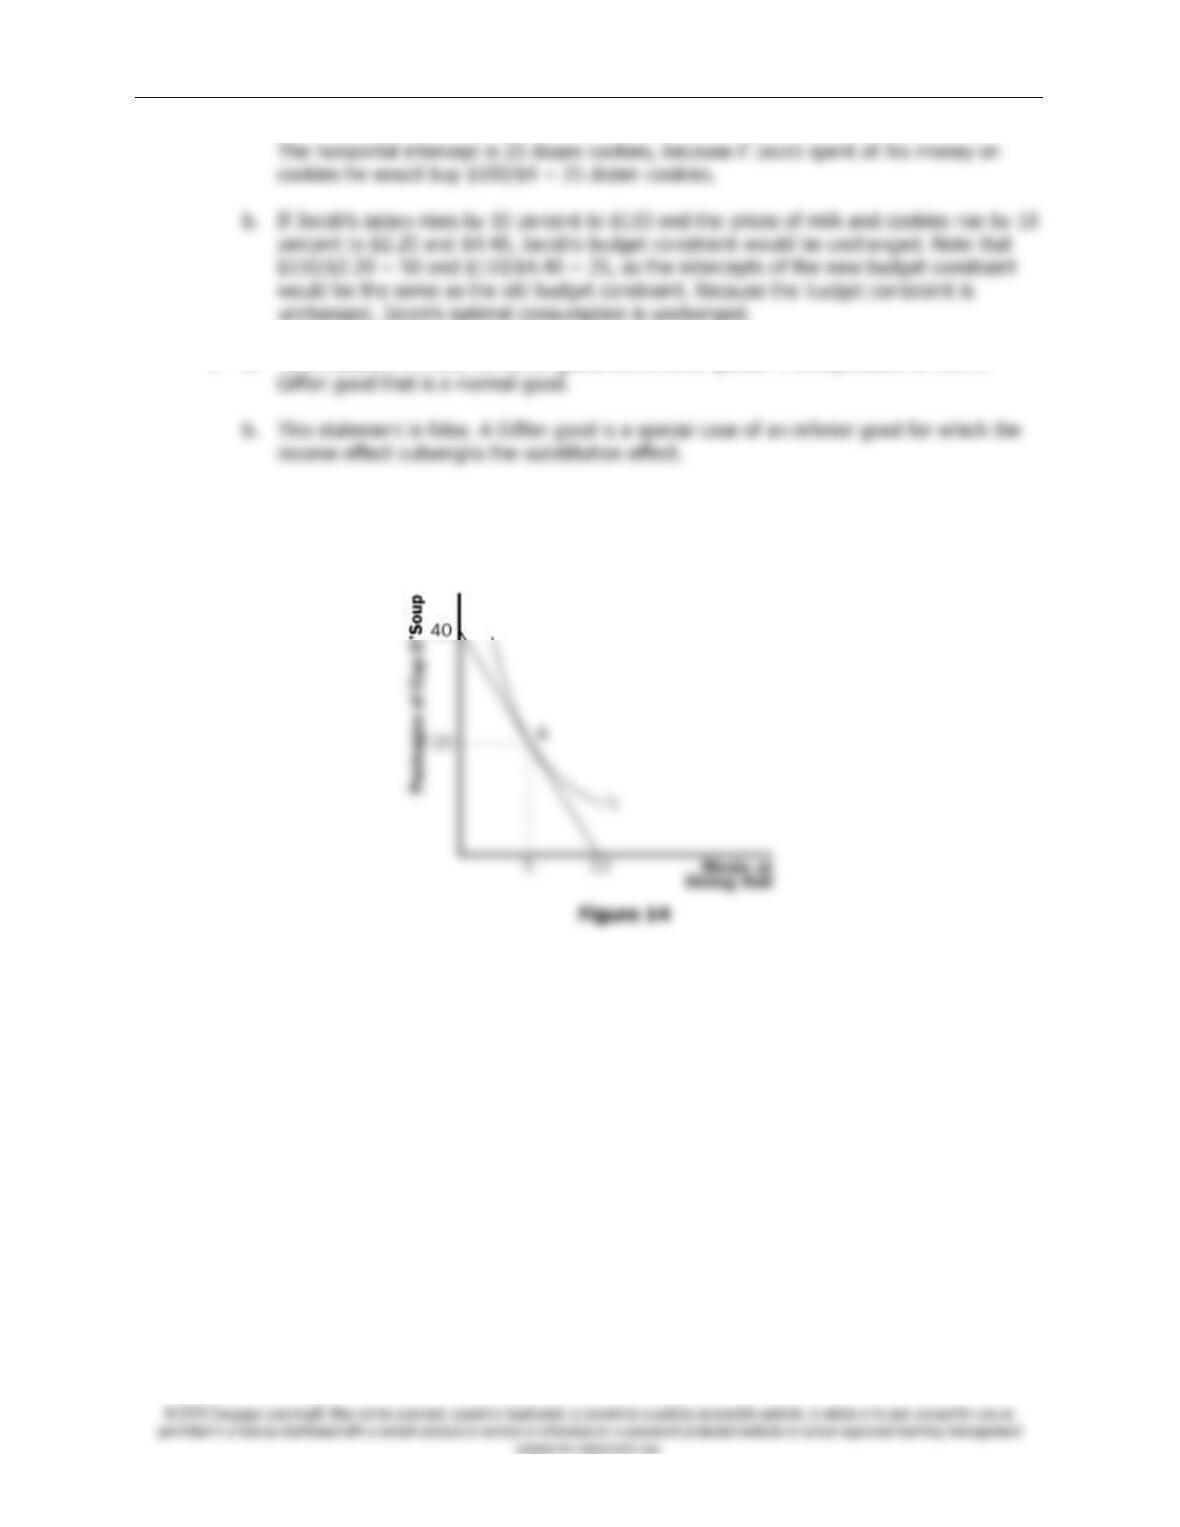
7. a. Figure 14 shows the student’s budget constraint. If she spends equal amounts on both
goods, she will purchase 5 meals in the dining hall and 20 packages of Cup O’ Soup
represented by point A.
Chapter 21/The Theory of Consumer Choice ❖ 367
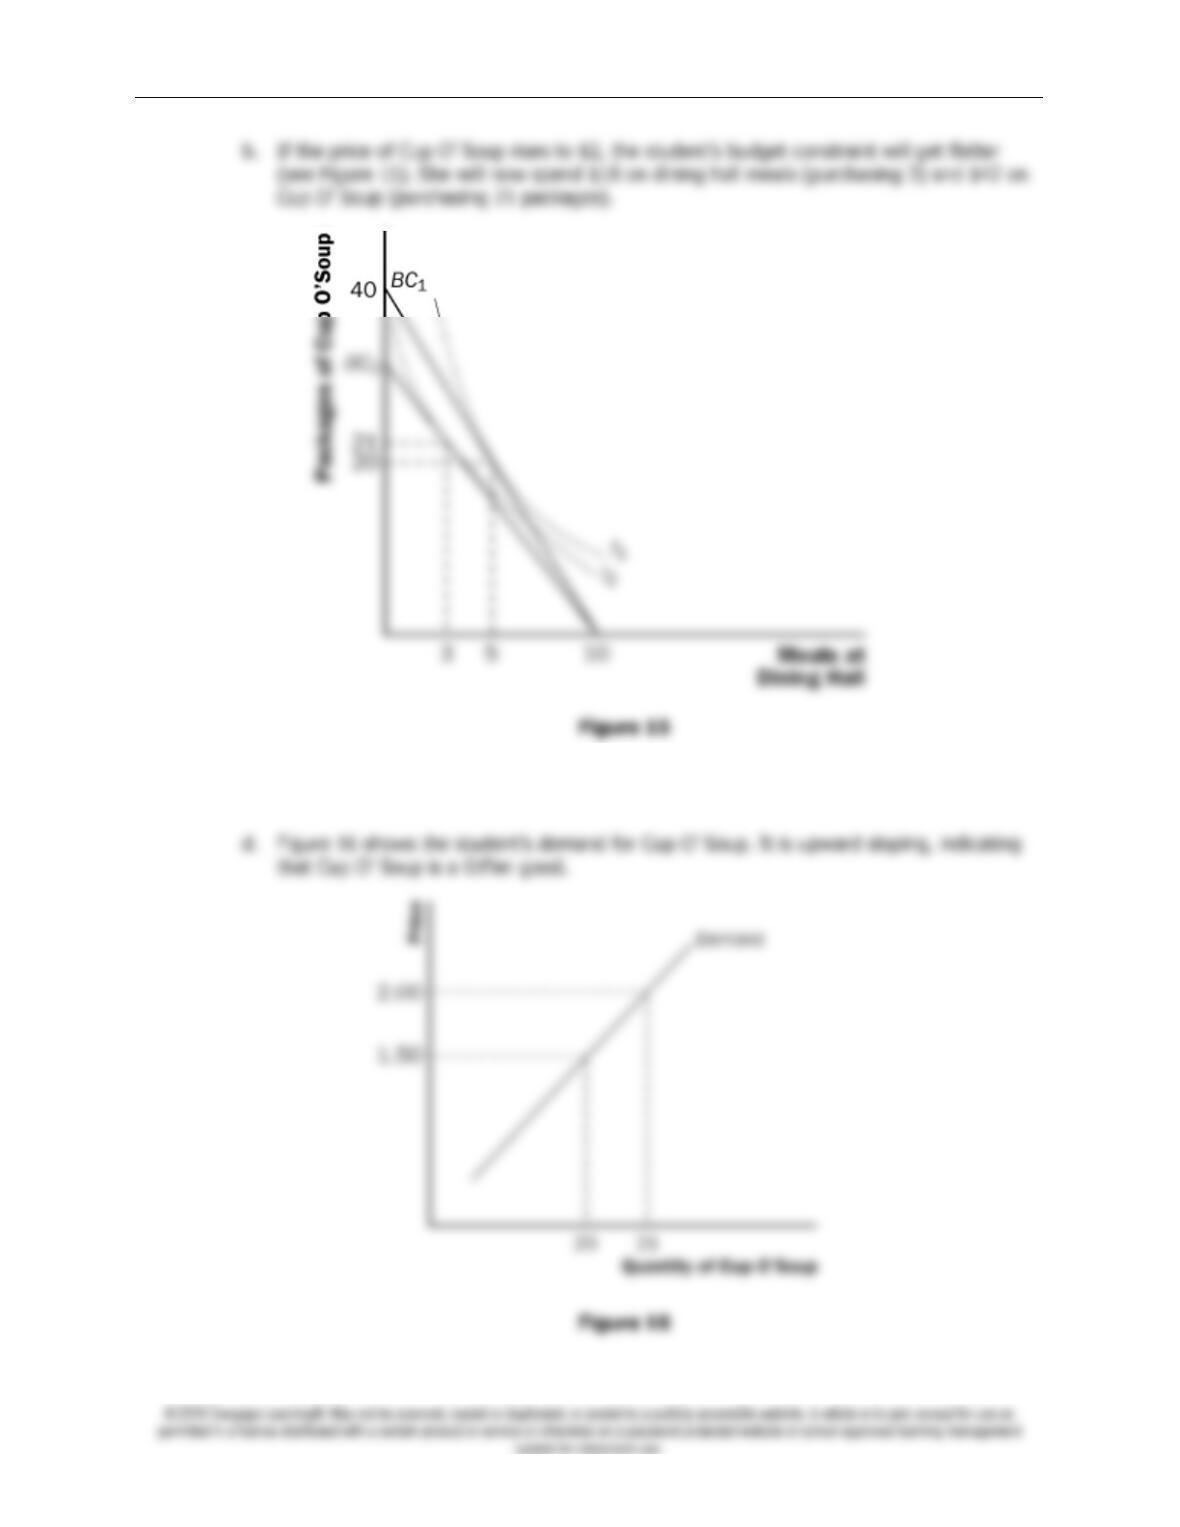
c. As the price of Cup O’ Soup rises, the student purchased more. This means that Cup O’
Soup is an inferior good for which the income effect outweighs the substitution effect.
368 ❖ Chapter 21/The Theory of Consumer Choice
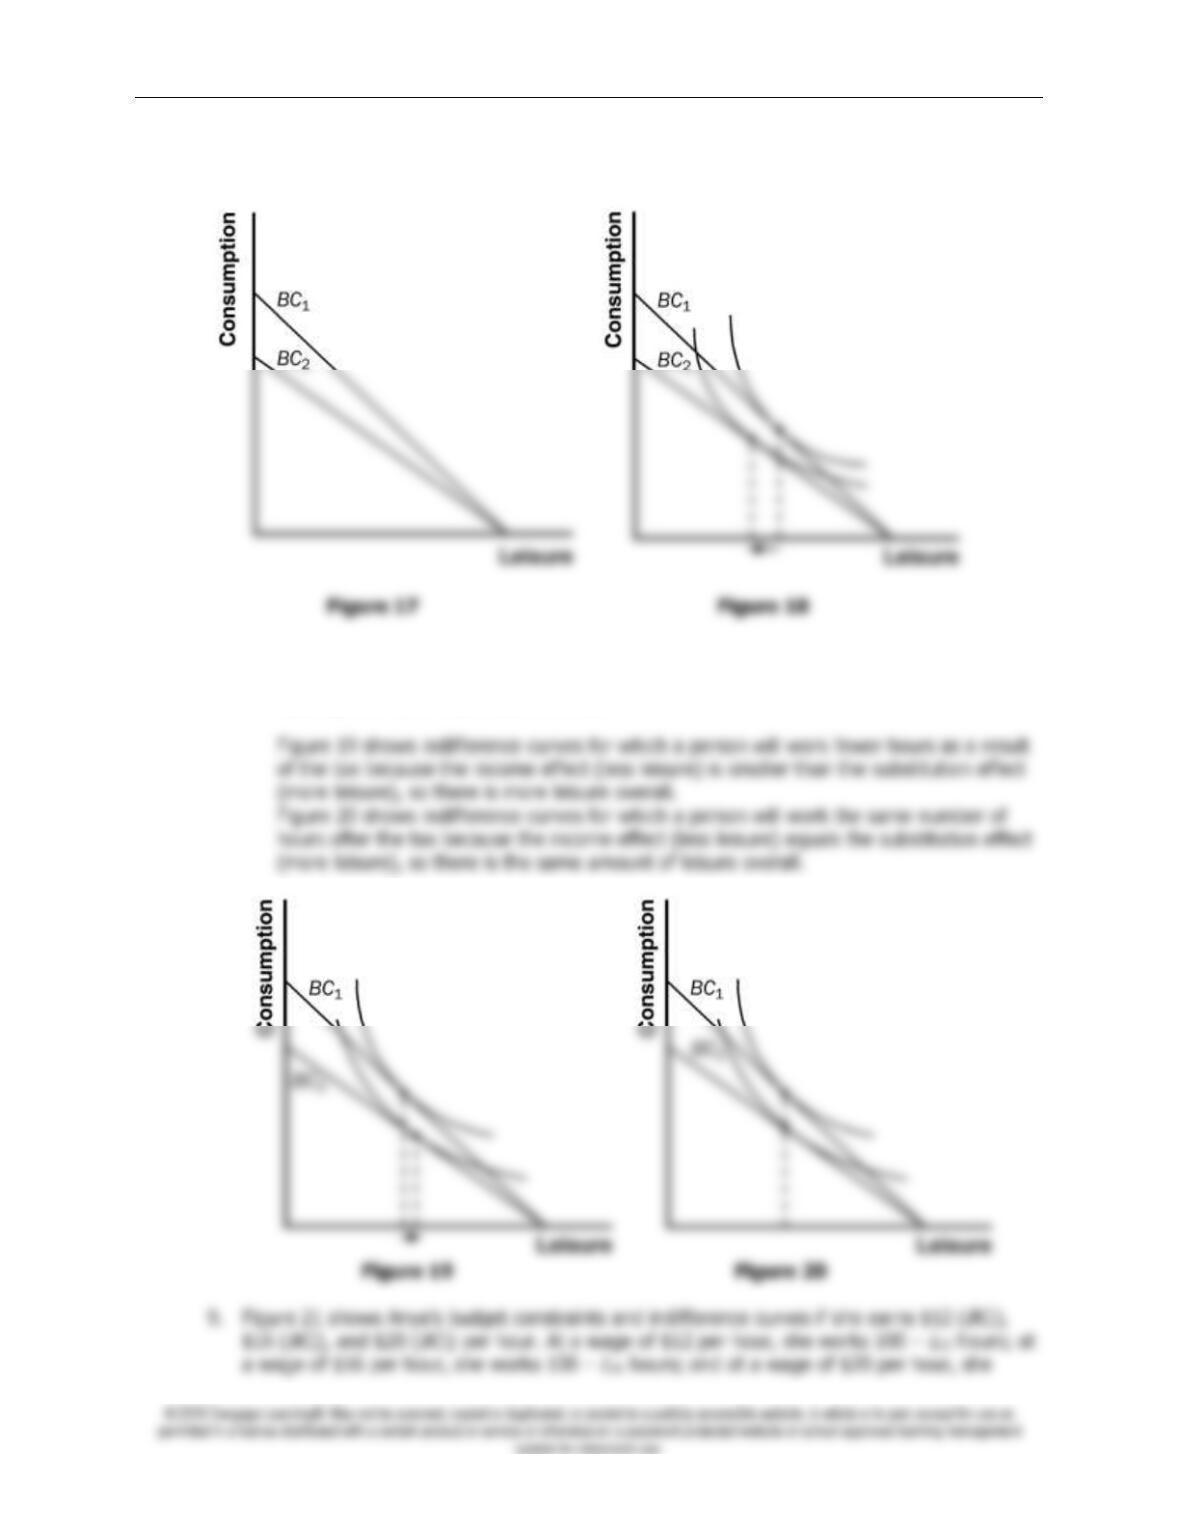
8. a. Budget constraint
BC
1 in Figure 17 shows the budget constraint if you pay no taxes.
Budget constraint
BC
2 shows the budget constraint with a 15 percent income tax.
b. Figure 18 shows indifference curves for which a person will work more as a result of the
tax because the income effect (less leisure) outweighs the substitution effect (more
leisure), so there is less leisure overall.
Chapter 21/The Theory of Consumer Choice ❖ 369
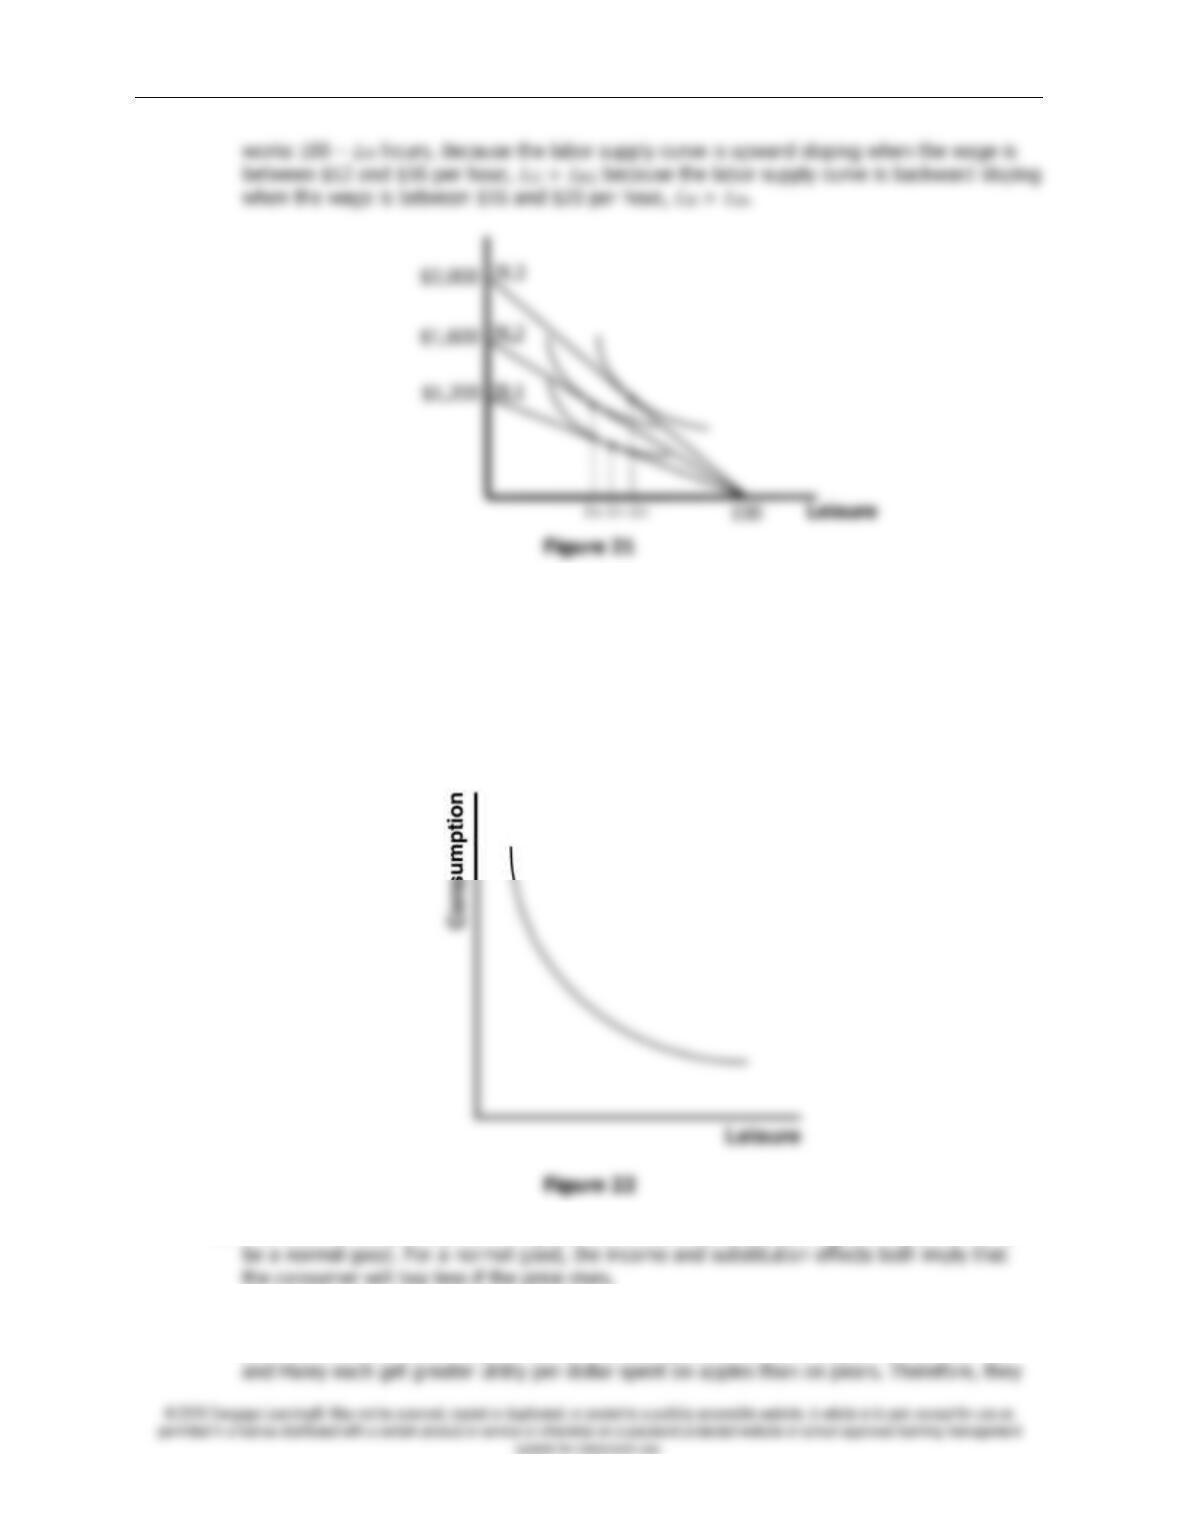
10. Figure 22 shows the indifference curve between leisure and consumption that determines
how much a person works. An increase in the wage leads to both an income effect and a
substitution effect. The higher wage makes the budget constraint steeper, so the substitution
effect increases consumption and reduces leisure. But the higher wage has an income effect
that increases both consumption and leisure if both are normal goods. The only way that
consumption could decrease when the wage increased would be if consumption is an inferior
good and if the negative income effect outweighs the positive substitution effect. This could
happen for a person who really placed an exceptionally high value on leisure.
11. If consumers do not buy less of a good when their incomes rise, the good in question must
12. Utility is maximized when the marginal utility per dollar spent is equal across goods. Claire
and Alex are both purchasing the utility-maximizing combination of apples and pears. Phil
370 ❖ Chapter 21/The Theory of Consumer Choice