Mishkin • Instructor’s Manual for The Economics of Money, Banking, and Financial Markets, Twelfth Edition 219
Chapter 20
ANSWERS TO QUESTIONS
1. “When the stock market rises, investment spending is increasing.” Is this statement true, false,
or uncertain? Explain your answer.
False. Stocks do not add directly to investment in a macroeconomic sense; since the buying and
2. Why is inventory investment counted as part of aggregate spending if it isn’t actually sold to
the final end user?
3. “Since inventories can be costly to hold, firms’ planned inventory investment should be zero,
and firms should acquire inventory only through unplanned inventory accumulation.” Is this
statement true, false, or uncertain? Explain your answer.
4. During and in the aftermath of the financial crisis of 2007–2009, planned investment fell
substantially despite significant decreases in the real interest rate. What factors related to
the planned investment function could explain this?
During the height of the crisis, financial frictions
f
increased dramatically, which effectively
raised the real cost of investment. In addition, firms’ planned autonomous investment I
5. If households and firms believe the economy will be in a recession in the future, will this
necessarily cause a recession, or have any impact on output at all?
These shifts in “animal spirits,” according to Keynes, could very well create a recession. If
6. Why do increases in the real interest rate lead to decreases in net exports, and vice versa?
When the real interest rate increases, this increases the demand for domestic assets, resulting
7. How would a decline in house prices, or decrease in stock market prices affect the IS curve?
Either a decline in house prices, or a decrease in stock market prices would reduce household
wealth. As a result, autonomous consumption would decline, leading to a leftward shift of the
8. If firms suddenly become more optimistic about the profitability of investment and planned
investment spending rises by $100 billion, while consumers become more pessimistic and
autonomous consumer spending falls by $100 billion, what happens to aggregate output?
9. If an increase in autonomous consumer expenditure is matched by an equal increase in taxes,
will aggregate output rise or fall?
Rise. The fall in spending from an increase in taxes is always less than the change in taxes
because the marginal propensity to consume is less than 1. By contrast, autonomous spending
10. If a change in the interest rate has no effect on planned investment spending or net exports,
what does this imply about the slope of the IS curve?
11. Inventories typically increase starting at the beginning of recessions, and begin to decline
near the end of recessions. What does this say about the relationship between planned
spending and aggregate output over the business cycle?
At the beginning of recessions, planned spending falls as consumers reduce spending and
firms reduce investment, while production generally stays constant. As a result, an excess
12. Why do companies cut production when they find that their unplanned inventory investment
is greater than zero? If they didn’t cut production, what effect would this have on their
profits? Why?
13. “Firms will increase production when planned investment is less than (actual) total
investment.” Is this statement true, false, or uncertain? Explain your answer.
14. In each of the cases below, determine whether the IS curve shifts to the right or left, does not
shift, or is indeterminate in the direction of shift.
a. The real interest rate rises.
This is a movement along the IS curve, and so does not shift the IS curve.
b. The marginal propensity to consume declines.
c. Financial frictions increase.
Equilibrium output decreases at any given interest rate, which shifts the IS curve to the
left.
d. Autonomous consumption decreases.
Equilibrium output decreases at any given interest rate, which shifts the IS curve to the
left.
15. Financial frictions are not a problem for the economy, since they do not affect the safe policy
rate which is controlled by the central bank.” Is this statement true, false, or uncertain?
Explain your answer
False. When financial frictions increase, they lead to an increase in market borrowing rates
16. When the Federal Reserve reduces its policy interest rate, how, if at all, is the IS curve
affected? Briefly explain.
17. Suppose you read that prospects for stronger future economic growth have led the dollar to
strengthen and stock prices to increase.
a. What effect does the strengthened dollar have on the IS curve?
A more expensive dollar will result in fewer U.S. exports and more U.S. imports
b. What effect does the increase in stock prices have on the IS curve?
Usually the increase in stock prices is interpreted as having a positive effect on
autonomous planned investment, as investors become more confident about the future
c. What is the combined effect of these two events on the IS curve?
Mishkin • Instructor’s Manual for The Economics of Money, Banking, and Financial Markets, Twelfth Edition 223
ANSWERS TO APPLIED PROBLEMS
18. Calculate the value of the consumption function at each level of income in the table below if
autonomous consumption = 300, taxes = 200, and mpc = 0.9.
Income Y Disposable Income YDConsumption C
0
100
200
Income Y Disposable Income YDConsumption C
0 –200 120
100 –100 210
200 0 300
300 100 390
19. Assume that autonomous consumption is $1,625 billion and disposable income is $11,500
billion. Calculate consumption expenditure if an increase of $1,000 in disposable income leads
to an increase of $750 in consumption expenditure.
If an increase of $1,000 in disposable income leads to an increase of $750 in consumption
20. Suppose that Dell Corporation has 20,000 computers in its warehouses on December 31,
2016, ready to be shipped to merchants (each computer is valued at $500). By December 31,
2017, Dell Corporation has 25,000 computers ready to be shipped, each valued at $450.
a. Calculate Dell’s inventory on December 31, 2016.
Dell’s inventory on December 31, 2019, is the market value of the 20,000 computers at
b. Calculate Dell’s inventory investment in 2017.
Dell’s inventory spending is the change in the level of its inventory during the course of
c. What happens to inventory spending during the early stages of an economic recession?
During the early stages of an economic recession, as soon as households’ income starts to
fall, firms realize that their sales drop. This results in fewer orders by their dealers and
21. If the consumption function is C = 100 + 0.75YD, I = 200, government spending is 200, and
net exports are zero, what will be the equilibrium level of output? What will happen to
aggregate output if government spending rises by 100?
22. If the marginal propensity to consume is 0.75, by how much would government spending
have to rise to increase output by $1,000 billion? By how much would taxes need to decrease
to increase output by $1,000 billion?
The change in output ‘Y is given as the change in spending ‘G, multiplied by 1/(1 – mpc).
Thus $1000 = 4‘G, implying government spending would have to increase by $250 billion in
23. Assuming both taxes and government spending increase by the same amount, derive an
expression for the effect on equilibrium output.
Formally, the effects on output from a change in government spending and a change in taxes
are given, respectively, as ‘YG = ‘G/(1 – mpc) and ‘YT = –‘T u mpc/(1 – mpc). If both taxes
24. Consider an economy described by the following data:
ܥ
ഥ = $3.25 trillion
ܫ
ҧ
= $1.3 trillion
݂
ഥ= 1
mpc = 0.75
a. Derive simplified expressions for the consumption function, the investment function, and
the net export function.
b. Derive an expression for the IS curve.
1 – 0.1r. This implies 0.25Y = 4.5 – 0.4r, or Y = 18 – 1.6r.
c. If the real interest rate is r = 2, what is equilibrium output? If r = 5, what is equilibrium
output?
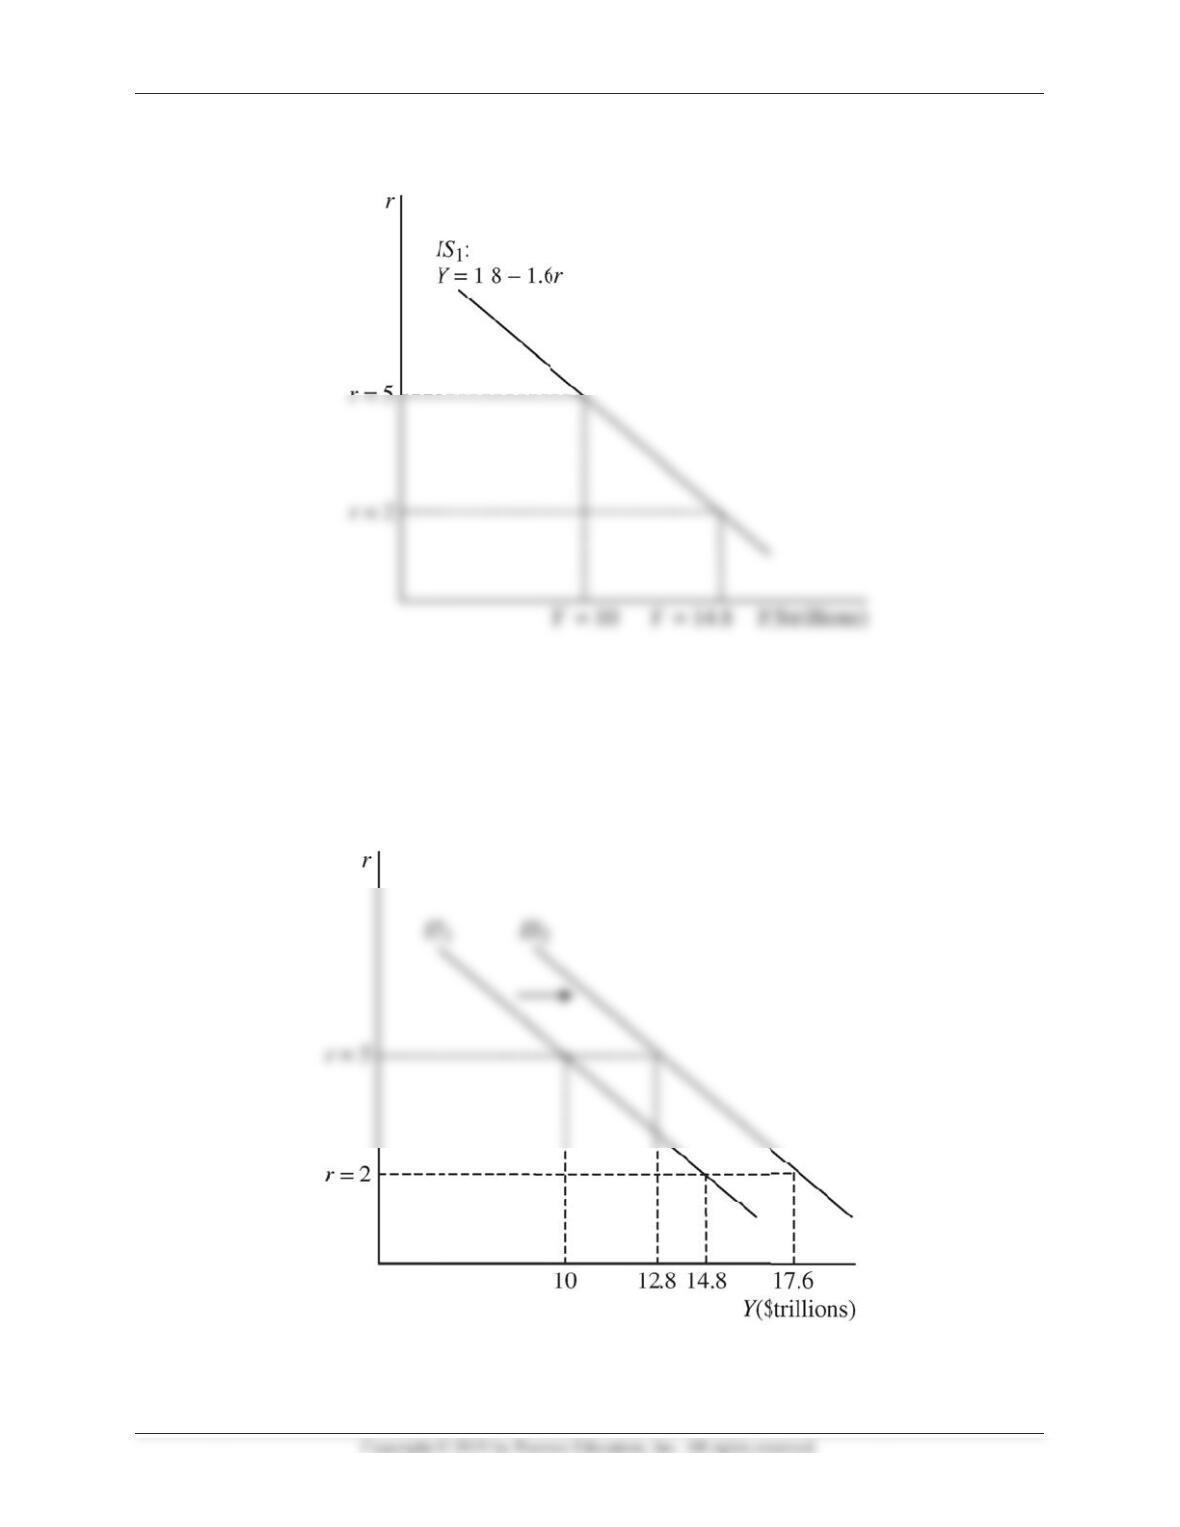
Mishkin •
d.
D
e.
If
r
go
A
t
r
s
h
I
nstructor’s Ma
n
D
raw a grap
h
f
governmen
t
= 2? What
o
vernment
p
A
n increase
o
r
illion incre
a
h
ift horizon
t
n
ual for The Ec
o
h
of the IS c
u
t
purchases
i
will happen
p
urchases in
y
o
f gove
r
nme
a
se in equili
b
t
ally to the r
i
o
nomics of Mon
e
u
rve showin
g
i
ncrease to
$
to equilibri
u
y
our graph
f
nt spending
b
rium outpu
t
i
ght by $2.8
e
y, Banking, an
d
g
the answer
s
$
4.2 trillion,
u
m output at
f
rom part (d
)
of $0.7 trill
i
t
at any give
trillion.
d
Financial Mar
k
s
from part
(
what will h
a
r = 5? Sho
w
)
.
i
on will lea
d
e
n interest r
a
k
ets, Twelfth E
d
(
c) above.
a
ppen to equ
w
the effect
o
d
to an 0.7/(
1
a
te. Thus, th
e
d
ition
ilibrium out
p
o
f the increa
s
1
– 0.75) =
$
e
IS curve
w
226
p
ut at
s
e in
$
2.8
w
ill
25. Consider an economy described by the following data:
ܥ
ഥ = $3.25 trillion
ܫ
ҧ
= $1.3 trillion
a. Derive an expression for the IS curve.
b. Assume that the Federal Reserve controls the interest rate and sets the interest rate at r =
4. What is the equilibrium level of output?
c. Suppose that a financial crisis begins, and ݂
ഥ increases to ݂
ഥ = 3. What will happen to
equilibrium output? If the Federal Reserve can set the interest rate, then at what level
should the interest rate be set to keep output from changing?
The IS curve is now Y = 30.25 – 2.5r; at an interest rate of 4, equilibrium output is now Y =
20.25. In order to maintain the output level from part (b), the Federal Reserve would have
d. Suppose the financial crisis causes ݂
ഥto increase as indicated in part (c) and also causes
planned autonomous investment to decrease to ܫҧ = $1.1 trillion. Will the change in the
interest rate implemented by the Federal Reserve in part (c) be effective in stabilizing
output? If not, what additional monetary or fiscal policy changes could be implemented
to stabilize output at the original equilibrium output level given in part (b)?
With the increase in
f
and the reduction in ,
I
the IS curve is now Y = 28.25 – 2.5r. At
the current interest rate of r = 1.9, output is Y = 28.25 – 2.5(1.9) = $23.5 trillion, which is
Mishkin • Instructor’s Manual for The Economics of Money, Banking, and Financial Markets, Twelfth Edition 228
ANSWERS TO DATA ANALYSIS PROBLEMS
1. Go to the St. Louis Federal Reserve FRED database and find data on Personal Consumption
Expenditures (PCEC), Personal Consumption Expenditures: Durable Goods (PCDG),
Personal Consumption Expenditures: Nondurable Goods (PCND), and Personal
Consumption Expenditures: Services (PCESV).
a. Using the most recent data: What percentage of total household expenditures is devoted
to the consumption of goods (both durable and nondurable goods)?
For 2017:Q1, total personal consumption expenditures are $13,191.6 billion, nondurable
consumption is $2787.6 billion, and durables consumption is $1443.2 billion. Thus,
b. Given these data, which specific component of household expenditures would be most
impacted by a reduction in overall household spending? Explain.
Since services are a much larger fraction of consumption than either nondurables or
durable consumption, it would be reasonable to conclude decline in household spending
2. Go to the St. Louis Federal Reserve FRED database and find data on Real Private Domestic
Investment (GPDIC1), a measure of the real interest rate; the 10-year Treasury Inflation-
Indexed Security, TIIS (FII10); and the spread between Baa corporate bonds and the 10-year
U.S. treasury (BAA10YM), a measure of financial frictions. For (FII10) and (BAA10YM),
convert the frequency setting to “quarterly,” and download the data into a spreadsheet. For
each quarter, add the (FII10) and (BAA10YM)series to create ri, the real interest rate for
investments for that quarter. Then calculate the change in both investment and ri as the
change in each variable from the previous quarter.
a. For the eight most recent quarters of data available, calculate the change in investment
from the previous quarter, and then calculate the average change over the eight most
recent quarters.
b. Assume there is a one-quarter lag between movements in ri and changes in investment; in
other words, if ri changes in the current quarter, it will affect investment in the next
quarter. For the eight most recent lagged quarters of data available, calculate the one-
quarter-lagged average change in ri.
From 2015:Q1 to 2016:Q4, the average change in ri was –0.01.
Mishkin • Instructor’s Manual for The Economics of Money, Banking, and Financial Markets, Twelfth Edition 229
c. Take the ratio of your answer from part (a) divided by your answer from part (b). What
does this value represent? Briefly explain.
The ratio of the changes is –1.05/–0.01 = 120; the absolute value of this represents the
d. Repeat parts (a) through (c) for the period 2008:Q3 to 2009:Q2. How do financial
frictions help explain the behavior of investment during the financial crisis? How do the
coefficients on investment compare between the current period and the financial crisis
period? Briefly explain.
From 2008:Q3 to 2009:Q2, the average change in investment was –$163.0 (billion), and
from 2008:Q2 to 2009:Q1, the average change in ri was 0.72. The coefficient on