CHAPTER 2
(MACRO CHAPTER 2; MICRO CHAPTER 2)
Scarcity and Opportunity Costs
FUNDAMENTAL QUESTIONS
1. What are opportunity costs?
OVERVIEW AND OBJECTIVES
The unique features of this chapter include the illustration of opportunity costs with an example
students can readily understand—college tuition and the tradeoff between attending college and
working. The chapter also uses the idea of relative opportunity costs among countries to motivate the
discussion of comparative advantage, specialization, and trade.
After reading and reviewing this chapter, the student should be able to:
1. Define opportunity costs.
KEY TERM REVIEW
capital
comparative advantage
financial capital
Chapter 2: Scarcity and Opportunity Costs 7
trade-off
LECTURE OUTLINE AND TEACHING STRATEGIES
I. Scarcity, Opportunity Costs, and Voluntary Trade
Scarcity means that there is not enough of an item to satisfy everyone who wants it.
Teaching Strategy: Try to show scarcity by starting the lecture with an example from everyday
life, for example, buying food in a supermarket with limited funds or deciding whether to spend
$15 on a DVD or on popcorn and a movie.
Teaching Strategy: Ask your students to compare the costs and benefits of attending class.
Point out to them that, since they are in class, the benefits of attending class must have
outweighed the costs.
C. The production possibilities curve: The production possibilities curve describes the nature of
social choices between alternatives. It shows the maximum quantity of goods and services
that can be produced when the existing resources are used fully and efficiently.
II. Output and Resources
Societies, like individuals, face scarcity and must make choices.
A. Resources and income: The ingredients of goods are called resources, or factors of
production, or inputs. The three broad categories of resources are land, labor, and capital.
Land includes all natural resources, such as minerals, timber, and water, as well as the land
8 Chapter 2: Scarcity and Opportunity Costs
B. The value of resources: People earn income based on the value of the resources they own.
Payment for land is called rent. Payment for labor is called wages. Payment for capital is
called interest. The greater the value of resources, the more income the owners earn for
those resources.
III. Voluntary Trade and Exchange
Specialization affects the shape of the PPC curve.
A. Gains from trade: People engage in trade because they benefit from it. Comparative
B. Specialize where opportunity costs are lowest: Scarce resources must be allocated where
they can best perform the job. Trade occurs because everyone will find that it is mutually
beneficial to specialize in goods in which they have a comparative advantage and trade for
track of. Work through an example and give them one to do on their own.
IV. Allocation Systems
An allocation system is a process of determining who gets the goods and services and who does
not. Examples are government-determined, first-come, first served, lottery, and market systems.
A. Fairness: None of the systems is fair in the sense that no one gets left out.
B. Incentives: The incentives each allocation system creates is a fundamental reason that
OPPORTUNITIES FOR DISCUSSION
1. Discuss the opportunity cost of Tiger Woods, George Clooney, or another major sports or
entertainment figure. Why do you think these people are paid more than school teachers or
daycare workers?
Chapter 2: Scarcity and Opportunity Costs 9
ANSWERS TO EXERCISES
1. The concept ignored is opportunity costs. If the society is operating along a PPC, then it is
impossible to have increases in all goods and services. It is impossible to have more and better
health, education, infrastructure, and other things without giving up something else.
10. 1/3 corn
11. 1/2 corn
10 Chapter 2: Scarcity and Opportunity Costs
ACTIVE LEARNING EXERCISE
This exercise offers students the opportunity to explore the concept of comparative advantage as well
as the chance to review the construction of a production possibilities curve.
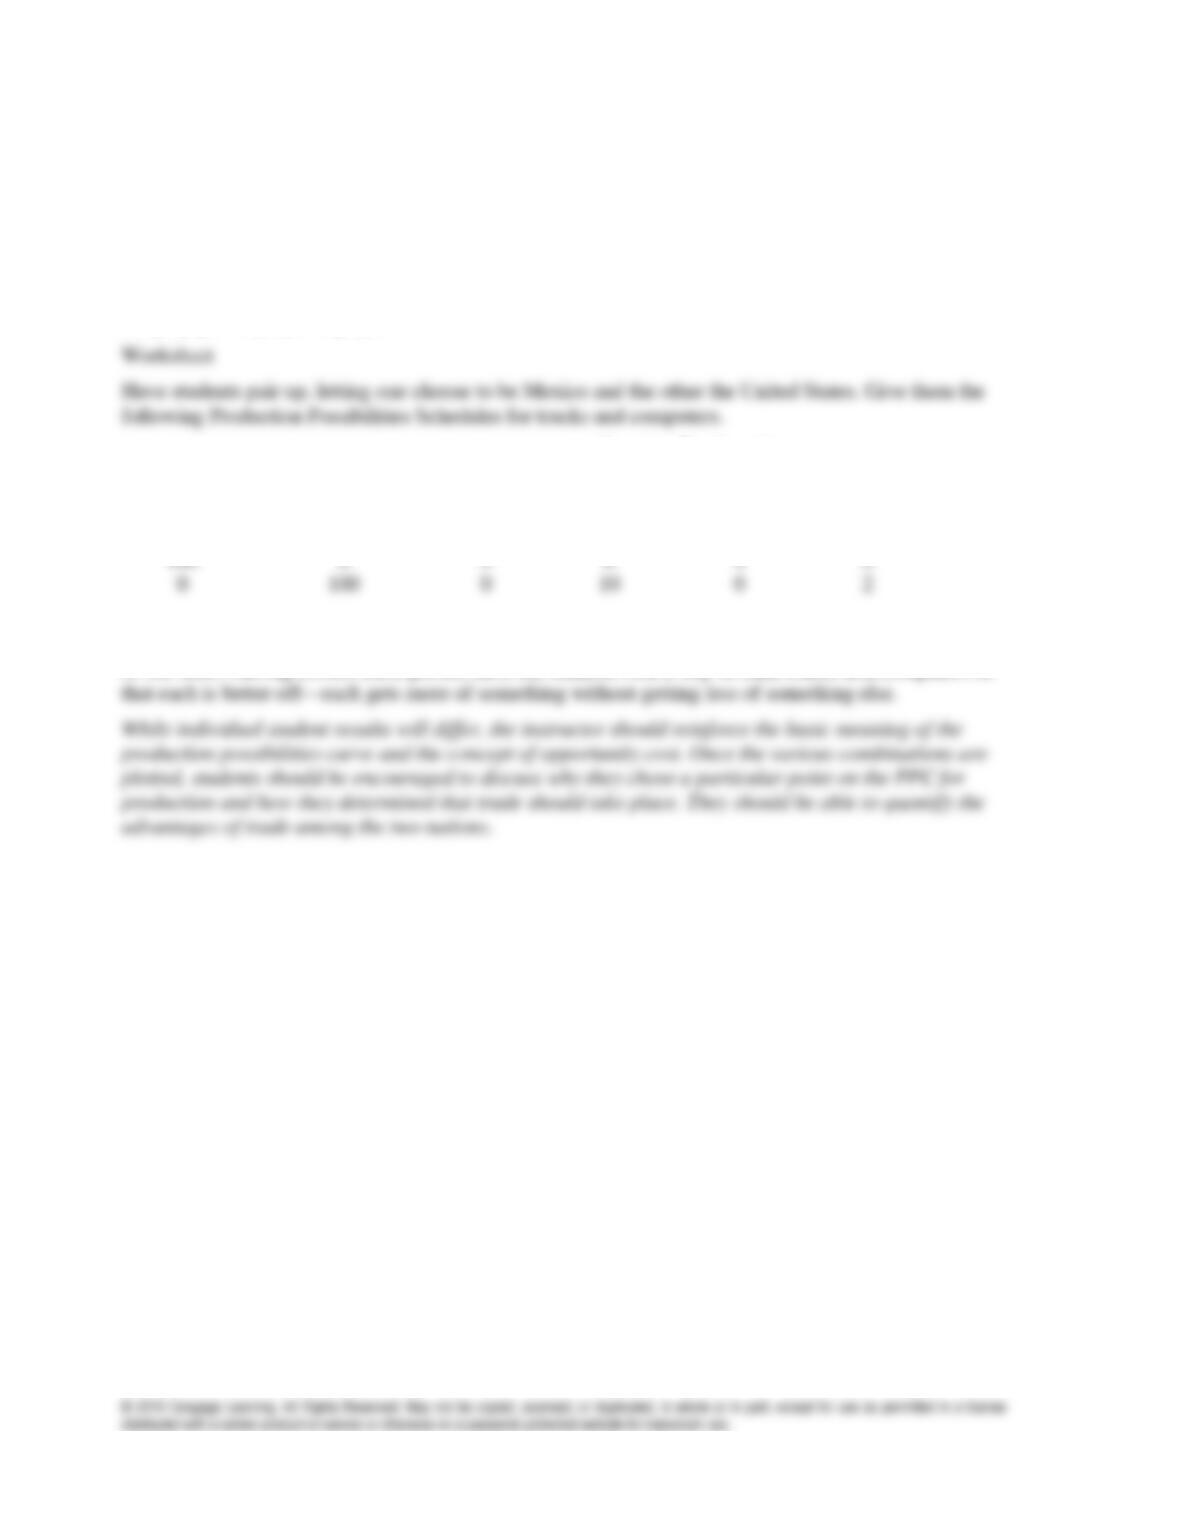
Materials Needed
Graph paper or prepared graphs for each student
Percentage of Resources Devoted
to:
Number Produced:
United States
Mexico
Trucks
Computers
Trucks
Computers
Trucks
Computers
Have the students draw their PPCs. Then ask each student to pick a point along his or her curve that he
or she likes. Having chosen these points, have the students find a way to trade trucks and computers so