Chapter 2
The Measurement and Structure
of the National Economy
◼ Learning Objectives
I. Section Goals
A. Differentiate among the three approaches to national income accounting (Sec. 2.1)
B. Explain how GDP is measured (Sec. 2.2)
II. Notes to Eighth Edition Users
A. In Sec. 2.3, we added a time-series graph showing the uses-of-savings identity: private saving,
gross private domestic investment, the government budget deficit, and the current account
Chapter 2 The Measurement and Structure of the National Economy 15
◼ Teaching Notes
I. National Income Accounting: The Measurement of Production, Income, and Expenditure
(Sec. 2.1)
A. National income accounts: an accounting framework used in measuring current economic
activity
B. Three alternative approaches give the same measurements
1. Product approach: the amount of output produced
C. Juice business example shows that all three approaches are equal
1. Important concept in product approach: value added = value of output minus value of inputs
purchased from other producers
D. Why are the three approaches equivalent?
1. They must be, by definition
II. Gross Domestic Product (Sec. 2.2)
A. The product approach to measuring GDP
1. GDP (gross domestic product) is the market value of final goods and services newly
produced within a nation during a fixed period of time
Data Application
The period referred to here is either a quarter or a year. You may want to show students what
2. Market value: allows adding together unlike items by valuing them at their market prices
a. Problem: misses nonmarket items such as homemaking, the value of environmental
quality, and natural resource depletion
Analytical Problems 1 and 3 both discuss difficulties in counting nonmarket items for GDP,
including the important idea that GDP is not the same as welfare.
16 Abel/Bernanke/Croushore • Macroeconomics, Ninth Edition
a. Don’t count intermediate goods and services (those used up in the production of other
goods and services in the same period that they themselves were produced)
5. GNP vs. GDP
a. GNP (gross national product) = output produced by domestically owned factors
of production
GDP = output produced within a nation
Data Application
Prior to December 1991, the United States used GNP as its main measure of production; after that
time GDP became the main concept. The main reasons for the switch were that GDP is more
relevant to production in an open economy (though GNP is more relevant for income), and GDP
is more precise than GNP in the advance estimate, since net factor payments are difficult to
measure quickly. See Survey of Current Business, November 1991, for a discussion of the switch.
d. Example: Engineering revenues for a road built by a U.S. company in Saudi Arabia is
Data Application
The timeline for national income and product account releases is generally:
Advance estimate Last week of month following end of quarter
Chapter 2 The Measurement and Structure of the National Economy 17
B. The expenditure approach to measuring GDP
1. Measures total spending on final goods and services produced within a nation during a
specified period of time
2. Four main categories of spending: consumption (C), investment (I), government purchases
Data Application
Note that the consumption category in the national income and product accounts does not
correspond to economists’ concept of consumption, because it includes the full value of durable
5. Investment: spending for new capital goods (fixed investment) plus inventory investment
a. Volatile, with fixed investment about 13% to 20% of U.S. GDP
b. Business (or nonresidential) fixed investment: spending by businesses on structures,
Data Application
A major change in the national income and product accounts came in October 1999, when
computer software purchased by businesses and government was classified as investment, rather
6. Government purchases of goods and services: spending by the government on goods or
services
a. About 1/5 of U.S. GDP
b. Most by state and local governments, not federal government
18 Abel/Bernanke/Croushore • Macroeconomics, Ninth Edition
d. Some government spending is for capital goods that add to the nation’s capital stock, such
as highways, airports, bridges, and water and sewer systems
Data Application
People often don’t realize how large transfer programs are relative to federal government
consumption expenditures. For example, in 2011, transfer payments were $2,309 billion,
7. Net exports: exports minus imports
a. Exports: goods produced in the country that are purchased by foreigners
Data Application
Behind the scenes at the Bureau of Economic Analysis (BEA), a major change took place in the
2000s concerning the national income accounts and the data on GDP. Because the types of goods
and services people buy has changed so much in recent years, the BEA decided to modify how it
categorizes industries when it collects data on production. The new system is known as NAICS:
the North American Industry Classification System; it replaces a system called SIC: Standard
Chapter 2 The Measurement and Structure of the National Economy 19
C. The income approach to measuring GDP
1. Adds up income generated by production (including profits and taxes paid to the
government)
a. National income = compensation of employees (including benefits) + proprietors’
Data Application
Note that the definition of income was changed in several ways in 2003. Several categories were
broken down in more detail, indirect business taxes were included in the larger category of taxes
b. National income + statistical discrepancy = net national product
c. Net national product + depreciation (the value of capital that wears out in the period) =
gross national product (GNP)
d. GNP − net factor payments (NFP) = GDP
Numerical Problems 1, 2, 3, 4, and 5 provide practice in working with the national income and
product accounts.
III. Saving and Wealth (Sec. 2.3)
A. Wealth
1. Household wealth = a household’s assets minus its liabilities
B. Measures of aggregate saving
1. Saving = current income − current spending
20 Abel/Bernanke/Croushore • Macroeconomics, Ninth Edition
5. National saving
a. National saving = private saving + government saving
C. The uses of private saving
1. S = I + (NX + NFP) (2.9)
S = I + CA (2.10)
Derived from S = Y + NFP − C − G and Y = C + I + G + NX
CA = NX + NFP = current account balance
3. Text Fig. 2.2: shows uses-of-savings identity
a. Private saving, gross private domestic investment, government budget deficit, and
current account balance, each as a percentage of GDP
b. Since early 1990s, current account balance has been negative
Chapter 2 The Measurement and Structure of the National Economy 21
D. Relating saving and wealth
1. Stocks and flows
2. Wealth and saving as stock and flow (wealth is a stock, saving is a flow)
3. National wealth: domestic physical assets + net foreign assets
a. Country’s domestic physical assets (capital goods and land)
b. Country’s net foreign assets = foreign assets (foreign stocks, bonds, and capital goods
IV. Real GDP, Price Indexes, and Inflation (Sec. 2.4)
A. Real GDP
1. Nominal variables are those in dollar terms
2. Problem: do changes in nominal values reflect changes in prices or quantities?
Data Application
The first time that the national income and product accounts reported real GNP was in February
1959; prior to that time, inflation was usually so low that nominal GNP was all that it was thought
B. Price Indexes
1. A price index measures the average level of prices for some specified set of goods and
services, relative to the prices in a specified base year
22 Abel/Bernanke/Croushore • Macroeconomics, Ninth Edition
Data Application
There are two price indexes available for consumption expenditures: the price index for personal
3. Note that base year P = 100
4. Consumer Price Index (CPI)
a. Monthly index of consumer prices; index averages 100 in reference base period
Data Application
Calculating chain-weighted indexes is not too hard and you can use the computer-bicycle
example in Table 2.4 in the textbook to illustrate how to do so. Define the Laspeyres quantity
index (using year 1 prices) for year 1 as the value of year 1 output at year 1 prices: L1 = $46,000;
6. Inflation
7. Does CPI inflation overstate increases in the cost of living?
Chapter 2 The Measurement and Structure of the National Economy 23
Data Application
A symposium on the CPI appeared in the Journal of Economic Perspectives 12 (Winter 1998).
Many different aspects of measurement problems were explored. Although the BLS claims that
d. If inflation is overstated, then real incomes are higher than we thought and we have
overindexed payments like Social Security
e. Latest research (July 2006) suggests bias is still 1% per year or higher
C. Application: The Fed’s preferred inflation measures
1. The Federal Reserve focuses its attention on the personal consumption expenditures (PCE)
price index
6. The inflation rate in the overall PCE price index tends to revert to the core measure after a
period when the two measures deviate (text Fig. 2.4)
Data Application
There are many problems with price indexes; they are imperfect measures of price changes.
What do the indexes do when new goods are introduced? What happens as more efficient stores
replace stores that had higher intermediate costs? How do we account for the fact that people
Numerical Problems 7 and 9 give practice in calculating inflation rates.
24 Abel/Bernanke/Croushore • Macroeconomics, Ninth Edition
V. Interest Rates (Sec. 2.5)
A. Real vs. nominal interest rates
1. Interest rate: a rate of return promised by a borrower to a lender
Numerical Problem 8 provides practice in calculating real interest rates.
Chapter 2 The Measurement and Structure of the National Economy 25
◼ Additional Issues for Classroom Discussion
1. Welfare Does Not Equal GDP
You can get students involved in a useful discussion of how our national-income accounts fail to measure
our well-being. GDP covers only market activity. Ask your students to come up with some nonmarket
2. More Implications of Price Mismeasurement
Ask your students to explore the ramifications of the bias in the CPI and other price measures. If the CPI
has been overstated by one percentage point per year over the past decade, how much lower should Social
Security payments be? If you see data that say the real wage has barely grown over the past decade, where
real wage growth is measured by taking nominal wage growth and subtracting off the rate of inflation, what
does that imply about how fast real wages have truly grown? Some of the same biases to the price index
3. Should the CPI Measure Changes in Prices or Changes in the Cost of Living?
The Boskin Commission on the bias in the CPI raised a point that economists have known about for some
time. The economic concept that we’d like our price measures to capture is changes in the cost of living,
but our price indexes are set up to measure the change in average prices. The difference is subtle, yet
26 Abel/Bernanke/Croushore • Macroeconomics, Ninth Edition
◼ Answers to Textbook Problems
Review Questions
1. The three approaches to national income accounting are the product approach, the income approach,
and the expenditure approach. They all give the same answer because they are designed that way; any
2. Goods are measured at market value in GDP accounting so that different types of goods and services
can be added together. Using market prices allows us to count up the total dollar value of all the
3. Intermediate goods and services are used up in producing other goods in the same period (year) in
which they were produced, while final goods and services are those that are purchased by consumers
4. GNP is the market value of final goods and services newly produced by domestic factors of production
during the current period, whereas GDP is production taking place within a country. Thus, GNP
5. The four components of spending are consumption, investment, government purchases, and net exports.
Imports must be subtracted, because they are produced abroad and we want GDP to count only those
6. Private saving is private disposable income minus consumption. Private disposable income is total
7. National wealth is the total wealth of the residents of a country, and consists of its domestic physical
8. Real GDP is the useful concept for figuring out a country’s growth performance. Nominal GDP may
Chapter 2 The Measurement and Structure of the National Economy 27
9. The CPI is a price index that is calculated as the value of a fixed set of consumer goods and services
at current prices divided by the value of the fixed set at base-year prices. CPI inflation is the growth
10. The nominal interest rate is the rate at which the nominal (or dollar) value of an asset increases over
time. The real interest rate is the rate at which the real value or purchasing power of an asset increases
28 Abel/Bernanke/Croushore • Macroeconomics, Ninth Edition
Numerical Problems
1. GDP is the value of all final goods and services produced during the year. The final output of coconuts
is 1000, which is worth 500 fish, because two coconuts are worth one fish. The final output of fish is
500 fish. So in terms of fish, GDP consists of 500 fish worth of coconuts plus 500 fish, with a total
value of 1000 fish.
To find consumption and investment, we must find out what happens to all the coconuts and fish.
2. (a) Furniture made in North Carolina that is bought by consumers counts as consumption,
so consumption increases by $6 billion, investment is unchanged, government purchases are
unchanged, net exports are unchanged, and GDP increases by $6 billion.
3. (a) ABC produces output valued at $2 million and has total expenses of $1.3 million ($1 million for
labor, $0.1 million interest, $0.2 million taxes). So its profits are $0.7 million. XYZ produces
output valued at $3.8 million ($3 million for the three computers that were sold, plus $0.8 million
Chapter 2 The Measurement and Structure of the National Economy 29
The income approach yields the same GDP total contribution. The amounts are:
ABC
XYZ
TOTAL
Labor
$1.0 million
$0.8 million
$1.8 million
Taxes
$0.2 million
$0.4 million
$0.6 million
$0.1 million
(b) If ABC pays an additional $.5 million for computer chips from abroad, the results change
slightly. The correct answer is easiest to see using the expenditure approach. As in part a, there is
$3.8 million spent on final goods, but now there are also net exports of −$0.5 million. So the total
expenditure on domestically produced goods is only $3.3 million. The product approach gets the
4. (a) Product approach: $2 = gas station’s value added = $28 product minus $26 value of product
produced in the previous year. Expenditure approach: $2 = $28 consumption spending plus
inventory investment of −$26. Income approach: $2 paid to the factors of production at the gas
station (wages of employees, interest, taxes, profits).
(b) Product approach: $60,000 broker’s fee for providing brokerage services. Expenditure approach:
$56,000 ($40,000 compensation of homemaker plus $16,000 income to the factors producing
the child care: employees’ wages, interest, taxes, profits).
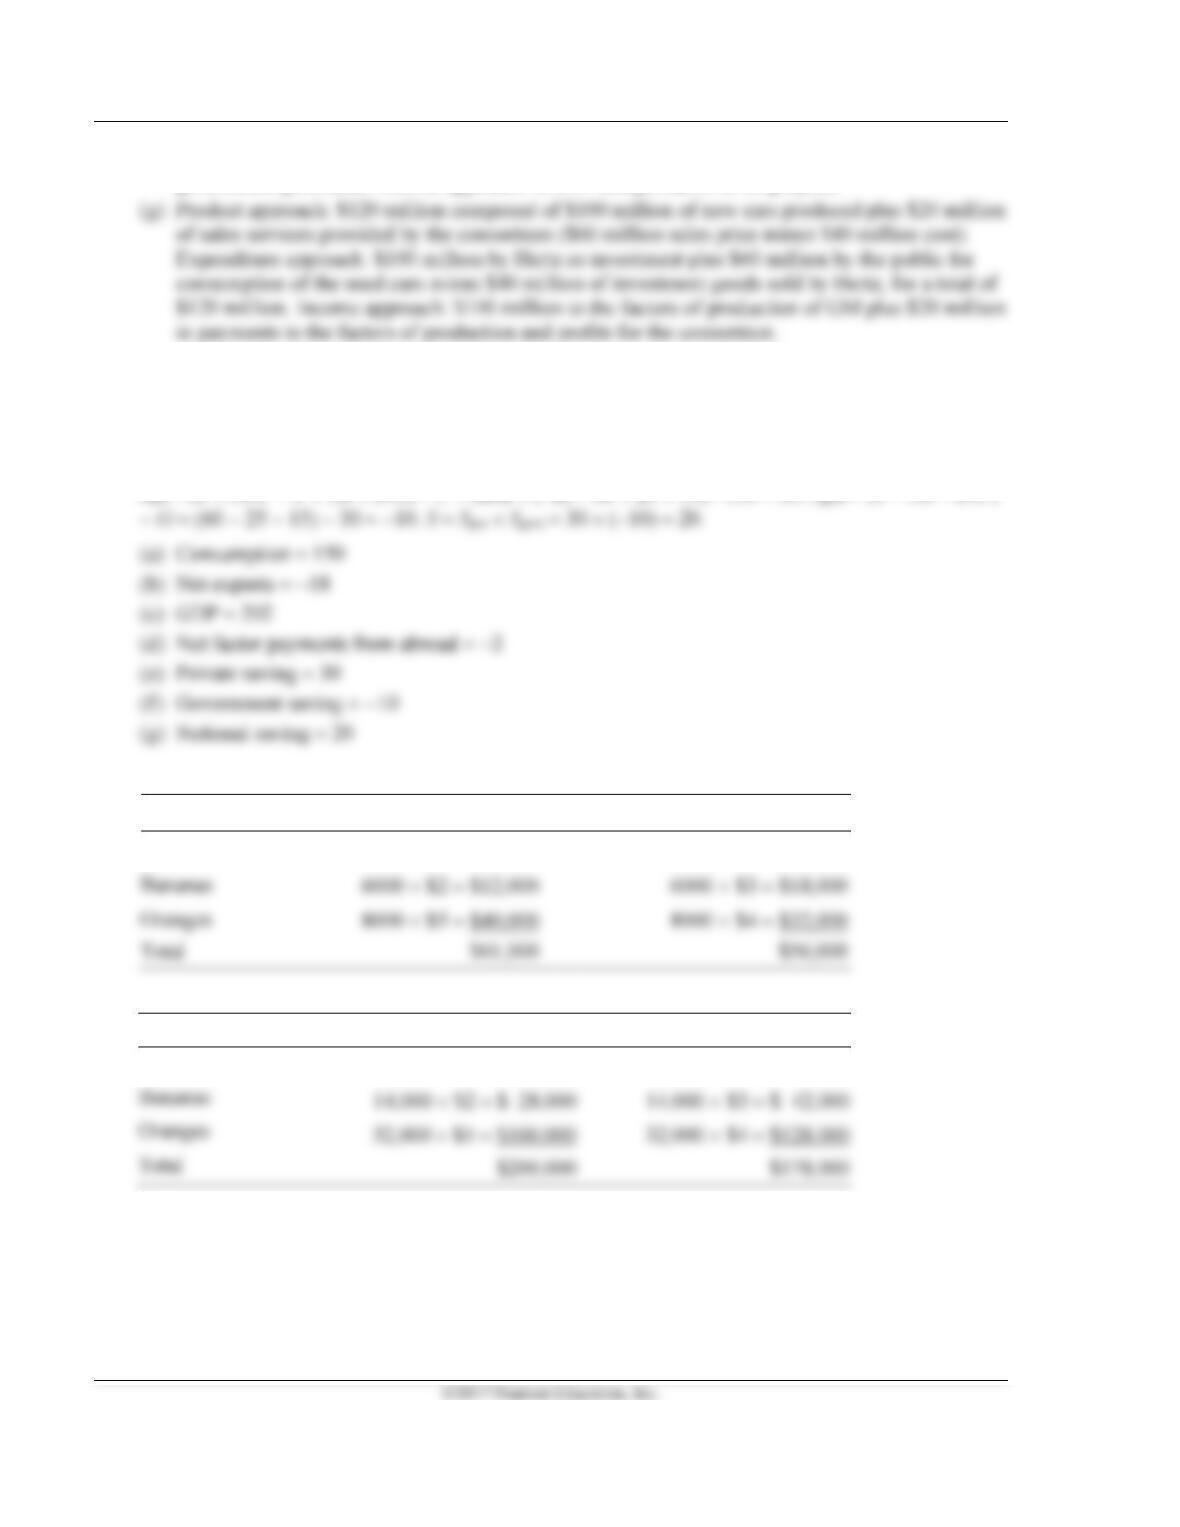
(d) Product approach: $100 million of a capital good. Since it is produced with local labor and
materials, and assuming no payments go to Japanese factors of production, this is all added
to U.S. GDP. Expenditure approach: $100 million net exports, since the plant is owned by the
30 Abel/Bernanke/Croushore • Macroeconomics, Ninth Edition
(f) Product approach: $5,000 worth of advertising services. Expenditure approach: $5,000 of
government purchases. Income approach: $5,000 compensation of employees.
5. Given data: I = 40, G = 30, GNP = 200, CA = −20 = NX + NFP, T = 60, TR = 25, INT = 15, NFP =
7 − 9 = −2. Since GDP = GNP − NFP, GDP = 200 − (−2) = 202 = Y. Since NX + NFP = CA, NX =
CA − NFP = −20 − (−2) = −18. Since Y = C + I + G + NX, C = Y − (I + G + NX) = 202 − (40 + 30 +
(−18)) = 150.
Spvt = (Y + NFP − T + TR + INT) − C = (202 + (−2) − 60 + 25 + 15) −150 = 30. Sgovt = (T − TR − INT)
6.
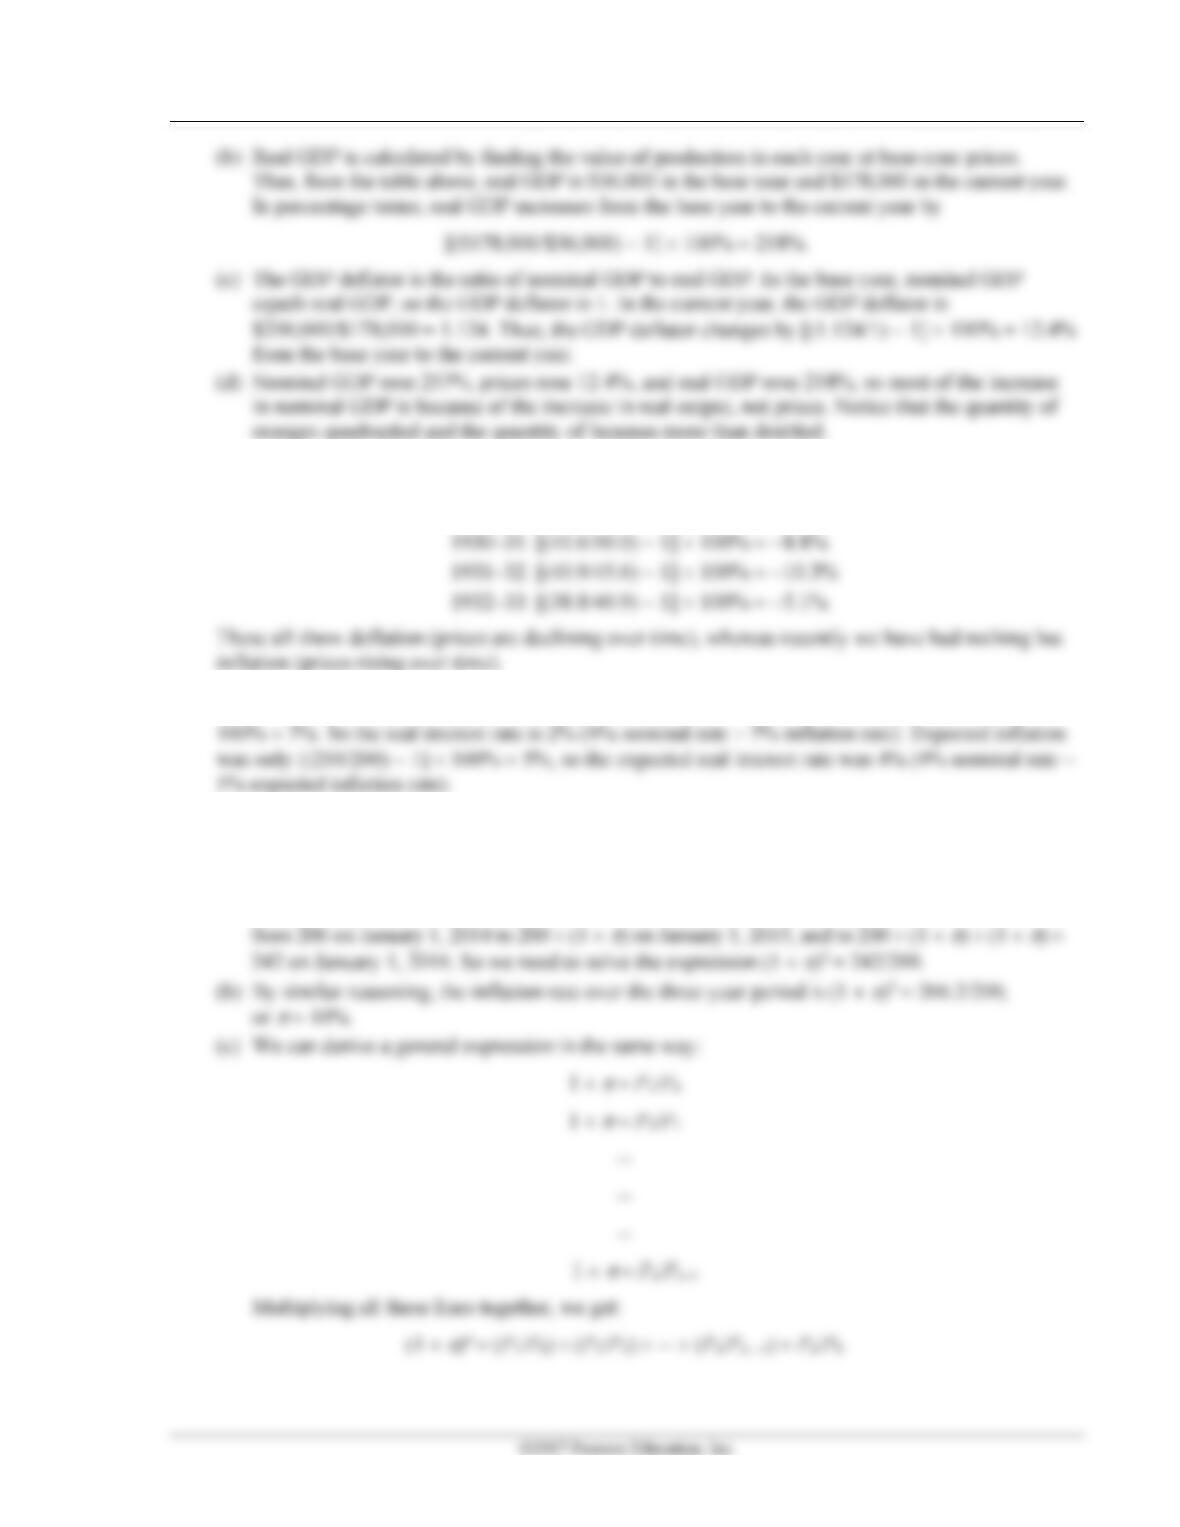
Base-Year Quantities at Current-Year Prices
At Base-Year Prices
Apples
3000 $3 = $ 9,000
3000 $2 = $ 6,000
Current-Year Quantities at Current-Year Prices
At Base-Year Prices
Apples
4,000 $3 = $ 12,000
4,000 $2 = $ 8,000
Bananas
Oranges
(a) Nominal GDP is just the dollar value of production in a year at prices in that year. Nominal GDP
is $56 thousand in the base year and $200 thousand in the current year. Nominal GDP grew
257% between the base year and the current year: [($200,000/$56,000) − 1] 100% = 257%.
Chapter 2 The Measurement and Structure of the National Economy 31
7. Calculating inflation rates:
1929–30: [(50.0/51.3) − 1] 100% = −2.5%
8. The nominal interest rate is [(545/500) − 1] 100% = 9%. The inflation rate is [(214/200) − 1]
9. (a) The annual rate of inflation from January 1, 2014 to January 1, 2016, is 10%. This can be found
by calculating the constant rate of inflation that would raise the deflator from 200 to 242 in two
years. This gives the equation (1 +
)(1 +
) = (242/200), which has the solution
= 10%.
An easy way to think about this question is this. A constant inflation rate of
raises the deflator
32 Abel/Bernanke/Croushore • Macroeconomics, Ninth Edition
Analytical Problems
1. The key to this question is that real GDP is not the same thing as well-being. People may be better off
even if real GDP is lower; for example, this may occur because the improvement in the health of
2. National saving does not rise because of the switch to CheapCall because although consumption
3. (a) The problem in a planned economy is that prices do not measure market value. When the price
of an item is too low, then goods are really more expensive than their listed price suggests—we
should include in their market value the value of time spent by consumers waiting to make
purchases. Because the item’s value exceeds its cost, measured GDP is too low.
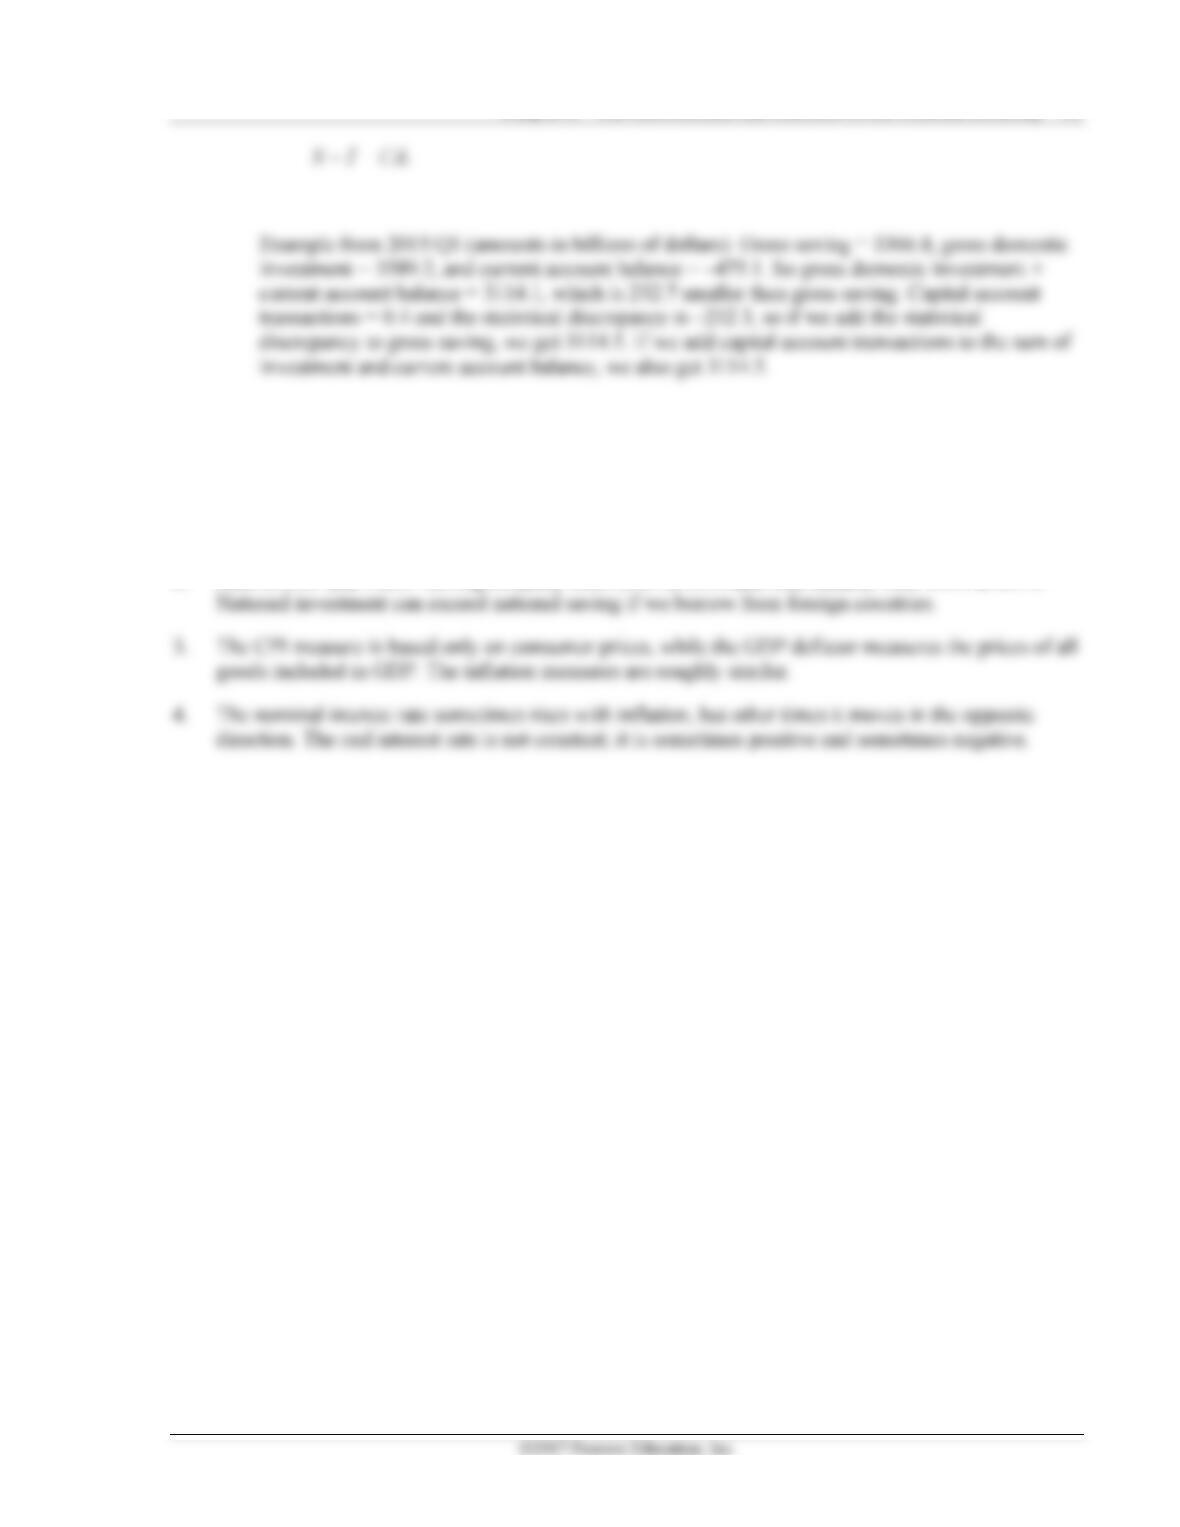
4. From Eq. (2.3), and using GPDI for gross private domestic investment,
Y = C + GPDI + (GCE + GI) + NX.
From Eq. (2.6), Spvt = Y + NFP – T + TR + INT – C.
Substituting Eq. (2.3) into (2.6) to eliminate Y, we get
Chapter 2 The Measurement and Structure of the National Economy 33
Working with Macroeconomic Data
1. Consumption generally increased as a percentage of GDP from 1965 to 2014. I/GDP is more volatile
than C/GDP. G/GDP generally decreased from 1960 to 2014. X/GDP and M/GDP generally
increased from 1960 to 2014.
2. Both S/GDP and I/GDP fell significantly from 2005 to 2010 and rose steadily from 2010 to 2014.