CHAPTER 2: THE MEASUREMENT AND STRUCTURE OF THE
CANADIAN ECONOMY
LEARNING OBJECTIVES
I. Goals of Chapter 2
A. National income accounts; relationships between key macroeconomic
variables (Sec. 2.1)
B. Gross domestic product—the main measure of output (Sec. 2.2)
C. Saving and wealth—private and government (Sec. 2.3)
TEACHING NOTES
I. National Income Accounting: The Measurement of Production, Income, and
Expenditure (Sec. 2.1)
A. Three alternative approaches give the same measurements
1. Product approach: the amount of output produced
B. Juice business example shows that all three approaches are equal
1. Important concept in product approach: value added = value of output
minus value of intermediate inputs
C. Why are the three approaches equivalent?
1. They must be, by definition
2. Any output produced (product approach) is purchased by someone
(expenditure approach) and results in income to someone (income
approach)
II. Gross Domestic Product (Sec. 2.2)
A. The product approach to measuring GDP
1. GDP is the market value of final goods and services newly produced
within a national boundary during a fixed period of time
12 Chapter 2
Data Application
The period referred to here is either a quarter or a year. You may want to show your
2. Market value: allows adding together unlike items by valuing them at
their market prices
a. Problem: misses nonmarket items such as homemaking, the
value of environmental quality, and natural resource depletion
Analytical Problems 1 and 4 both discuss difficulties in counting
4. Final goods and services
a. Don’t count intermediate goods and services
b. Capital goods (goods used to produce other goods) are final
goods since they aren’t used up in the same period that they are
Data Application
People are often surprised to see how large inventory swings may be from quarter to
quarter. For example, in the last quarter of 1990 real inventories fell by over $3.6 billion
(1986 dollars), around half the total decline in real GDP of about $7 billion in that
recession quarter.
d. Adding up value works well, since it automatically excludes
intermediate goods
The Measurement and Structure of the Canadian Economy 13
Analytical Problem 2 has students see the relationship between GDP and GNP.
Data Application
While the use of GDP as a measure of production has been conventional in Canada
and Europe, prior to December 1991, the United States used GNP as its main measure
d. Example: Engineering revenues for a road built by a Canadian
company in Saudi Arabia is part of Canadian GNP (built by a
Canadian factor of production), not Canadian GDP, and is part
6. A Closer Look 2.2: Natural resources, the environment, and the
national income accounts
(a) A good deal of Canada’s economic well-being is due to its
substantial stocks of natural resources
Data Application
The timeline for national income and product amount releases is generally:
Advance release Last week of month following end of quarter
B. The expenditure approach to measuring GDP
1. Measures total spending on final goods and services produced within a
nation during a specified period of time
2. Four main categories of spending: consumption (C), investment (I),
14 Chapter 2
4. Consumption: spending by domestic households on final goods and
services (including those produced abroad)
a. About 60% of Canadian GDP
b. Four categories
(1) Consumer durables (examples: cars, TV sets, furniture,
Data Application
Note that the consumption category in the national income and expenditure accounts
does not correspond to economists’ concept of consumption, because it includes the full
c. Residential fixed investment: spending on the construction of
houses and apartment buildings
d. Machinery and equipment investment: spending on machines,
tools and vehicles
6. Government purchases of goods and services: spending by the
government on goods or services
a. About 1/5 of Canadian GDP
Data Application
People often don’t realize how large transfer programs are relative to federal
government purchases.
The Measurement and Structure of the Canadian Economy 15
7. Net exports: exports minus imports
a. Exports: goods produced in the country that are purchased by
foreigners
C. The income approach to measuring GDP
1. Adds up income generated by production (including profits and taxes
paid to the government)
a. Net National income = labour income + corporate profits +
interest and investment income + unincorporated business
2. Private sector and government sector income
a. Private disposable income = income of the private sector =
private sector income earned at home (Y or GDP) and abroad
(NFP) + payments from the government sector (transfers TR,
Numerical Problems 1,2, 3, and 4 give practice in working with the national income and
product accounts.
III. Saving and Wealth (Sec. 2.3)
A. Wealth
1. Household wealth = a household’s assets minus its liabilities
2. National wealth = sum of all households’, firms’, and governments’
wealth within the nation
16 Chapter 2
d. Government budget deficit = –Sgovt
5. National saving
a. National saving = private saving + government saving
b. S = Spvt + Sgovt
= [Y + NFP – T+ TR + INT – C] + [T – TR – INT – G]
= Y + NFP – C – G = GNP – C – G (2.8)
C. The uses of private saving
D. Application: Uses of savings and the government budget deficit in Canada
1. Text Fig. 2.1 illustrates the uses-of-saving identity for Canada, plotting
private saving, investment, the government deficit, and the current
account balance for Canada from 1961 to 2009
E. Relating saving and wealth
1. Stocks and flows
a. Flow variables: measured per unit of time (GDP, income,
flow)
3. National wealth
a. Country’s domestic physical assets (capital goods and land)
The Measurement and Structure of the Canadian Economy 17
(1) Changes in value of existing assets and liabilities (change
(2) National saving (S = I + CA) raises wealth
IV. Real GDP, Price Indexes, and Inflation (Sec. 2.4)
A. Real GDP
1. Nominal variables (in dollar terms)
Data Application
The distinction between nominal and real GDP can be very important in practice.
Between 1981 and 1982 nominal GDP rose by 5.2%, but real GDP fell by 3.2%.
Numerical Problem 6 provides practice in calculating real and nominal GDP and price
indexes given several goods with different prices and quantities in two years.
C. Price indexes
1. GDP deflator = nominal GDP/real GDP, where real GDP is calculated
Data Application
There are two price indexes available for consumption expenditures: the implicit price
deflator’ for personal expenditures, and the consumer price index (CPI). The first is
available only quarterly, while the CPI is available monthly.
4. Note that base year P = 1 or P = 100
5. Some problems with both types of indexes
a. Variable-weight index: Current output may include goods that
6. A Closer Look 2.3: The computer data revolution and chain-weighted
GDP
(a) It is a compromise between using the current period as the base
18 Chapter 2
(b) Another problem is that CPI based on the assumption that
consumers purchase a basket of goods and services that is fixed
over time
Data Application
The fact that it is difficult to handle new goods or goods whose quality has changed
makes it especially difficult to compute price indexes. If you use a recent year as the
D. Inflation
1. Calculate inflation rate: πt+1 = (Pt+1 – Pt)/Pt = ΔPt+1/Pt
Text Fig. 2.2 shows the Canadian inflation rate for 1945–2009.
Data Application
There are many problems with price indexes; they are imperfect measures of price
changes. What do the indexes do when new goods are introduced? What happens as
V. Interest rates (Sec. 2.5)
1. Real vs. nominal interest rates
a. Real interest rate: real return to an asset
b. Nominal interest rate: nominal return to an asset
Numerical Problem 8 provides practice in calculating nominal and real interest rates.
The Measurement and Structure of the Canadian Economy 19
ADDITIONAL ISSUES FOR CLASSROOM DISCUSSION
1. How Much Do GDP Comparisons Tell Us?
National income accounting data are used to compare production and prices between
very different countries and within the same country over long periods of time. What
problems does this involve? Are there any alternatives?
Making comparisons of prices or GDP over long periods of time or from county to
country is difficult because the underlying economies vary. For example, if you compare
What other ways can we use to compare well-being that are not subject to these
problems? There are many other statistics that can give us a view of economic welfare
across different societies.
Figures on life expectancy, caloric intake, hours of work per week, energy consumption,
2. Does It Make a Difference Which Type of Price Index One Chooses?
Price indexes generally move together. As long as the basket of goods that people
consume doesn’t change too much, then fixed-weight and variable-weight price indexes
give similar measures of inflation.
Different methods of calculation usually give answers that vary by only small amounts.
20 Chapter 2
A variable-weight index (like the GDP deflator) is calculated by dividing the value of
current outl3ut at current prices by the value of current output at base-year prices. In our
example in year 2 the value of current output at current prices is 1200 x $30 = $36 000
(market value of jeans in year 2) + 4000 × $5 = $20 000 (market value of haircuts in
3. Does Greater GDP Always Mean Greater Human Welfare?
Most nations wish to improve the well-being of their populations. Although economists
often articulate the need for a steady increase in economic output, low unemployment,
and minimal inflation, people also have a variety of other goals. Students can be asked
The Measurement and Structure of the Canadian Economy 21
ANSWERS TO TEXTBOOK PROBLEMS
Review Questions
1. The three approaches to national income accounting are the product approach, the
income approach, and the expenditure approach. They all give the same answer
2. Goods are measured at market value in GDP accounting so that different types of
goods and services can be added together. Using market prices allows us to count
3. Intermediate goods and services are used up in producing other goods in the same
period (year) in which they were produced, while final goods and services are
4. The four components of spending are consumption, investment, government
purchases, and net exports. Imports must be subtracted, because they are
5. Private saving is private disposable income minus consumption. Private disposable
income is total output minus taxes paid plus transfers and interest received from
6. National wealth is the total wealth of the residents of a country, and consists of its
domestic physical assets and net foreign assets. Wealth is important because the
7. Real GDP is the useful concept of figuring out a country’s growth performance.
Increases in nominal GDP may be due simply to increase in prices rather than
growth in output.
8. The GDP deflator is a variable-weight index. It takes the value of current output at
current prices divided by the value of current output at base-year prices to arrive at
22 Chapter 2
9. The nominal interest rate is the rate at which the nominal (or dollar) value of an
asset increases over time. The real interest rate is the rate at which the real value
or purchasing power of an asset increases over time, and is equal to the nominal
Numerical Problems
1. GDP is the value of all final goods and services produced during the year. The final
output of coconuts is 1000, which is worth 500 fish, because two coconuts are
worth one fish. Of the 500 fish caught during the year, the 100 fish used as
fertilizer are an intermediate good, so the final output is 400 fish. So in terms of
fish, GDP consists of 500 fish worth of coconuts plus 400 fish, with a total value of
900 fish.
In terms of income, Gilligan’s income is clearly worth 200 fish (100 fish plus 200
coconuts worth 100 fish). The Professor’s income is less easily calculated,
because he uses 100 fish to fertilize the coconut trees. These 100 fish are
therefore not income to him. Thus the Professor’s income is 800 coconuts (1000
coconuts minus the 200 coconuts paid to Gilligan) plus 300 fish (500 fish minus
100 fish paid to Gilligan and minus 100 fish used as fertilizer). In terms of fish, the
Professor’s income is 700 fish.
2. a. Furniture made in Quebec that is bought by consumers counts as consumption,
so consumption increases by $600 million, investment is unchanged,
government purchases are unchanged, net exports are unchanged, and GDP
increases by $600 million.
The Measurement and Structure of the Canadian Economy 23
3. a. ABC produces output valued at $2 million and has total expenses of $1.3
million ($1 million for labour, $0.1 million interest, $0.2 million taxes). So its
profits are $0.7 million. XYZ produces output valued at $3.8 million ($3 million
for the three computers that were sold, plus $0.8 million for the unsold
computer in inventory) and has expenses of $3.2 million ($2 million for
components, $0.8 million for labour, and $0.4 million for taxes). So its profits
The income approach yields the same GDP total contribution. The amounts
are:
ABC XYZ Total
Labour $1.0 million $0.8 million $1.8 million
b. If ABC pays an additional $.5 million for computer chips from abroad, the
results change slightly. The correct answer is easiest to see using the
expenditure approach. As in part a, there is $3.8 million expenditure on final
4. a. Product approach: $50 = lumber store’s value added = $200 product minus
$150 value of product produced in the previous year. Expenditure approach:
24 Chapter 2
c. Product approach: $20 000 salary plus $8000 child care equals $28 000.
Note that there is a sense in which the child care is an intermediate service
and should not be counted, because without it the homemaker would not be
able to work. But in practice there is no way to separate such intermediate
services from final services, so they are all added to GDP Expenditure
approach: $28 000 ($8000 consumption spending on child care services plus
e. Product approach: $0 because nothing is produced. Expenditure approach:
$0 because this is a transfer, not a government purchase of goods or
services. Income approach: $0, because this is not a payment to a factor of
production, just a transfer.
f. Product approach: $5000 worth of advertising services. Expenditure
approach: $5000 of government purchases. Income approach: $5000
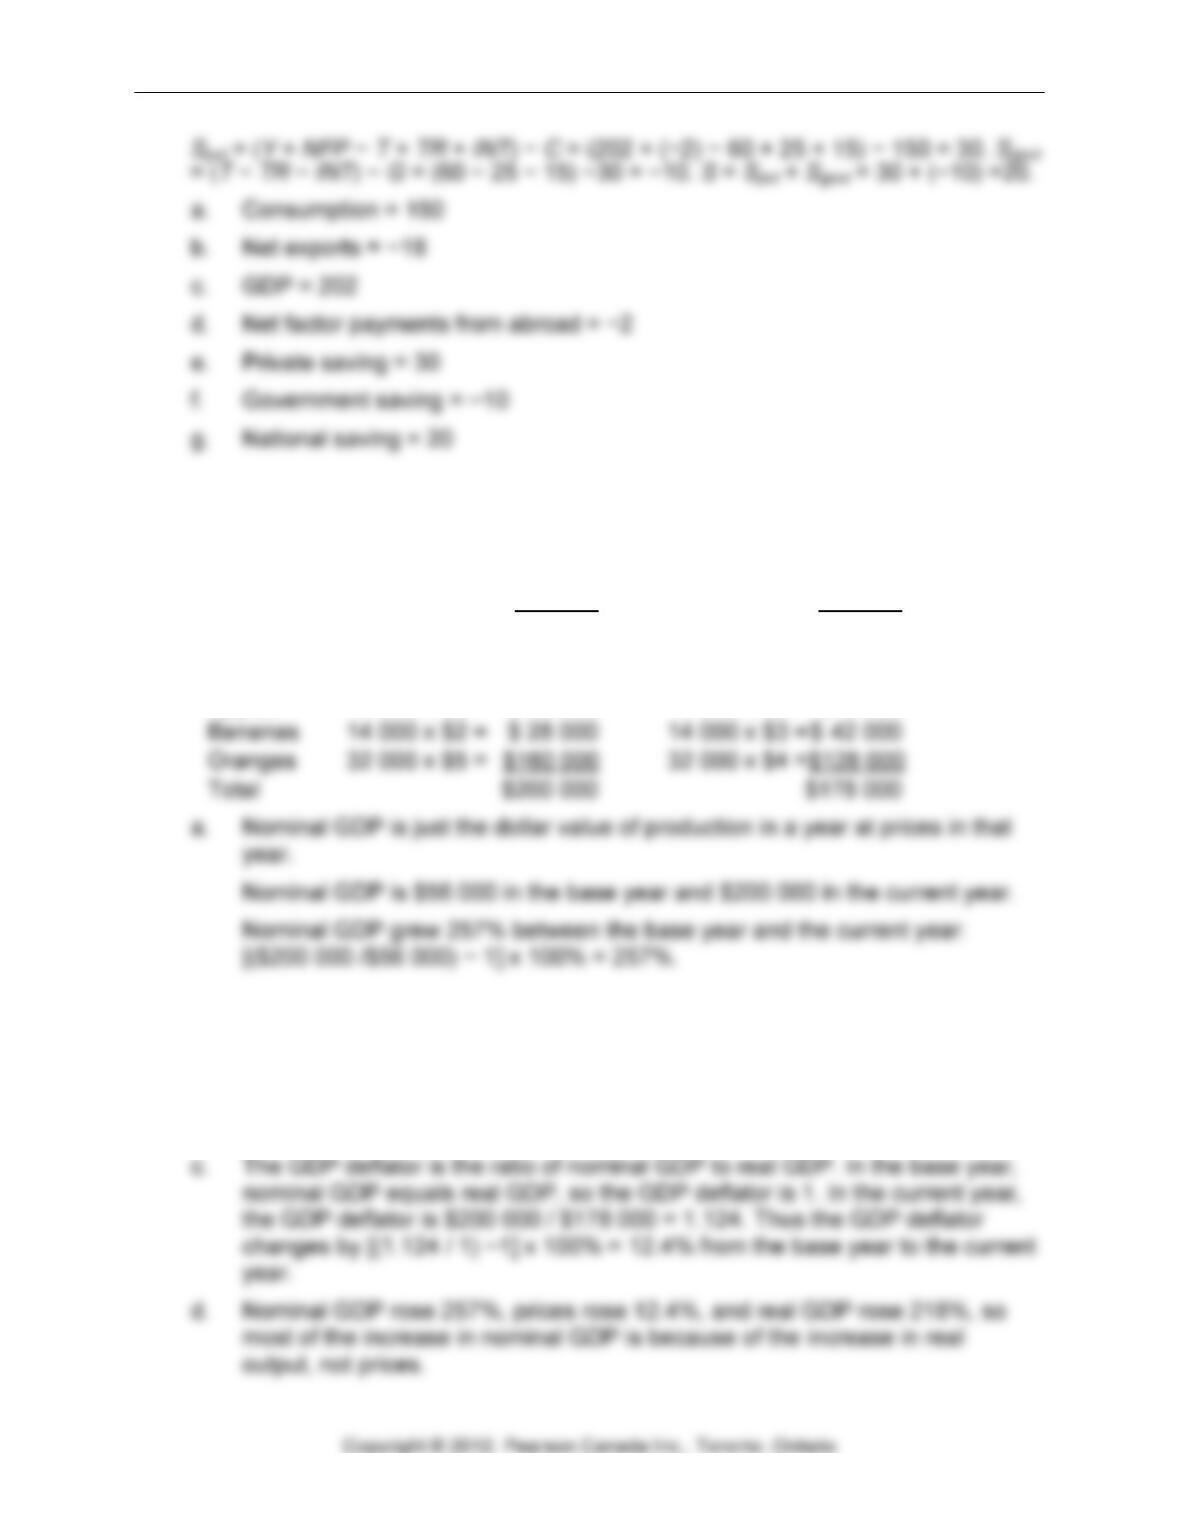
5. Given data: I = 40, G = 30, GNP = 200, CA = −20 = NX + NFP, T = 60, TR = 25,
INT = 15, NFP = 7 − 9 = −2. Since GDP = GNP−NFP, GDP = 200 −(−2) = 202 = Y.
The Measurement and Structure of the Canadian Economy 25
6. Base-year quantities at current-year prices: at base-year prices:
Apples 3 000 x $3 = $ 9 000 3000 x $2 = $ 6 000
Bananas 6 000 x $2 = $12 000 6000 x $3 = $18 000
Oranges 8 000 x $5 = $40 000 8000 x $4 = $32 000
Total $61 000 $56 000
Current-year quantities at current-year prices: at base-year prices:
Apples 4 000 x $3 = $ 12 000 4 000 x $2 = $ 8 000
b. Real GDP is calculated by finding the value of production in each year at
base-year prices. Thus, from the table above, real GDP is $56 000 in the
base year and $178,000 in the current year. In percentage terms, real GDP
increases from the base year to the current year by [($178 000 / $56 000) − 1]
x 100% = 218%.
26 Chapter 2
7. Calculating inflation rates:
1929–30: [(14.0 / 14.2) – 1] x 100% = –1.4%
8. The nominal interest rate is [(545 / 500) – 1] × 100% = 9%. The inflation rate is
[(214 / 200) – 1] x 100% = 7%. So the real interest rate is 2% (9% nominal rate –
9. a. The annual rate of inflation from January 1, 2010 to January 1, 2012, is 10%.
This can be found by calculating the constant rate of inflation that would raise
b. By similar reasoning, the inflation rate over the three-year period is (1 + π )³ =
266.2 / 200, or π = 10%.
c. We can derive a general expression in the same way:
Analytical Problems
1. To be included in GDP work must be paid employment. If Paula provides care to
2. Canada’s GNP is the market value of final goods and services newly produced by
factors of production owned by Canadians. Since ABC Inc. is a Canadian firm, the
The Measurement and Structure of the Canadian Economy 27
3. National saving does not rise because of the switch to CheapCall because
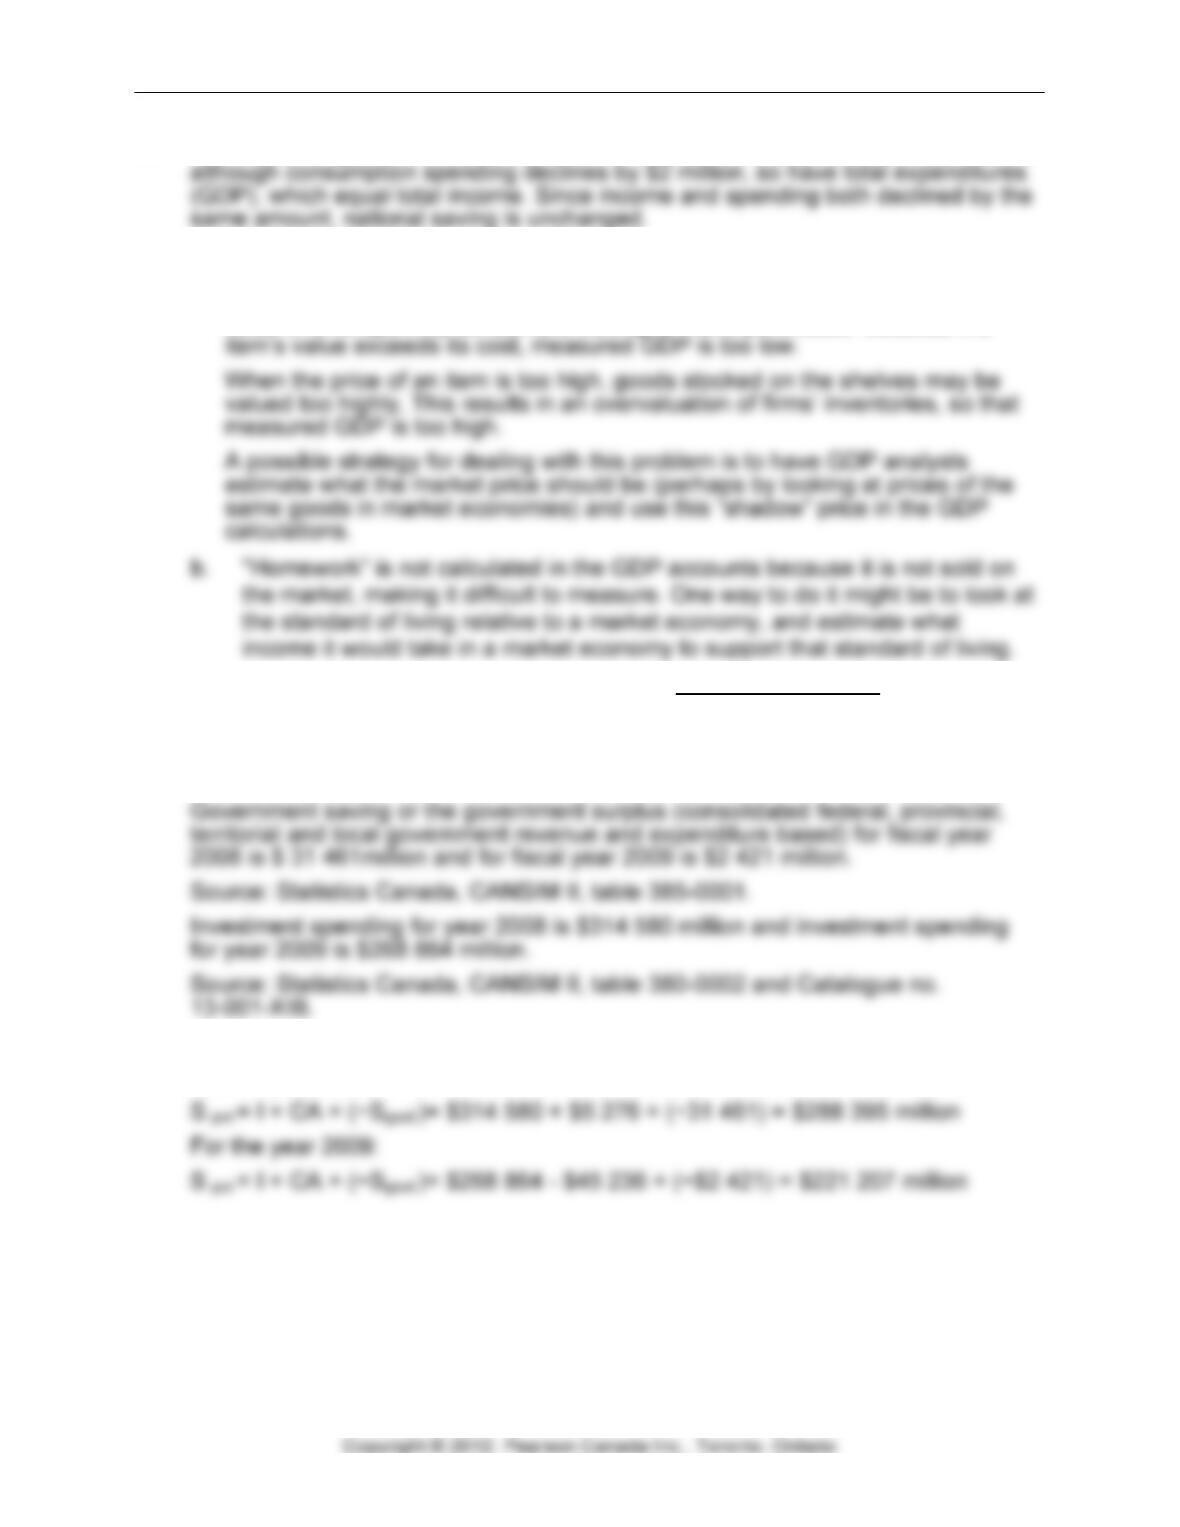
4. a. The problem in a planned economy is that prices do not measure market value.
When the price of an item is too low, then goods are really more expensive
than their listed price suggests—we should include in their market value the
value of time spent by consumers waiting to make purchases. Because the
5. Example from Statistics Canada, CANSIM II or www.statscan.gc.ca:
Current account balance for year 2008 is $ 5 276million and for year 2009 is -$45
236 million.
Source: Statistics Canada, CANSIM II, tables 376–0001 and 376–0002.
Assuming the above data we can compute the following:
For the year 2008: