A n s w e r s t o t h e R e v i e w Q u i z z e s
Page 34
1. How does the production possibilities frontier illustrate scarcity?
2. How does the production possibilities frontier illustrate production efficiency?
3. How does the production possibilities frontier show that every choice involves a tradeoff?
4. How does the production possibilities frontier illustrate opportunity cost?
5. Why is opportunity cost a ratio?
6. Why does the PPF bow outward and what does that imply about the relationship between
opportunity cost and the quantity produced?
Some resources are better suited to produce one type of good or service, like pizza. Other resources
are better suited to produce other goods or services, like DVDs. If society allocates resources wisely, it
2
THE ECONOMIC
PROBLEM
C h a p t e r
20 C H A P T E R 2
Page 37
1. What is marginal cost? How is it measured?
2. What is marginal benefit? How is it measured?
3. How does the marginal benefit from a good change as the quantity produced of that good
increases?
4. What is allocative efficiency and how does it relate to the production possibilities frontier?
Production efficiency occurs when production takes place at a point on the PPF. This indicates that all
5. What conditions must be satisfied if resources are used efficiently?
Page 39
1. What generates economic growth?
2. How does economic growth influence the production possibilities frontier?
3. What is the opportunity cost of economic growth?
4. Explain why Hong Kong has experienced faster economic growth than the United States.
Hong Kong chose to devote a greater proportion of its available resources to the production of capital
5. Does economic growth overcome scarcity?
Scarcity reflects the inability to satisfy all our wants. Regardless of the amount of economic growth,
Page 43
1. What gives a person a comparative advantage?
2. Distinguish between comparative advantage and absolute advantage.
A person has a comparative advantage in producing a good when he or she has the lowest opportunity
3. Why do people specialize and trade?
People can compare consumption possibilities from producing all goods and services through self-
4. What are the gains from specialization and trade?
5. What is the source of the gains from trade?
22 C H A P T E R 2
Page 45
1. Why are social institutions such as firms, markets, property rights, and money necessary?
These social institutions factors necessary for a decentralized economy to coordinate production. Firms
are necessary to allow people to specialize. Without firms, specialization would be limited because a
2. What are the main functions of markets?
3. What are the flows in the market economy that go from firms to households and the flows from
households to firms?
On the real side of the economy, goods and services flow from firms to households. On the monetary
T H E E C O N O M I C P R O B L E M 23
A n s w e r s t o t h e S t u d y P l a n Pr o b l e m s a n d A p p l i c a t i o ns
Use the following data to work Problems 1 to 3.
Brazil produces ethanol from sugar, and the land used to
grow sugar can be used to grow food crops. The table to the
right sets out Brazil’s production possibilities for ethanol and
food crops.
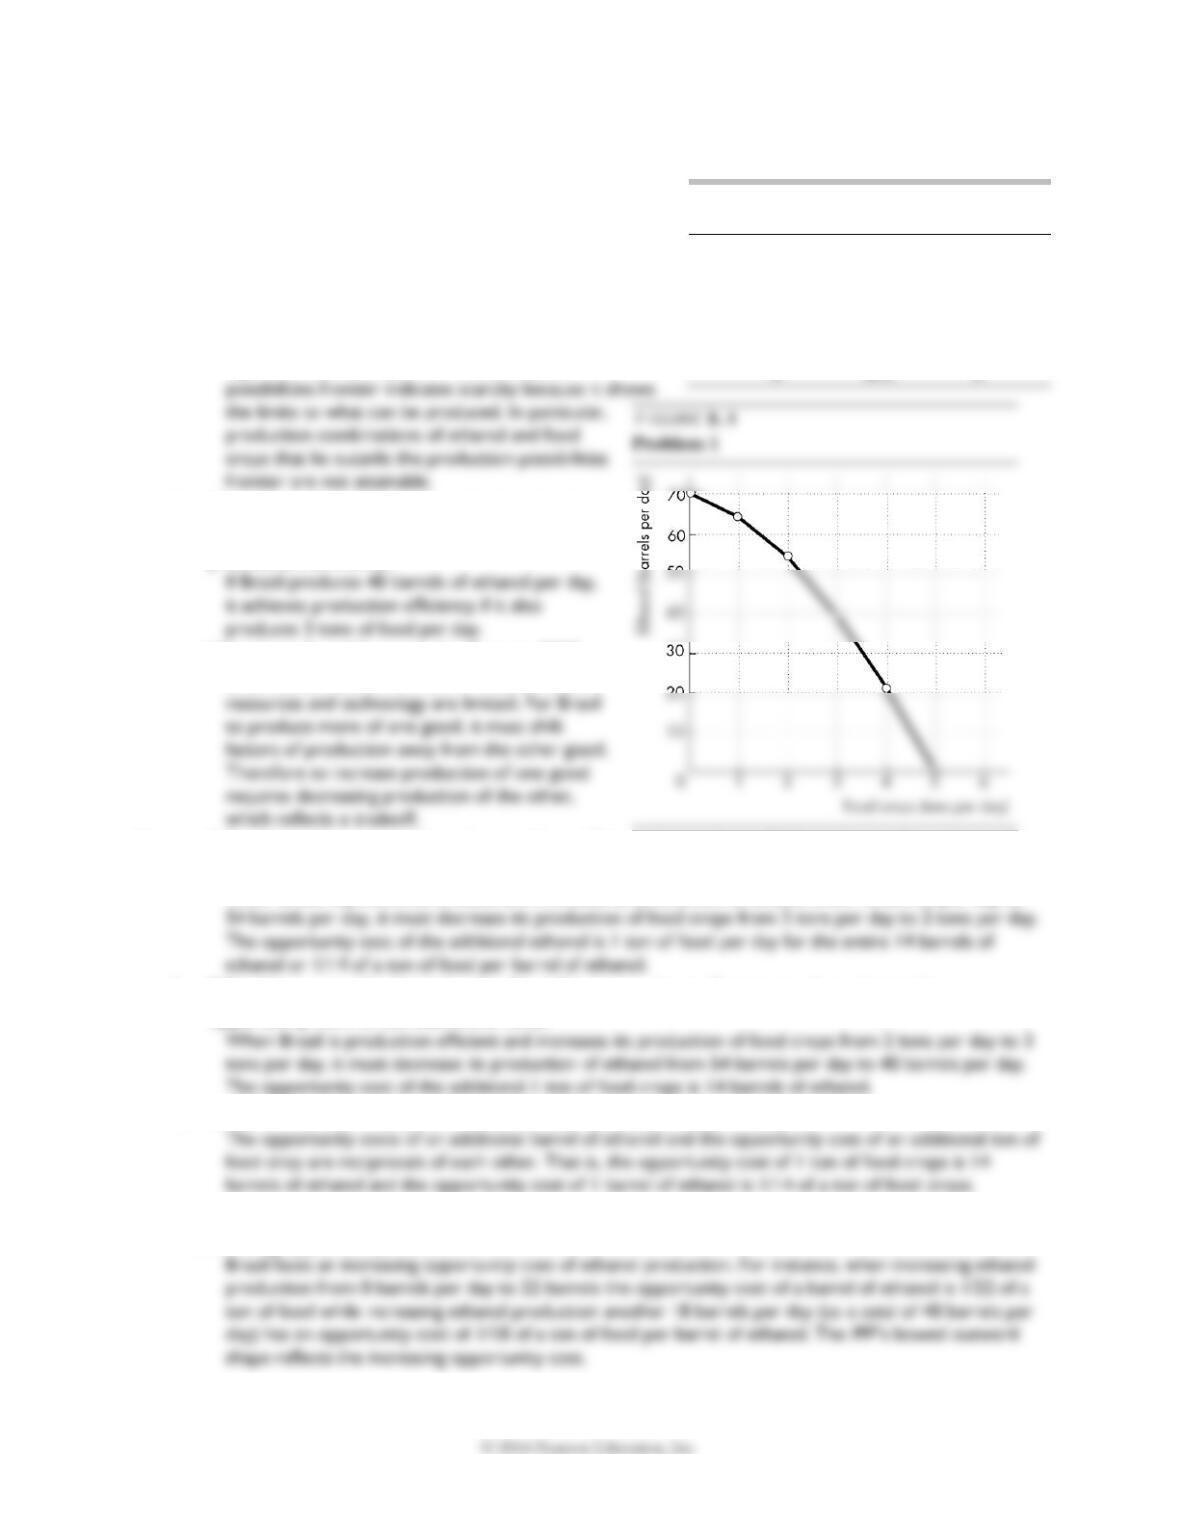
1. a. Draw a graph of Brazil’s PPF and explain how your
graph illustrates scarcity.
Figure 2.1 shows Brazil’s PPF. The production
b. If Brazil produces 40 barrels of ethanol a day,
how much food must it produce to achieve
production efficiency?
c. Why does Brazil face a tradeoff on its PPF?
Brazil faces a tradeoff on its PPF because Brazil’s
2. a. If Brazil increases ethanol production from 40 barrels per day to 54 barrels per day, what is the
opportunity cost of the additional ethanol?
When Brazil is production efficient and increases its production of ethanol from 40 barrels per day to
b. If Brazil increases food production from 2 tons per day to 3 tons per day, what is the
opportunity cost of the additional food?
c. What is the relationship between your answers to parts (a) and (b)?
3. Does Brazil face an increasing opportunity cost of ethanol? What feature of Brazil’s PPF illustrates
increasing opportunity cost?
Ethanol
(barrels per day)
Food crops
(tons per day)
70
and
0
64
and
1
54
and
2
40
and
3
22
and
4
0
and
5
24 C H A P T E R 2
Use the above table (for Problems 1 to 3) to work Problems 4 and 5.
4. Define marginal cost and calculate Brazil’s marginal cost of producing a ton of food when the
quantity produced is 2.5 tons per day.
The marginal cost of a good is the opportunity cost of producing one more unit of the good. When the
5. Define marginal benefit. Explain how it is measured and why the data in the table does not enable
you to calculate Brazil’s marginal benefit from food.
6. Distinguish between production efficiency and allocative efficiency. Explain why many production
possibilities achieve production efficiency but only one achieves allocative efficiency.
7. A farm grows wheat and produces pork. The marginal
cost of producing each of these products increases as
more of it is produced.
a. Make a graph that illustrates the farm’s PPF.
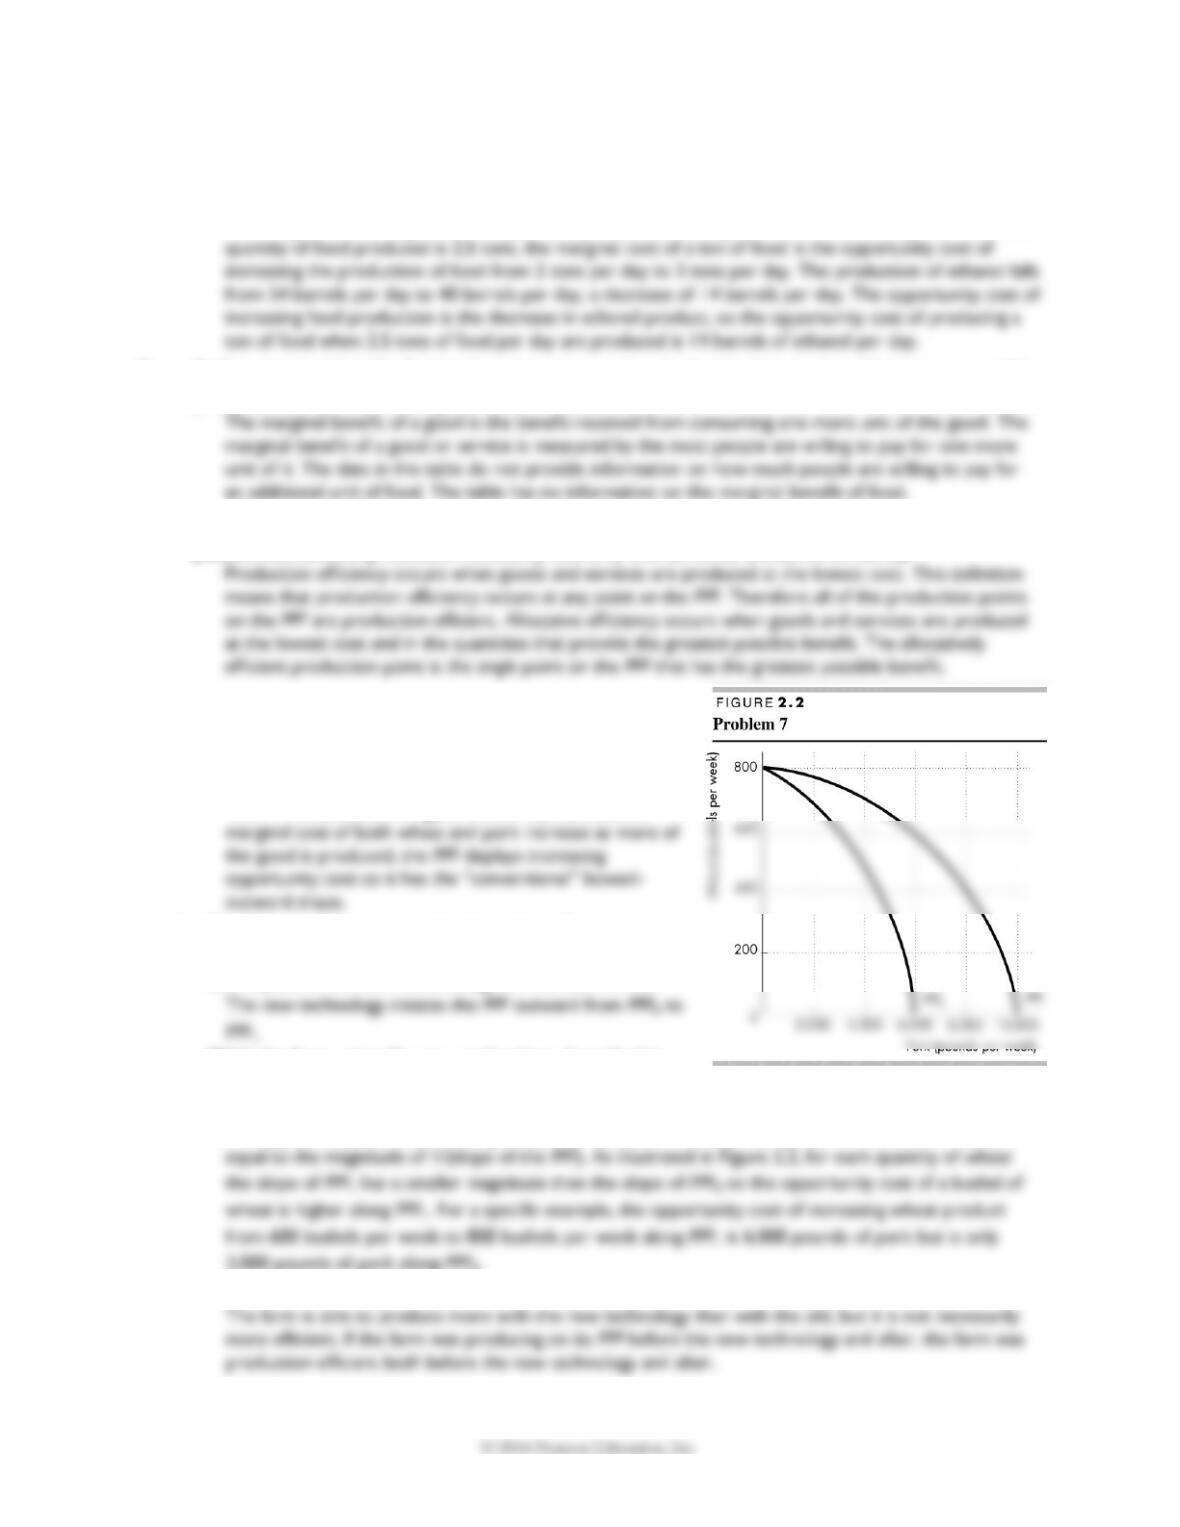
The PPF is illustrated in Figure 2.2 as PPF0. Because the
b. The farm adopts a new technology that allows it to use
fewer resources to fatten pigs. On your graph sketch
the impact of the new technology on the farm’s PPF.
c. With the farm using the new technology described in
part (b), has the opportunity cost of producing a ton of wheat increased, decreased, or
remained the same? Explain and illustrate your answer.
The opportunity cost of producing wheat has increased. The opportunity cost of a bushel of wheat is
3,000 pounds of pork along PPF0.
d. Is the farm more efficient with the new technology than it was with the old one? Why?
8. In one hour, Sue can produce 40 caps or 4 jackets and Tessa can produce 80 caps or 4 jackets.
a. Calculate Sue’s opportunity cost of producing a cap.
b. Calculate Tessa’s opportunity cost of producing a cap.
c. Who has a comparative advantage in producing caps?
d. If Sue and Tessa specialize in producing the good in which they have a comparative advantage,
and they trade 1 jacket for 15 caps, who gains from the specialization and trade?
9. Suppose that Tessa buys a new machine for making jackets that enables her to make 20 jackets an
hour. (She can still make only 80 caps per hour.)
a. Who now has a comparative advantage in producing jackets?
b. Can Sue and Tessa still gain from trade?
c. Would Sue and Tessa still be willing to trade 1 jacket for 15 caps? Explain your answer.
10. For 50 years, Cuba has had a centrally planned economy in which the government makes the big
decisions on how resources will be allocated.
a. Why would you expect Cuba’s production possibilities (per person) to be smaller than those of
the United States?
Cuba’s economy is almost surely less efficient than the U.S. economy. The Cuban central planners do
26 C H A P T E R 2
b. What are the social institutions that Cuba might lack that help the United States to achieve
allocative efficiency?
Of the four social institutions, firms, money, markets, and property rights, Cuba’s economy has firms
T H E E C O N O M I C P R O B L E M 27
200
and
and
Answers to Additional Problems and Applications
Use the table to work Problems 11 and 12. Suppose that Yucatan’s
production possibilities are given in the table.
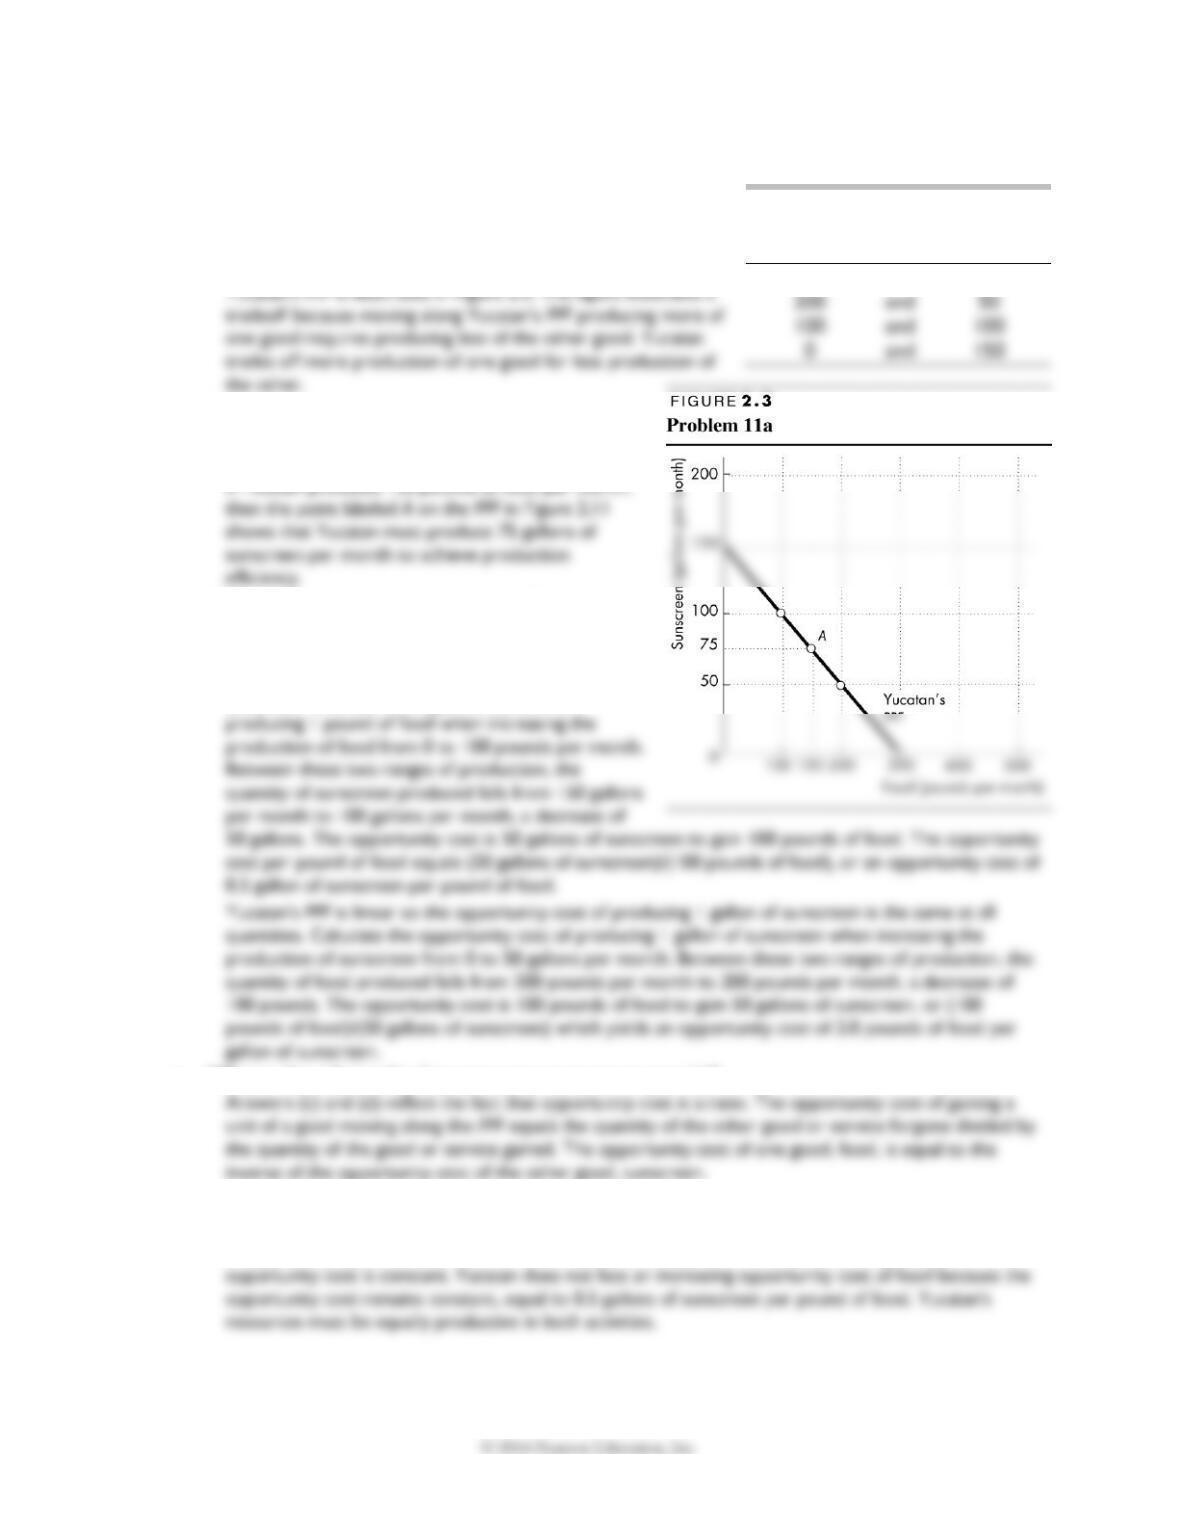
11. a. Draw a graph of Yucatan’s PPF and explain how your graph
illustrates a tradeoff.
b. If Yucatan produces 150 pounds of food per
month, how much sunscreen must it produce if it
achieves production efficiency?
c. What is Yucatan’s opportunity cost of producing
(i) 1 pound of food and (ii) 1 gallon of sunscreen?
Yucatan’s PPF is linear so the opportunity cost of
producing 1 pound of food is the same at all
quantities. Calculate the opportunity cost of
e. What is the relationship between your answers to part (c)?
12. What feature of a PPF illustrates increasing opportunity cost? Explain why Yucatan’s opportunity
cost does or does not increase.
If opportunity costs increase, the PPF bows outward. Yucatan’s PPF is linear and along a linear PPF the
Food
(pounds per
month)
Sunscreen
(gallons per
month)
300
and
0
13. In problem 11, what is the marginal cost of 1 pound of food in Yucatan when the quantity
produced is 150 pounds per day? What is special about the marginal cost of food in Yucatan?
14. The table describes the preferences in Yucatan.
a. What is the marginal benefit from sunscreen and how is
it measured?
The marginal benefit from sunscreen is the benefit enjoyed
b. Use the table in Problem 11. What does Yucatan produce to achieve allocative efficiency?
15. U.K. Music Stores Squeezed off Main Street
Music retailing is changing: Sony Music and Amazon are selling online, discount stores are selling at
low prices, and Main Street music retailers are all struggling.
Source: The Economist, 20 January 2007
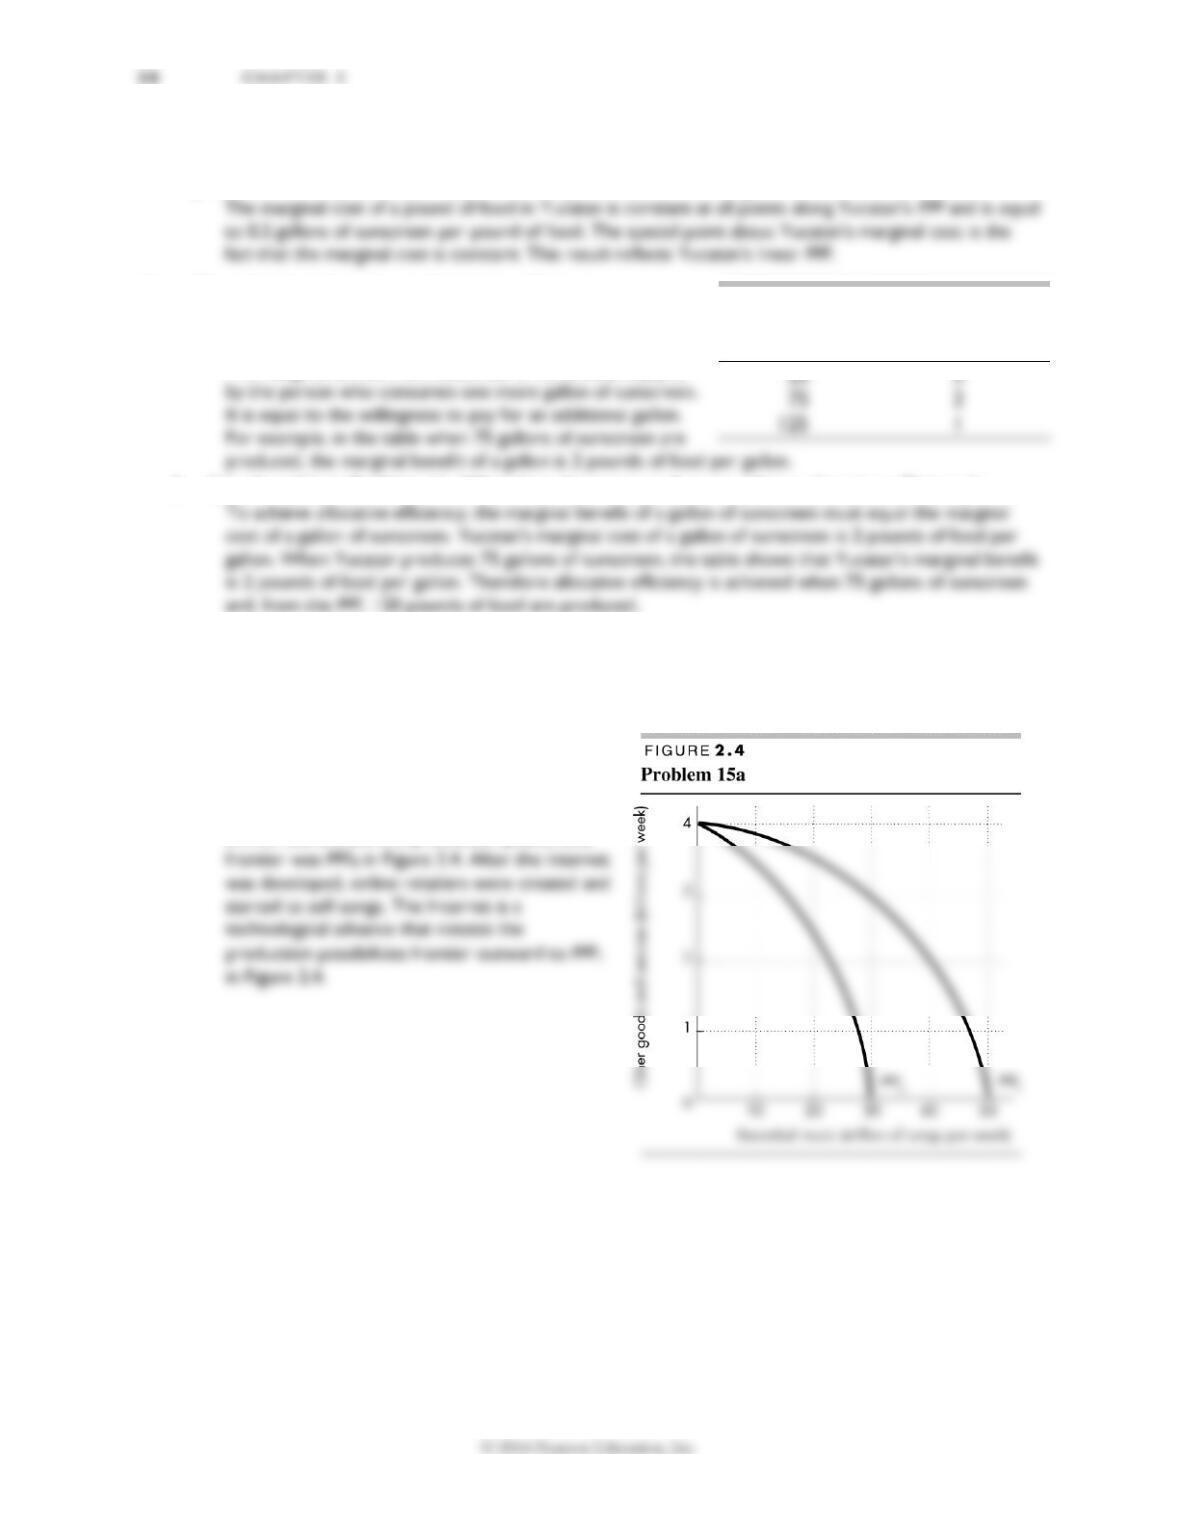
a. Draw the PPF curves for Main Street music
retailers and online music retailers before and
after the Internet became available.
Before there was an Internet, there were no
online retailers and the production possibilities
Sunscreen
(gallons per
month)
Willingness to pay
(pounds of food
per gallon)
T H E E C O N O M I C P R O B L E M 29
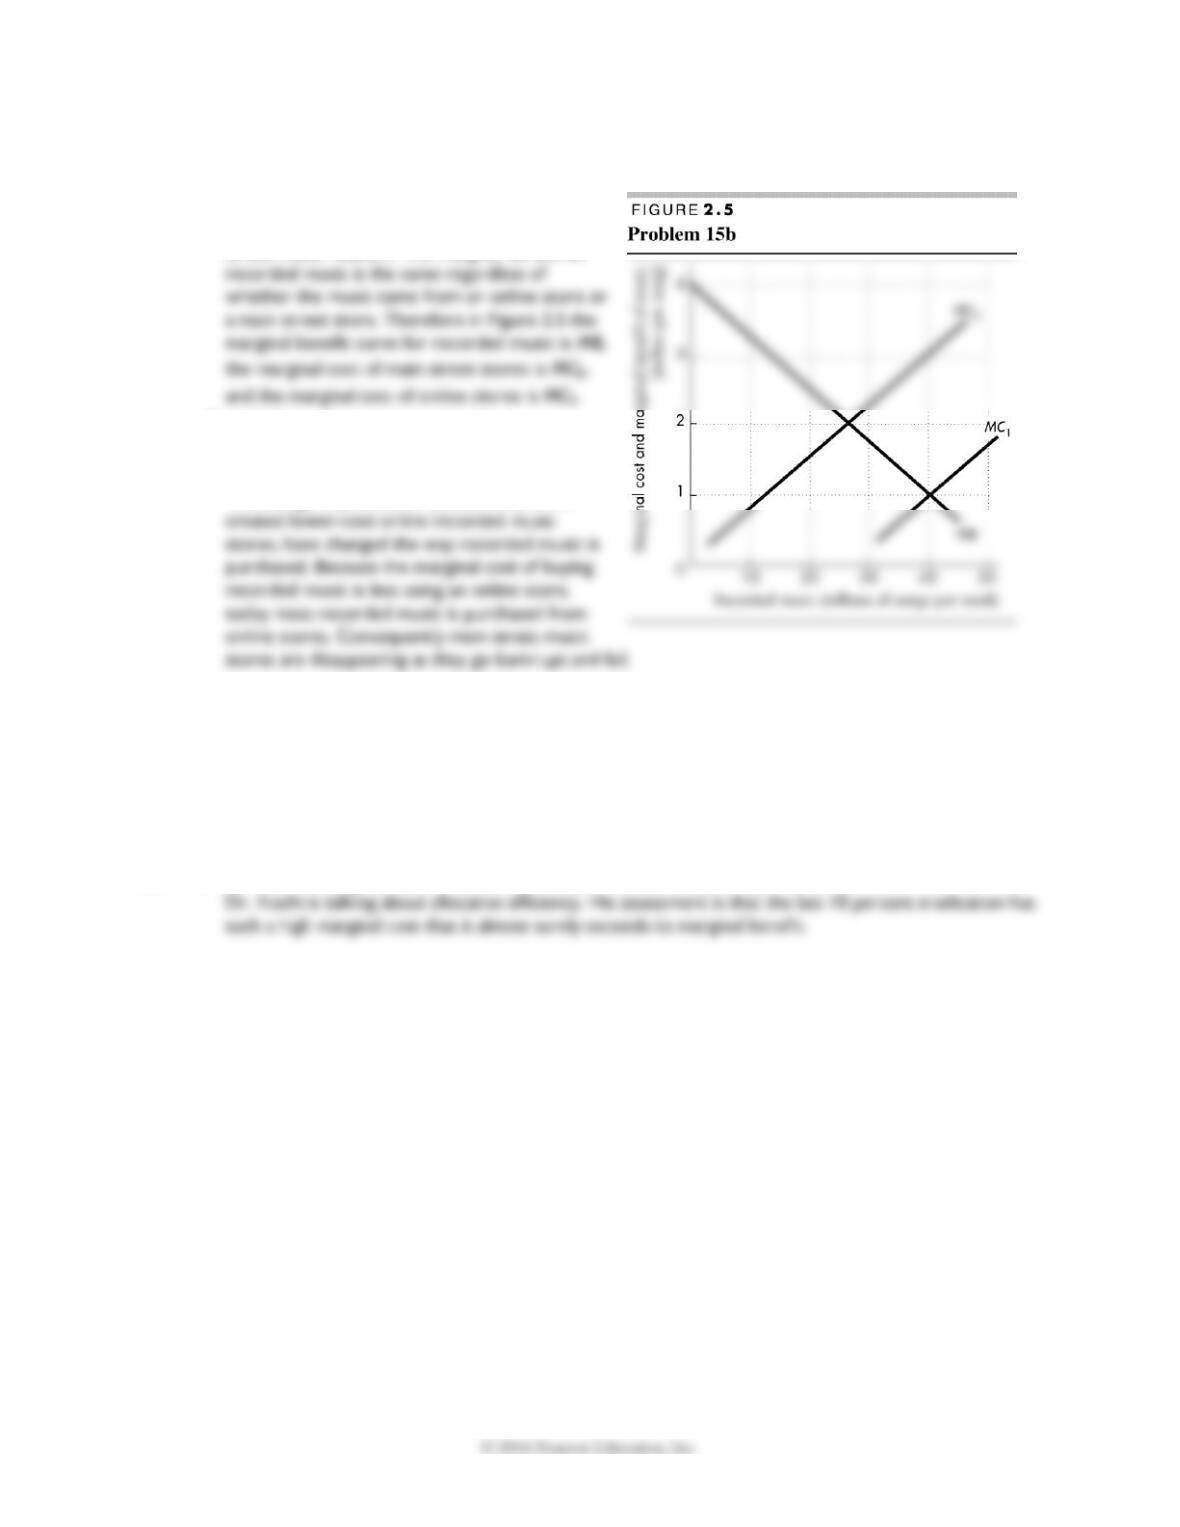
b. Draw the marginal cost and marginal benefit curves for Main Street music retailers and online
music retailers before and after the Internet became available.
Online music retailers have a lower marginal
cost of delivering recorded music than do main
street music retailers. The marginal benefit for
c. Explain how changes in production
possibilities, preferences or both have changed
the way in which recorded music is retailed.
The change in production possibilities, which
Use the following news clip to work Problems 16 and 17.
Malaria Eradication Back on the Table
In response to the Gates Malaria Forum in October 2007, countries are debating the pros and cons of
eradication. Dr. Arata Kochi of the World Health Organization believes that with enough money malaria
cases could be cut by 90 percent, but it would be very expensive to eliminate the remaining10 percent
of cases, so countries should not strive to eradicate malaria.
Source: The New York Times, March 4, 2008
16. Is Dr. Kochi talking about production efficiency or allocative efficiency or both?
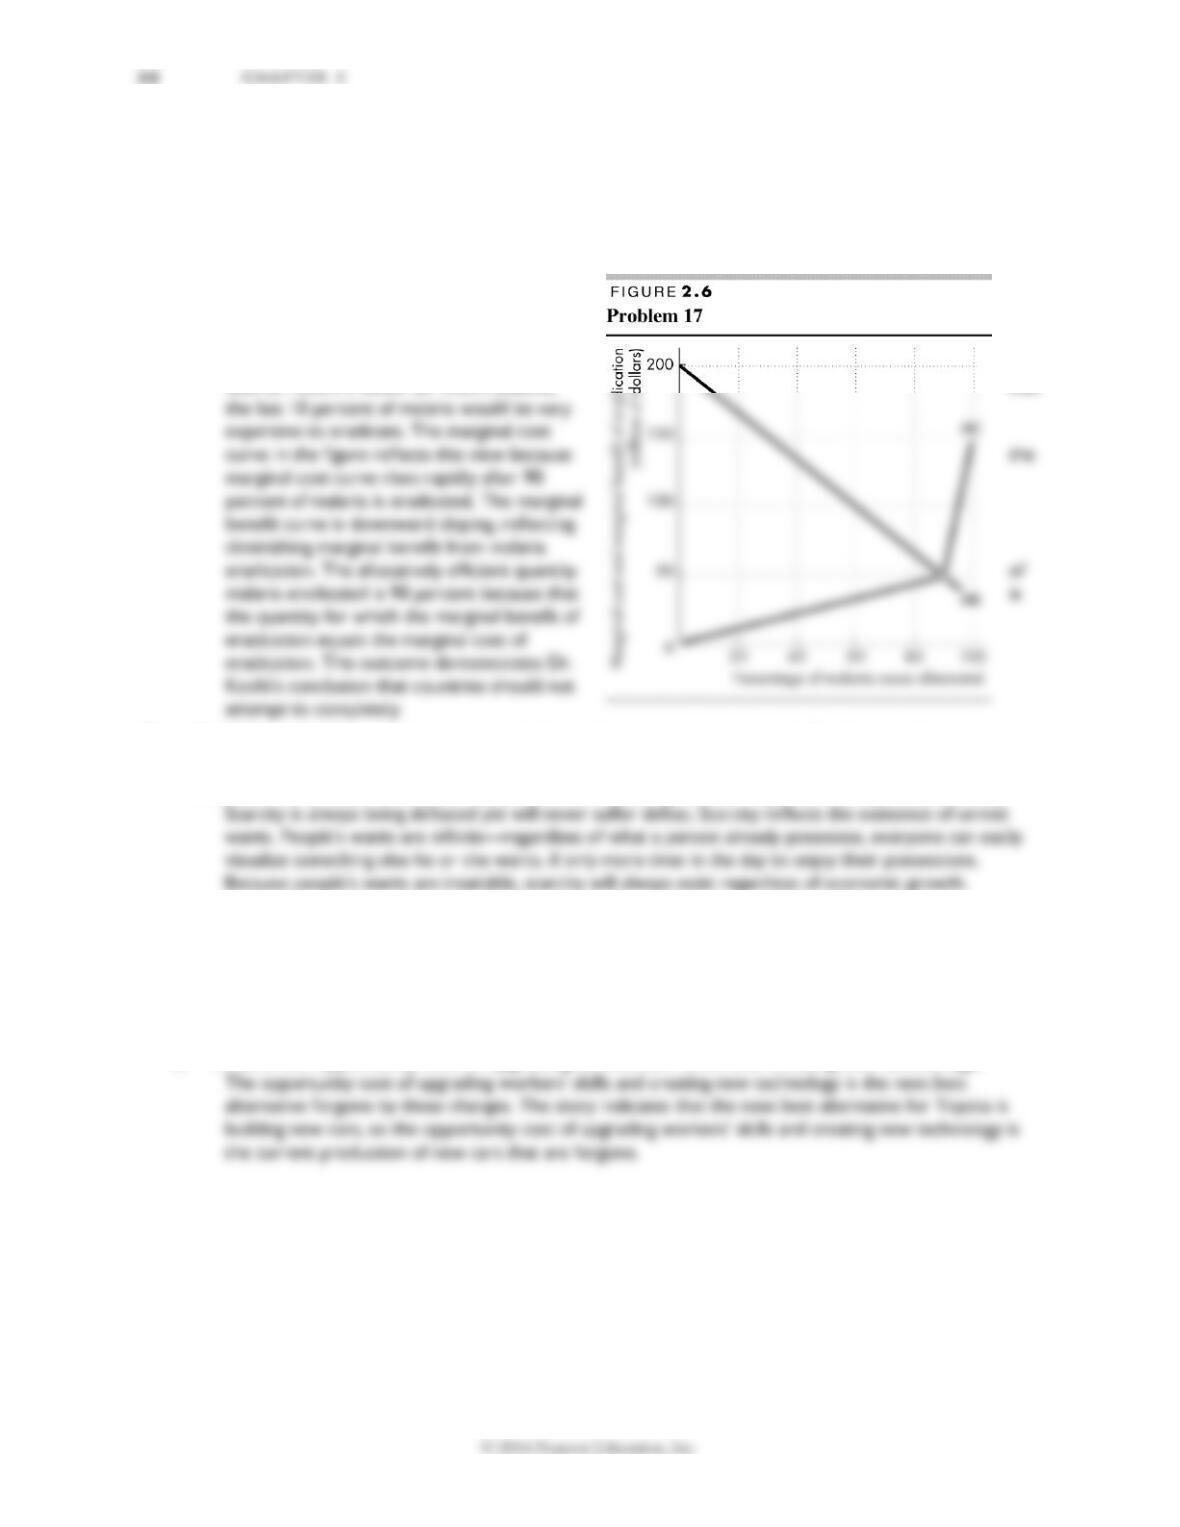
17. Make a graph with the percentage of malaria cases eliminated on the x-axis and the marginal cost
and marginal benefit of driving down malaria cases on the y-axis. On your graph:
(i) Draw a marginal cost curve and marginal benefit curve that are consistent with Dr.
Kochi’s opinion.
(ii) Identify the quantity of malaria
eradicated that achieves allocative
efficiency.
Figure 2.6 shows a marginal cost curve and a
marginal benefit curve that are consistent
with Dr. Kochi’s views. Dr. Kochi believes that
18. Capital accumulation and technological change bring economic growth: Production that was
unattainable yesterday becomes attainable today; production that is unattainable today will
become attainable tomorrow. Why doesn’t economic growth bring an end to scarcity one day?
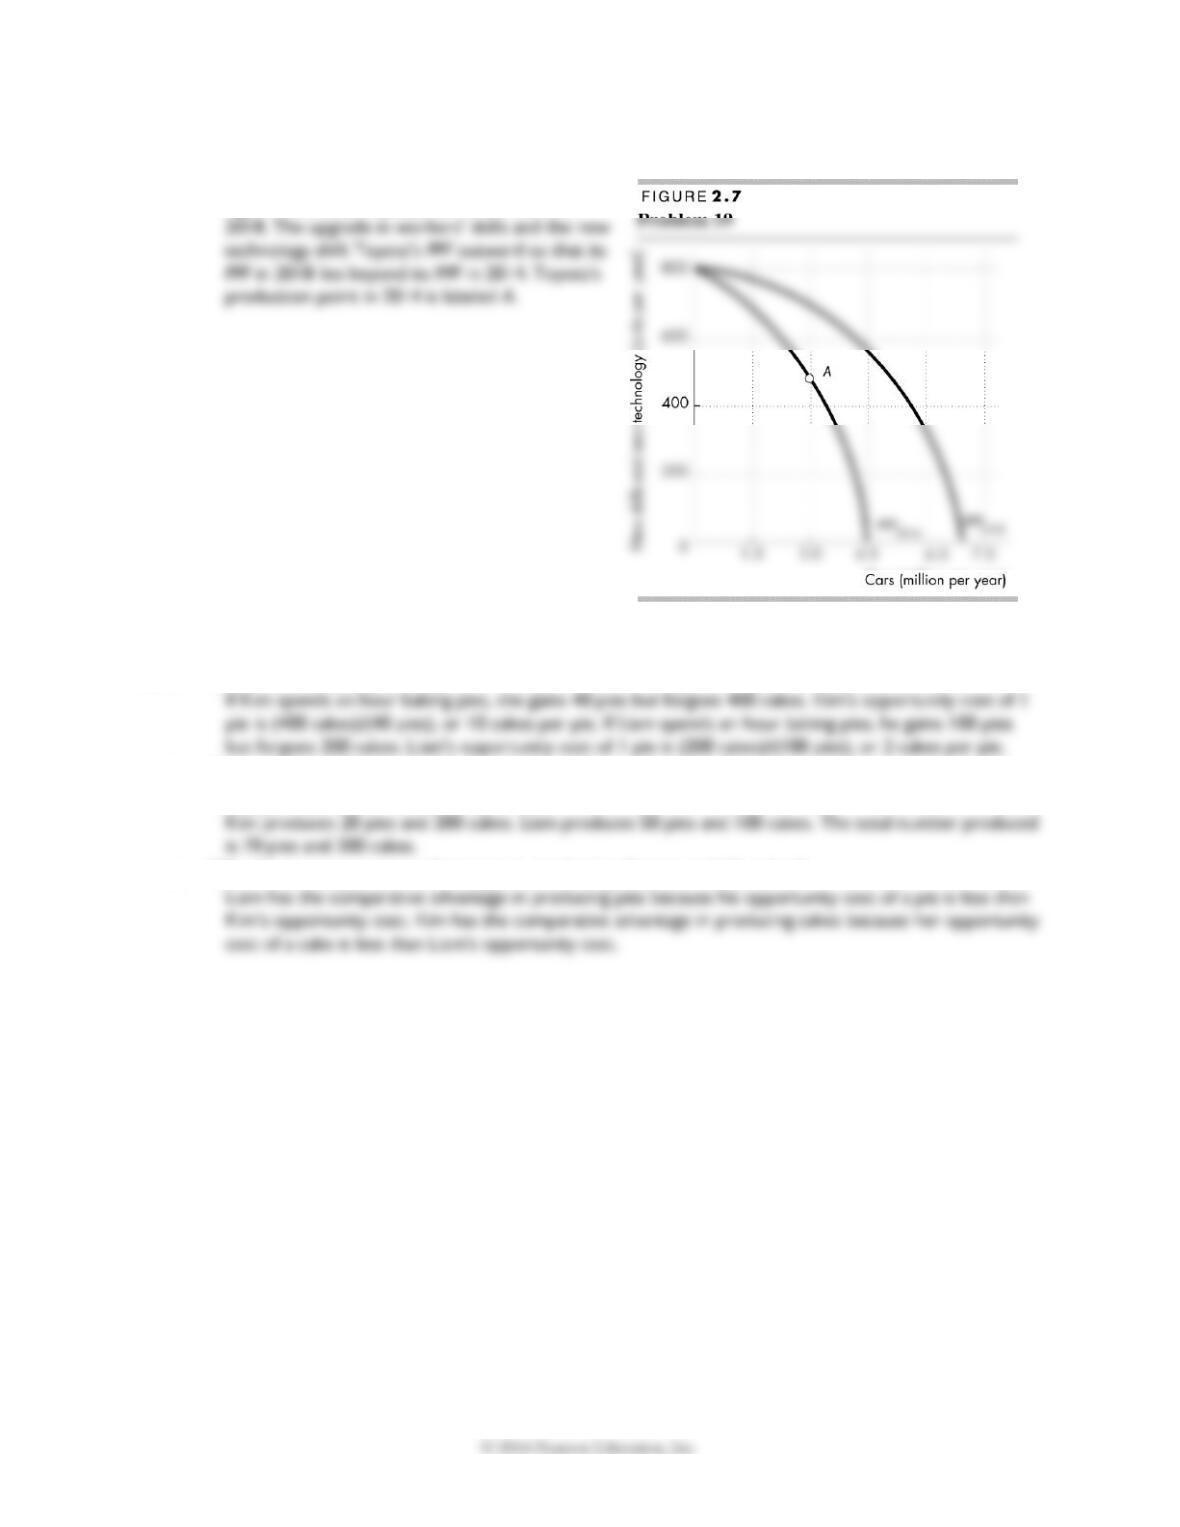
19. Toyota Plans to Build a Better Company
Toyota will continue to produce 3 million cars per year and use the balance of its resources to
upgrade its workers’ skills and create new technology. In three years’ time, Toyota plans to
produce better cars and be more productive.
Source: Financial Post, April 7, 2014
a. What is the opportunity cost of upgrading its workers’ skills and creating new technology?
T H E E C O N O M I C P R O B L E M 31
b. Sketch Toyota’s PPF and mark its production point in 2014. Now show on your graph Toyota’s
PPF in 2018.
Figure 2.7 shows Toyota’s PPF in 2014 and in
Use the following data to work Problems 20 and 21.
Kim can produce 40 pies or 400 cakes an hour. Liam can produce 100 pies or 200 cakes an hour.
20. a. Calculate Kim’s opportunity cost of a pie and Liam’s opportunity cost of a pie.
b. If each spends 30 minutes of each hour producing pies and 30 minutes producing cakes, how
many pies and cakes does each produce?
c. Who has a comparative advantage in producing (i) pies and (ii) cakes?
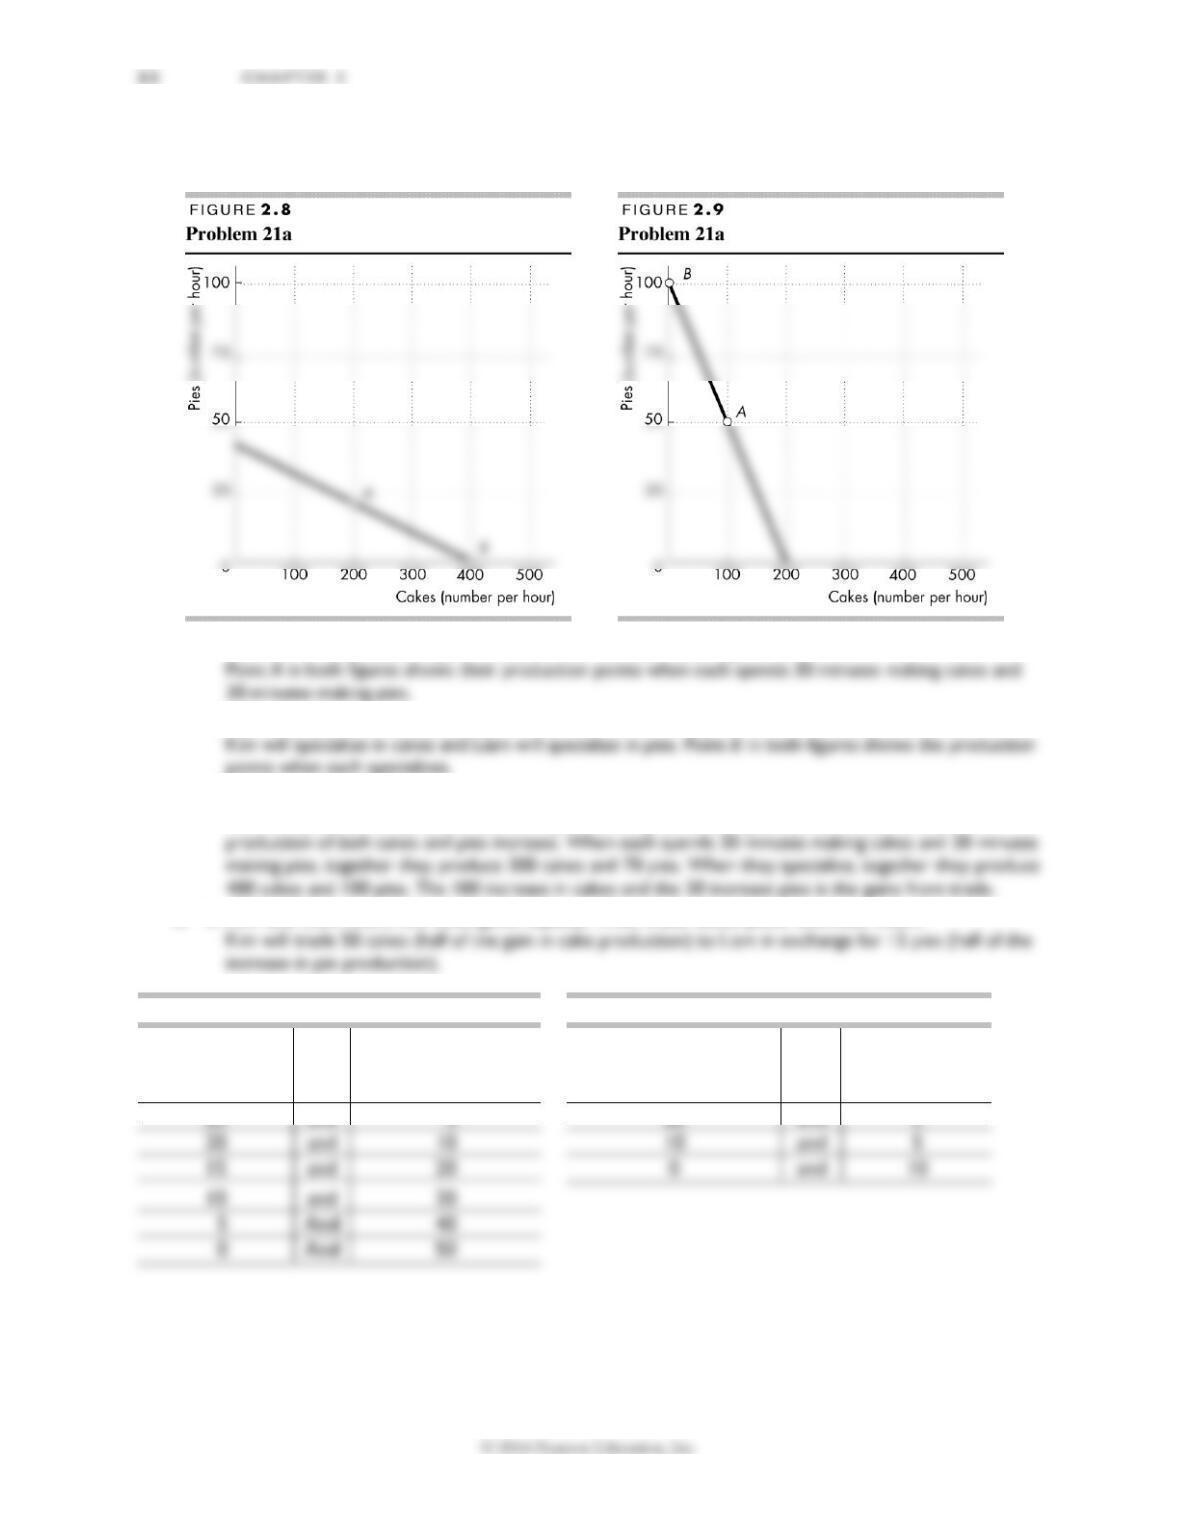
21. a Draw a graph of Kim’s PPF and Liam’s PPF and show the point at which each produces when
they spend 30 minutes of each hour producing pies and 30 minutes producing cakes.
Kim’s PPF is illustrated in Figure 2.8; Liam’s PPF is illustrated in Figure 2.9.
b. On your graph, show what Kim produces and what Liam produces when they specialize.
points when each specializes.
c. When they specialize and trade, what are the total gains from trade?
Kim will specialize in cakes and Liam will specialize in pies. If they specialize and trade, the total
d. If Kim and Liam share the total gains equally, what trade takes place between them?
Tony’s Production Possibilities
Patty’s Production Possibilities
Snowboards
(units per
week)
Skis
(units per week)
Snowboards
(units per week)
Skis
(units per
week)
25
and
0
20
and
0
15
and
and
22. Tony and Patty produce skis and snowboards. The tables show their production possibilities.
Tony produces 5 snowboards and 40 skis a week; Patty produces 10 snowboards and 5 skis a
week.
a. Who has a comparative advantage in producing (i) snowboards and (ii) skis?
(i) Tony’s opportunity cost of a snowboard is (10 skis)/(5 snowboards), or 2 skis per snowboard.
b. If Tony and Patty specialize and trade 1 snowboard for 1 ski, what are the gains from trade?
Tony has a comparative advantage in producing skis, so he specializes in producing skis. Patty has a
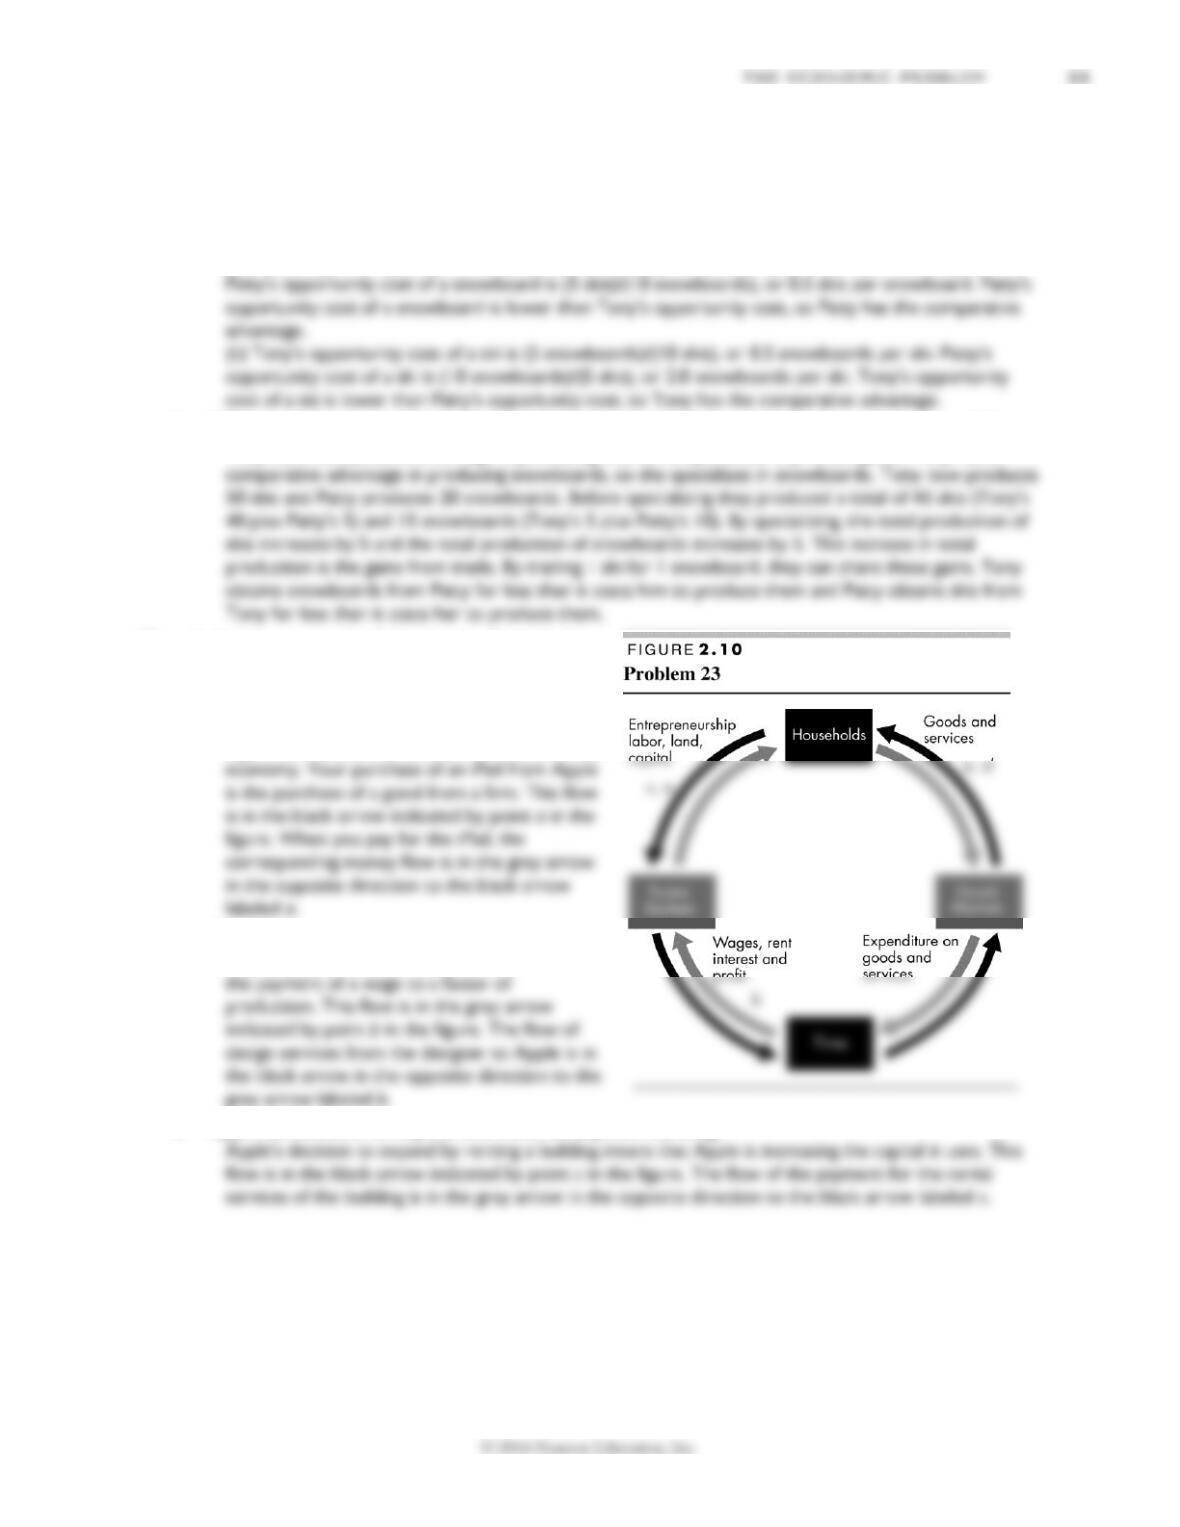
23. Indicate on a graph of the circular flows in the
market economy, the real and money flows in
which the following items belong:
a. You buy an iPad from the Apple Store.
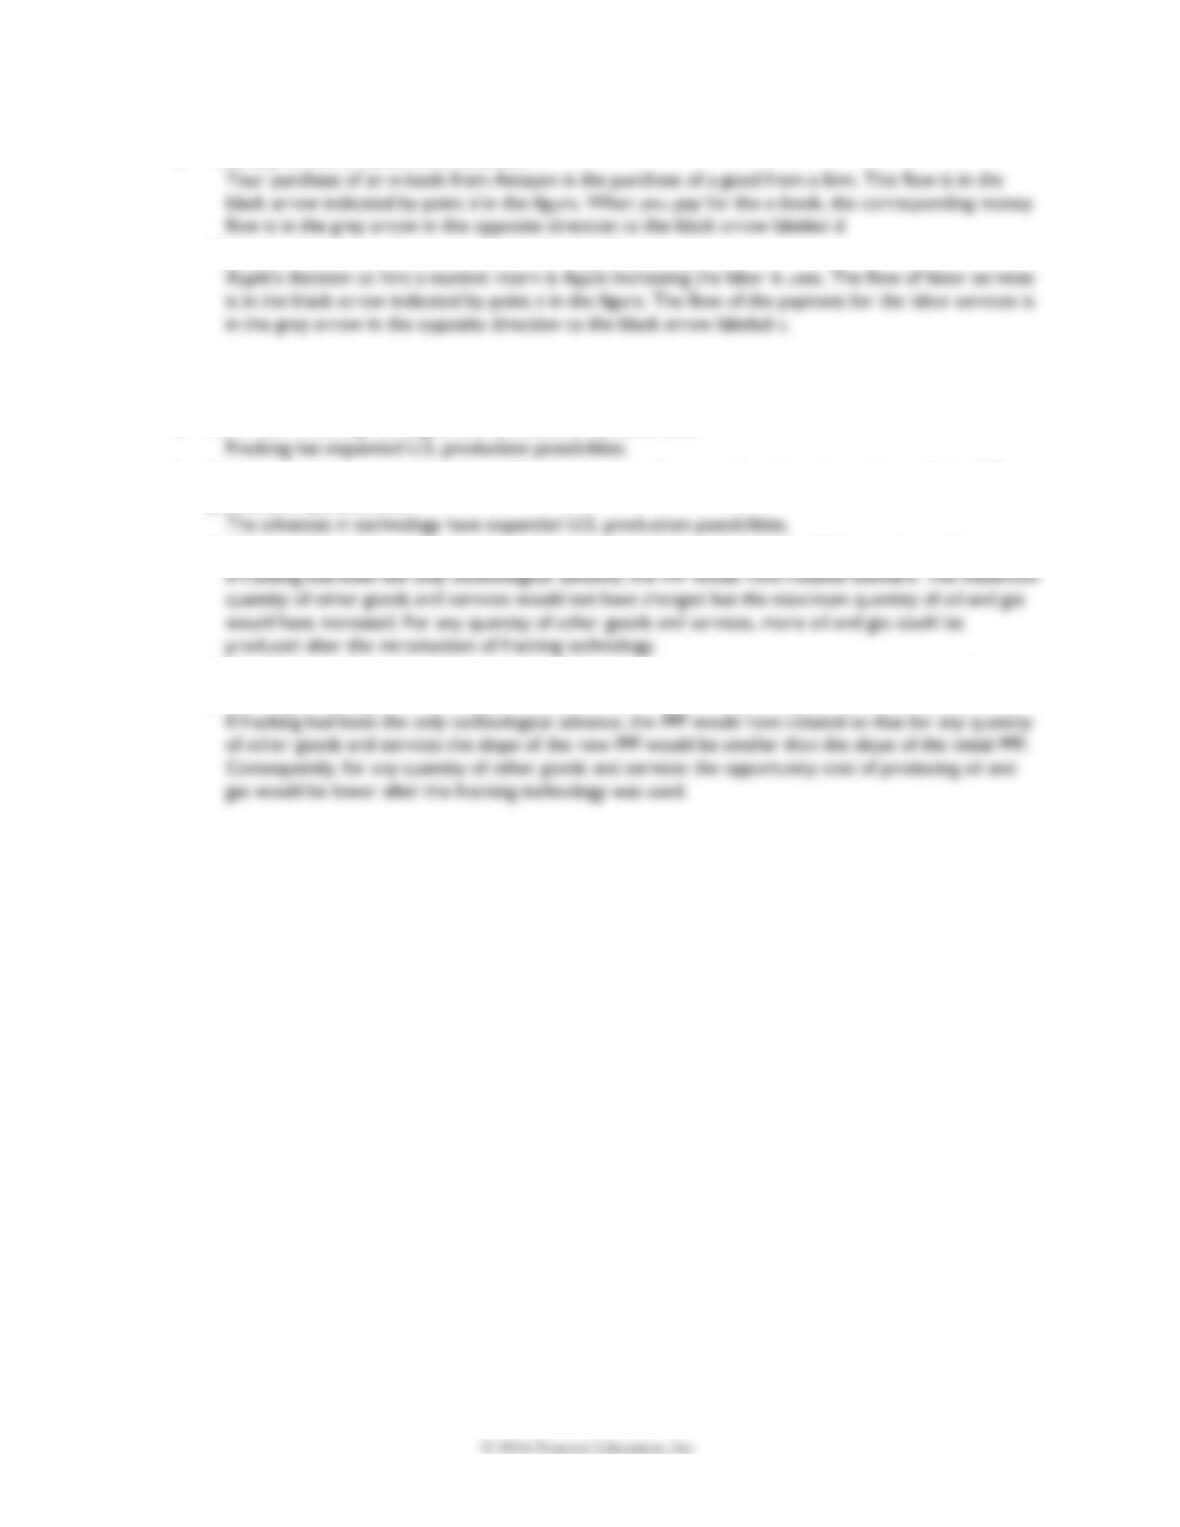
Figure 2.10 shows the circular flows in a market
b. Apple Inc. pays the designers of the iPad.
Apple’s payment to the designers of the iPad is
c. Apple Inc. decides to expand and rents an adjacent building.
34 C H A P T E R 2
d. You buy a new e-book from Amazon.
e. Apple Inc. hires a student as an intern during the summer.
Economics in the News
24. After you have studied Reading Between the Lines on pp. 46–47, answer the following questions.
a. How has “fracking” changed U.S. production possibilities?
b. How have advances in technologies for producing other goods and services changed the U.S.
production possibilities?
c. If “fracking” had been the only technological advance, how would the PPF have changed?
d. If “fracking” had been the only technological advance, how would the opportunity cost of
producing oil and gas have changed? Would it have been lower or higher than it actually was?
25. Lots of Little Screens
Inexpensive broadband access has created a generation of television producers for whom the
Internet is their native medium. As they redirect the focus from TV to computers, cell phones,
and iPods, the video market is developing into an open digital network.
Source: The New York Times, December 2, 2007
a. How has inexpensive broadband changed the production possibilities of video entertainment
and other goods and services?
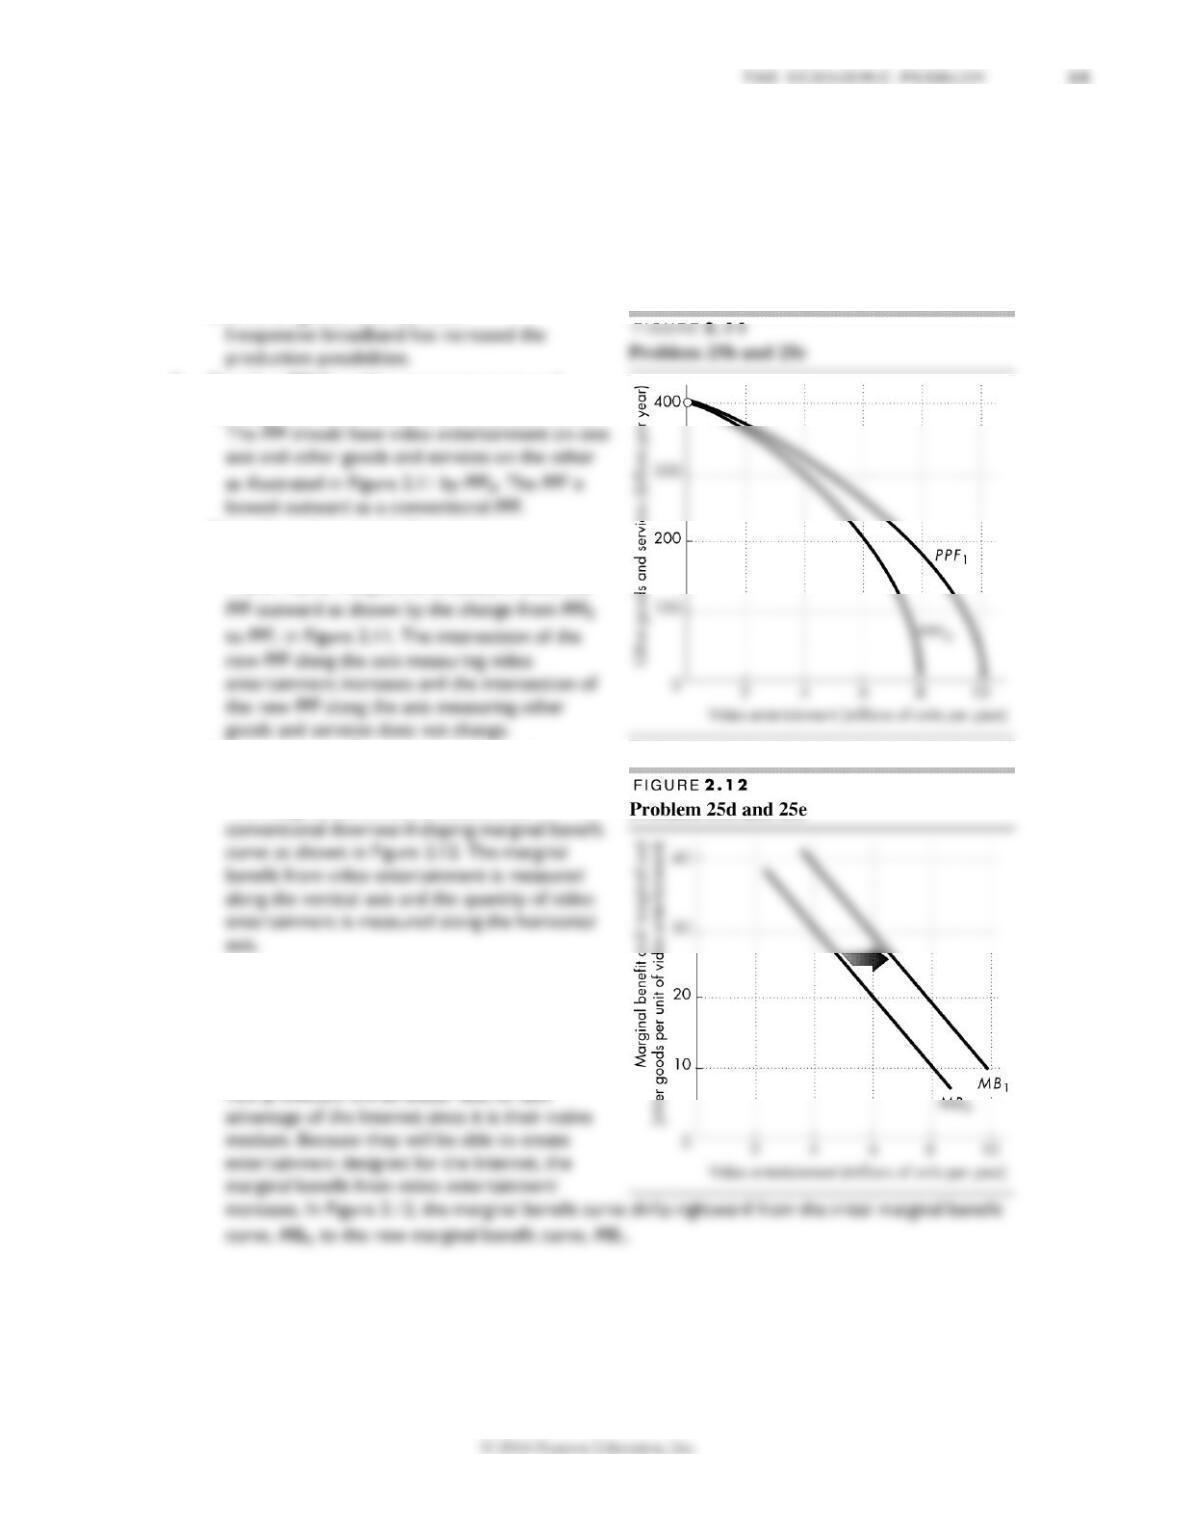
b. Sketch a PPF for video entertainment and
other goods and services before broadband.
c. Show how the arrival of inexpensive
broadband has changed the PPF.
The arrival of inexpensive broadband shifts the
d. Sketch a marginal benefit curve for video
entertainment.
The marginal benefit curve should be a
e. Show how the new generation of TV
producers for whom the Internet is their
native medium might have changed the
marginal benefit from video entertainment.
The marginal benefit increases because these
36 C H A P T E R 2
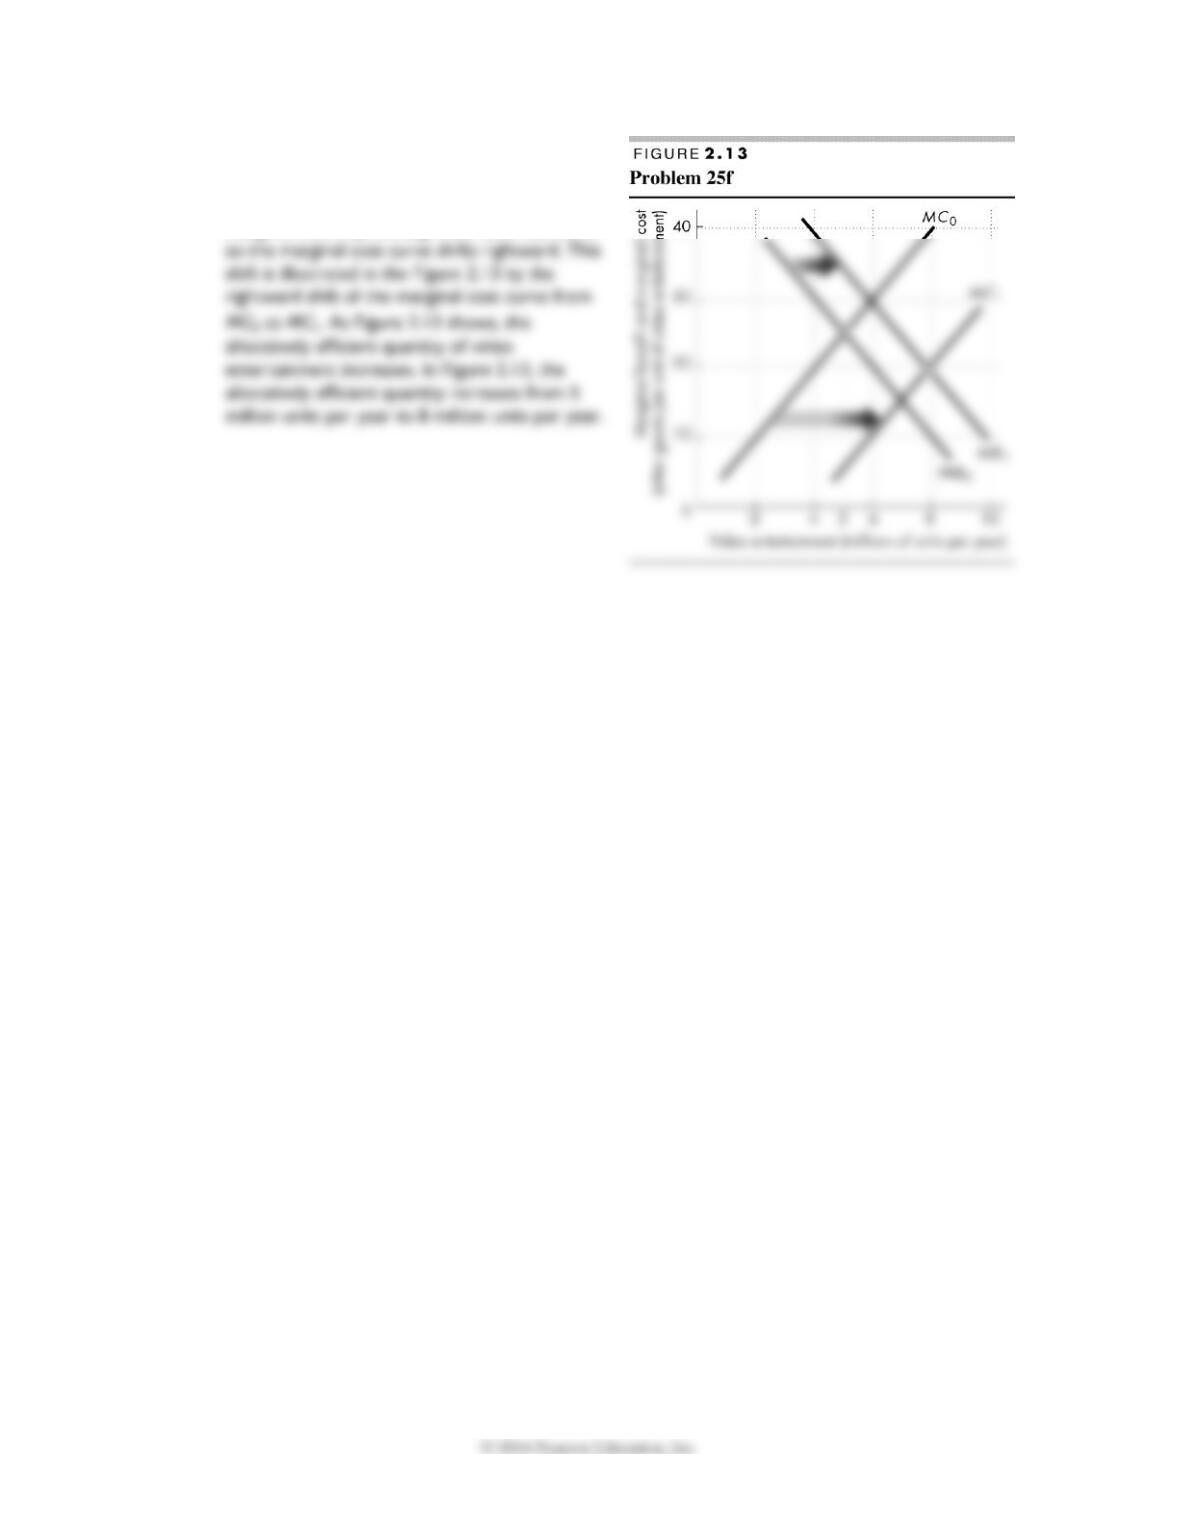
f. Explain how the efficient quantity of video
entertainment has changed.
The arrival of broadband has decreased the
marginal cost of providing video entertainment,