2 Trade and Technology: The Ricardian Model
1. In this problem you will use the World Development Indicators (WDI) database from the
World Bank to compute the comparative advantage of two countries in the major sectors of
gross domestic product (GDP): agriculture, industry (which includes manufacturing, mining,
construction, electricity, and gas), and services. Go to the WDI website at
http://wdi.worldbank.org, and choose “Online tables,” where you will be using the sections
on “People” and on the “Economy.”
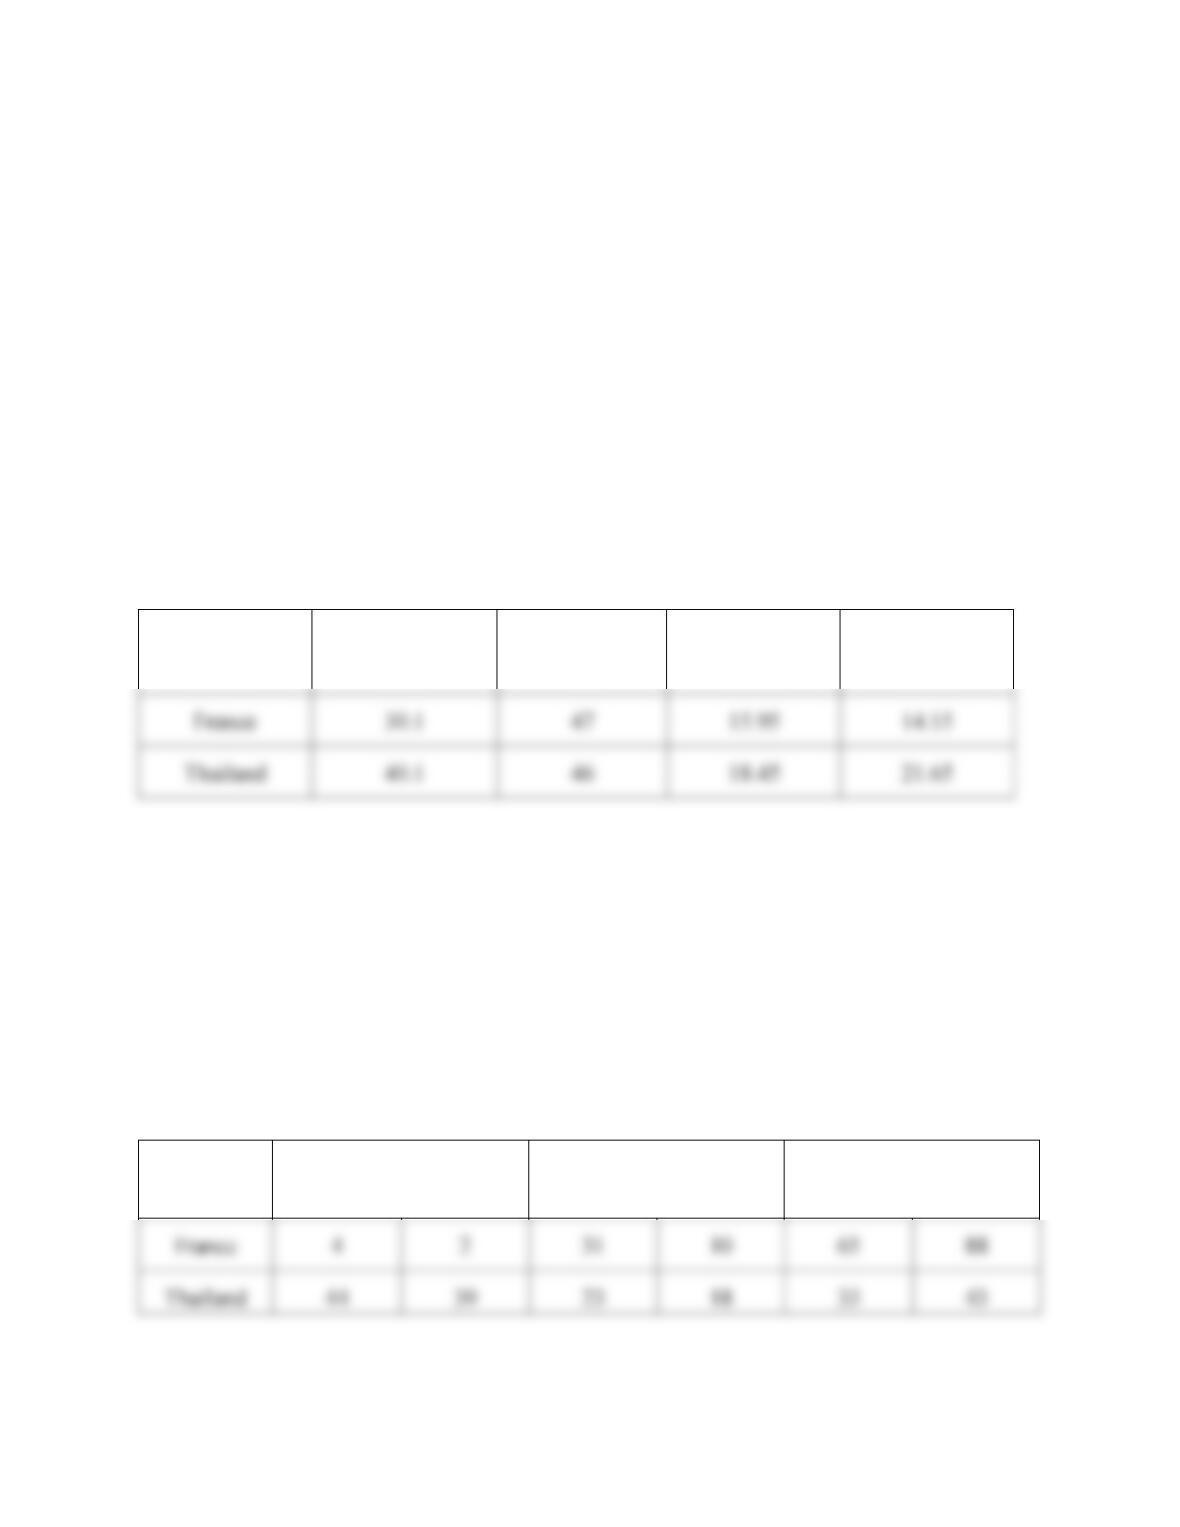
a. In the “People” section, start with the table “Labor force structure.” Choose two
countries that you would like to compare, and for a recent year write down their total
labor force (in millions) and the percentage of the labor force that is female. Then
calculate the number of the labor force (in millions) who are male and the number who
are female.
Answer:
2014
Labor Force
(million)
Female Labor
(%)
Male Labor
(million)
Female Labor
(million)
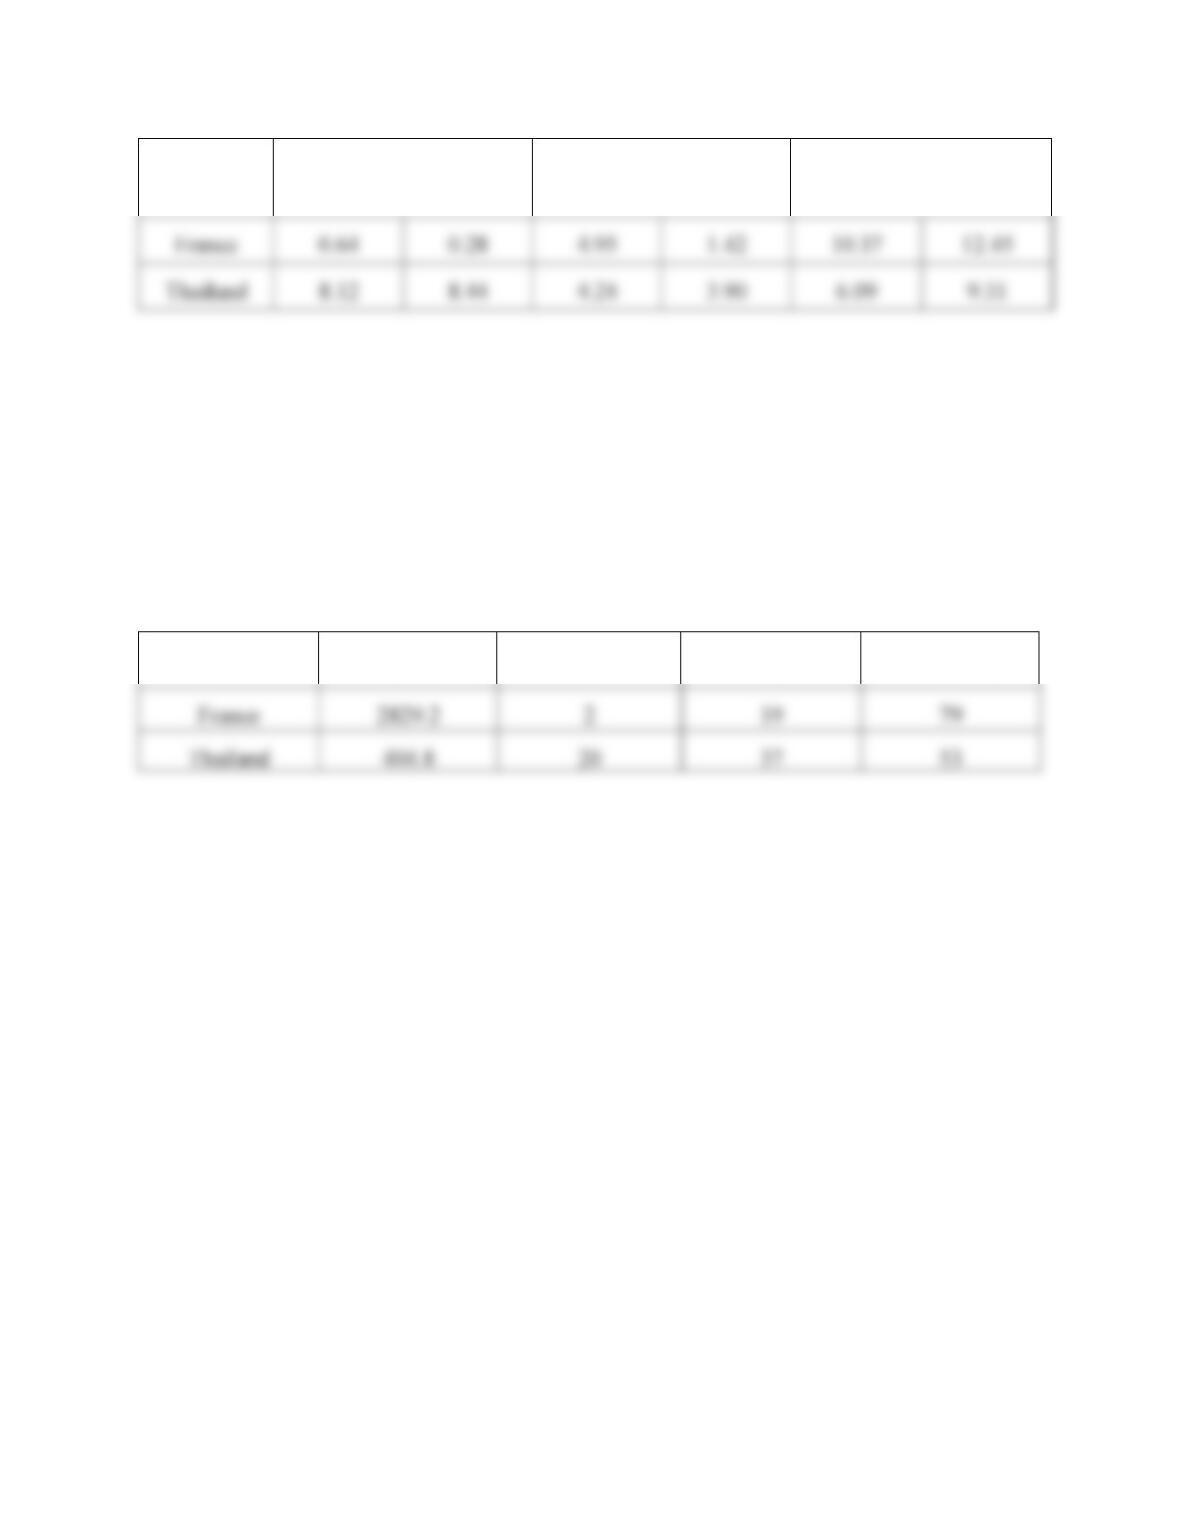
b. Again using the “People” section of the WDI, now go to the “Employment by sector”
table. For the same two countries that you chose in part (a) and for roughly the same year,
write down the percent of male employment and the percent of female employment in
each of the three sectors of GDP: agriculture, industry, and services. (If the data are
missing in this table for the countries that you chose in part (a), use different countries.)
Use these percentages along with your answer to part (a) to calculate the number of male
workers and the number of female workers in each sector. Add together the number of
male and female workers to get the total labor force in each sector.
Answer:
2011–2014
Agriculture
Male % Female %
Industry
Male % Female %
Service
Male % Female %
2011–2014
(million)
Agriculture
Male Female
Industry
Male Female
Service
Male Female
c. In the “Economy” section, go to the table “Structure of output.” There you will find
GDP (in $ billions) and the % of GDP in each of the three sectors: agriculture, industry,
and services. For the same two countries and the same year that you chose in part (a),
write down their GDP (in $ billions) and the percentage of their GDP accounted for by
agriculture, by industry, and by services. Multiply GDP by the percentages to obtain the
dollar amount of GDP coming from each of these sectors, which is interpreted as the
value-added in each sector, that is, the dollar amount that is sold in each sector minus the
cost of materials (not including the cost of labor or capital) used in production.
Answer:
2014
GDP (billion $)
Agriculture (%)
Industry (%)
Service (%)
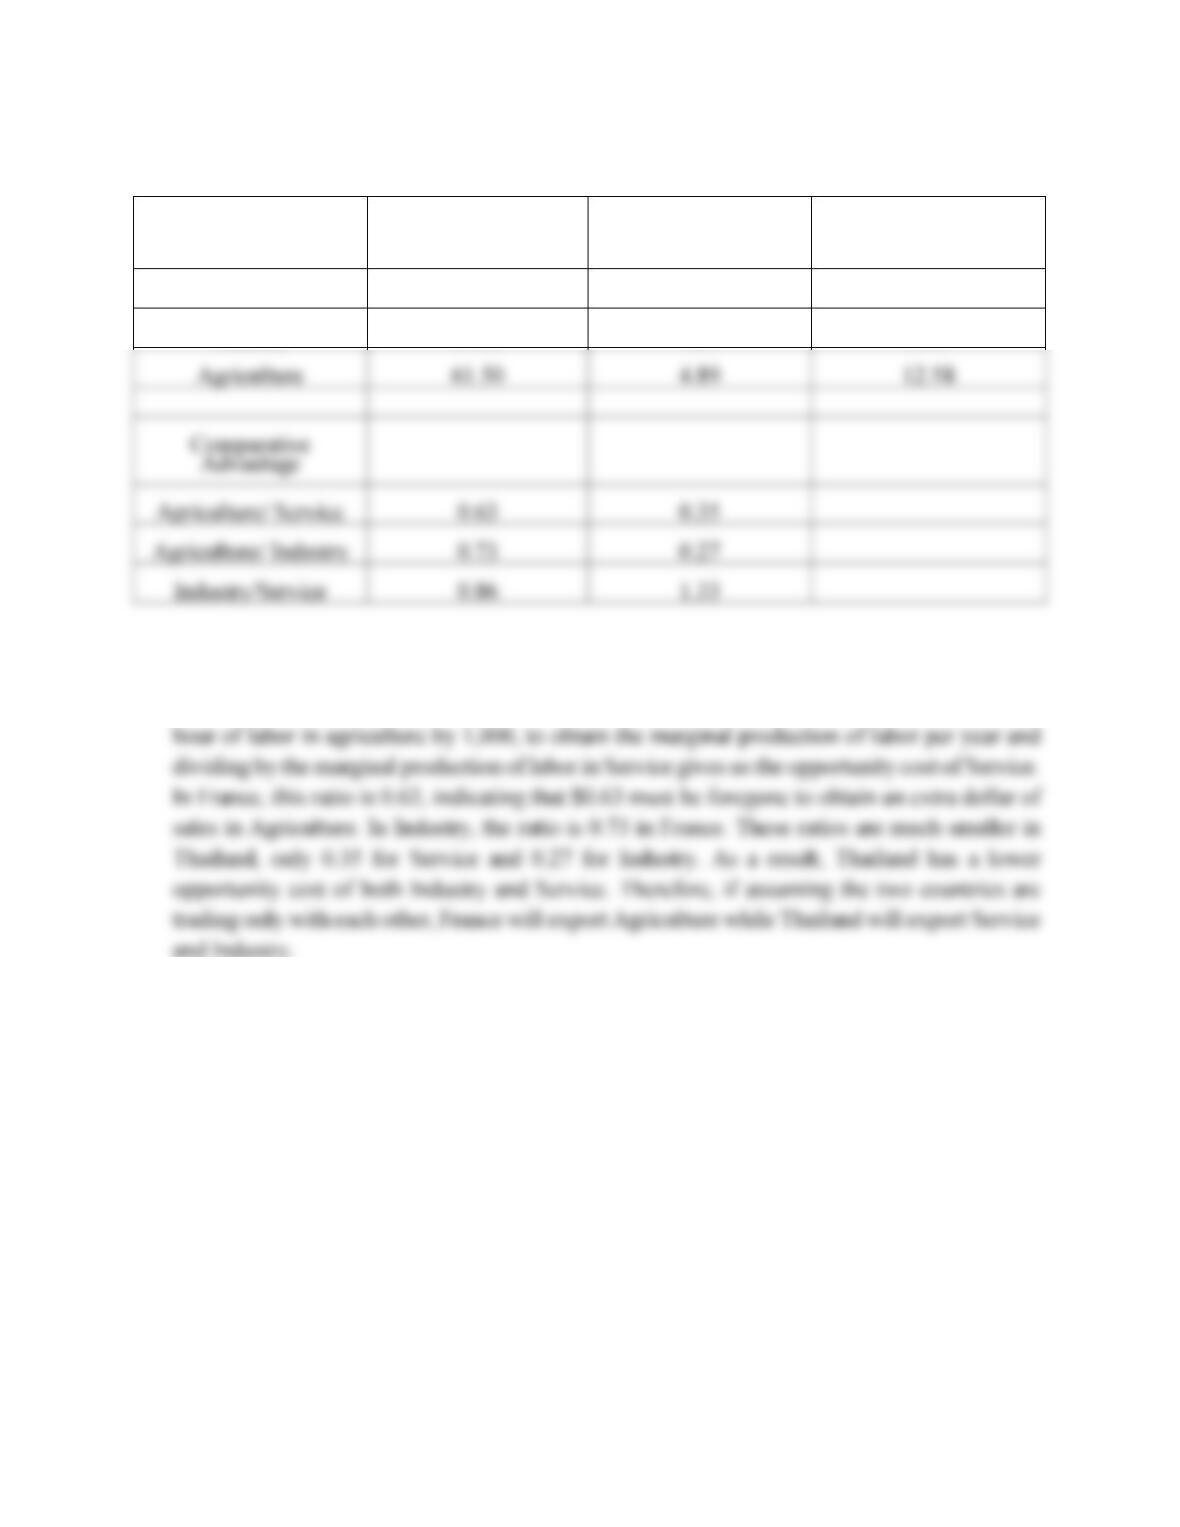
d. Using your results from parts (b) and (c), divide the GDP from each sector by the labor
force in each sector to obtain the value-added per worker in each sector. Arrange these
numbers in the same way as the “Sales/Employee” and “Bushels/Worker” shown in
Table 2-2. Then compute the absolute advantage of one country relative to the other in
each sector, as shown on the right-hand side of Table 2-2. Interpret your results. Also
compute the comparative advantage of agriculture/industry and agriculture/services (as
shown at the bottom of Table 2-2), and the comparative advantage of industry/services.
Based on your results, what should be the trade pattern of these two countries if they
were trading only with each other?
Answer:
($1000)
France
Thailand Absolute Advantage
France/Thailand Ratio
Service
97.94
13.93
7.03
Industry
84.39
18.4
4.59
Thailand has a comparative advantage in both Service and Industry. Suppose that a farmer
spends 1,000 hours per year in agriculture production. Multiplying the marginal product of an
2. At the beginning of the chapter, there is a brief quotation from David Ricardo; here is a
longer version of what Ricardo wrote:
England may be so circumstanced, that to produce the cloth may require
the labour of 100 men for one year; and if she attempted to make the
wine, it might require the labour of 120 men for the
same
time. . . . To
produce the wine in Portugal, might require only the labour of 80 men for
one year, and to produce the cloth in the
same
country, might require the
labour of 90 men for the
same
time. It would therefore be
advantageous
for
her to export wine in exchange for cloth. This exchange might even take
0.35
0.27
1.33
place, notwithstanding that the commodity imported by Portugal could be
produced there with less labour than in England.
Suppose that the amount of labor Ricardo describes can produce 1,000 yards
of cloth or 2,000 bottles of wine in either country. Then answer the
following:
a. What is England’s marginal product of labor in cloth and in wine, and
what is Portugal’s marginal product of labor in cloth and in wine?
Which country has absolute advantage in cloth, and in wine, and why?
Answer: In England, 100 men produce 1,000 yards of cloth, so MPLC =
b. Use the formula PW/PC = MPLC/MPLW to compute the no-trade relative price of wine
in each country. Which country
has comparative advantage
in wine, and why?
Answer: For England,
P
W
/P
C
=
MPL
C
/MPL
W
=
10/16.6
=
0.6, which
is
the no-
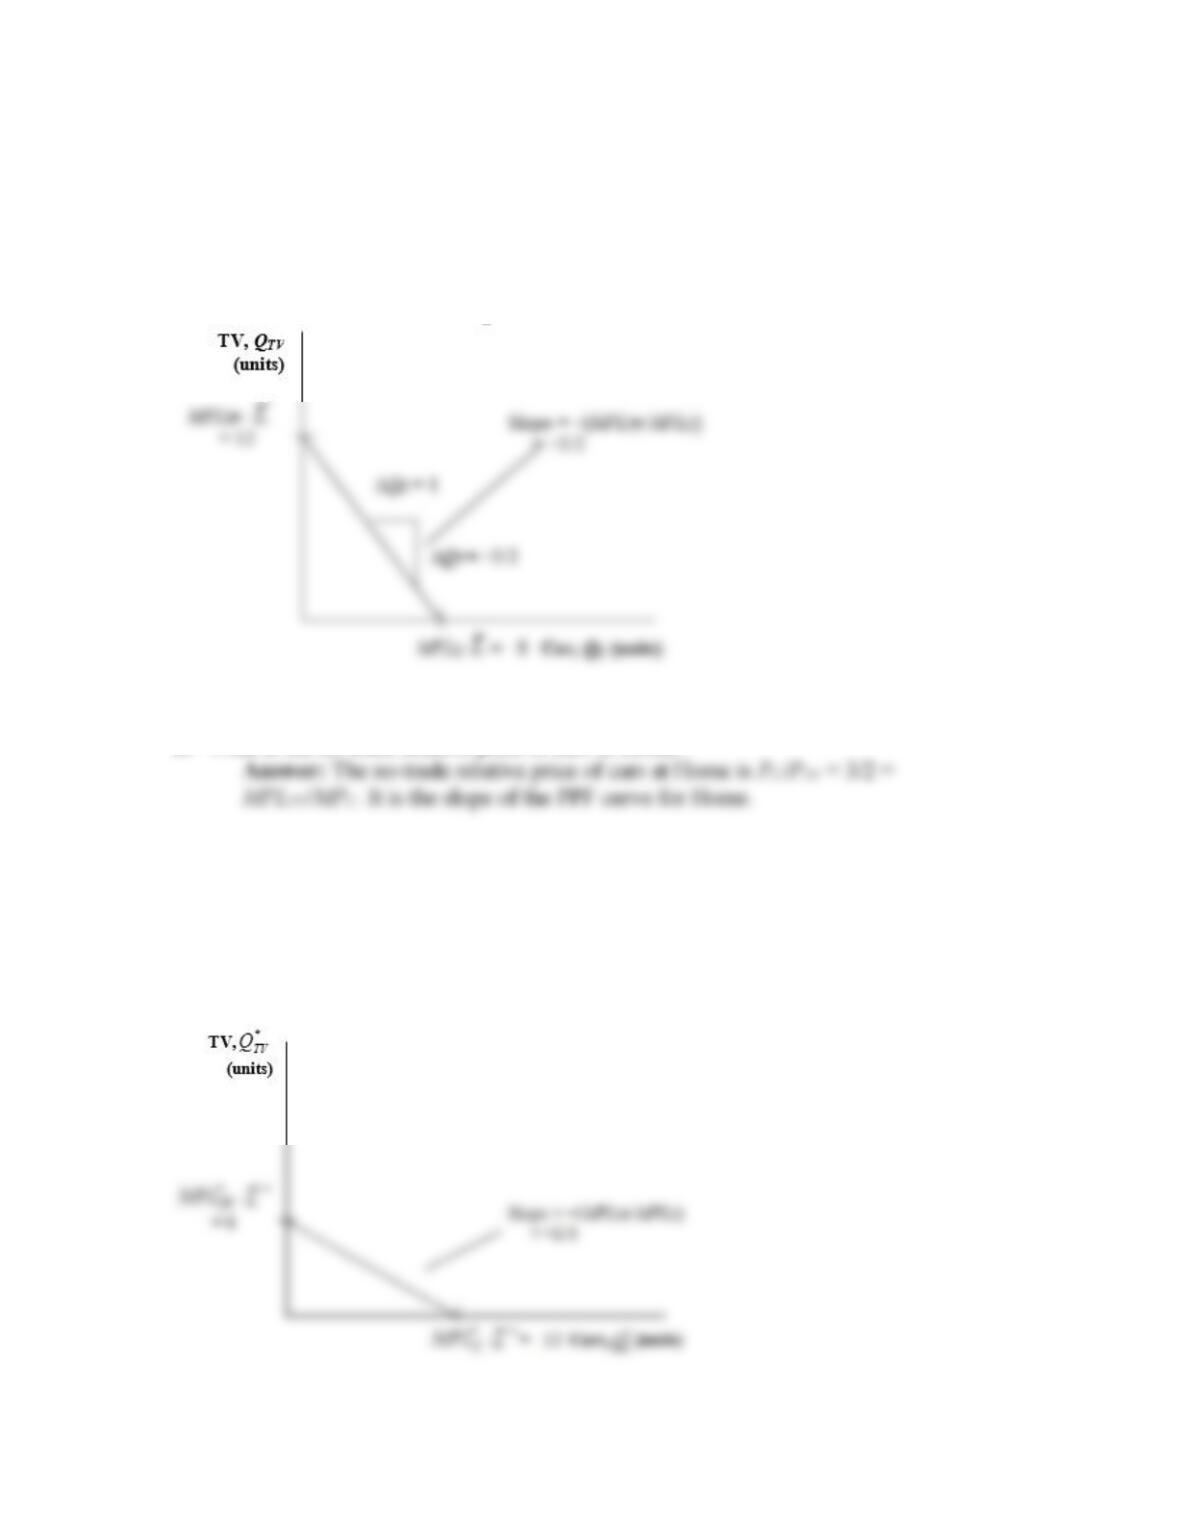
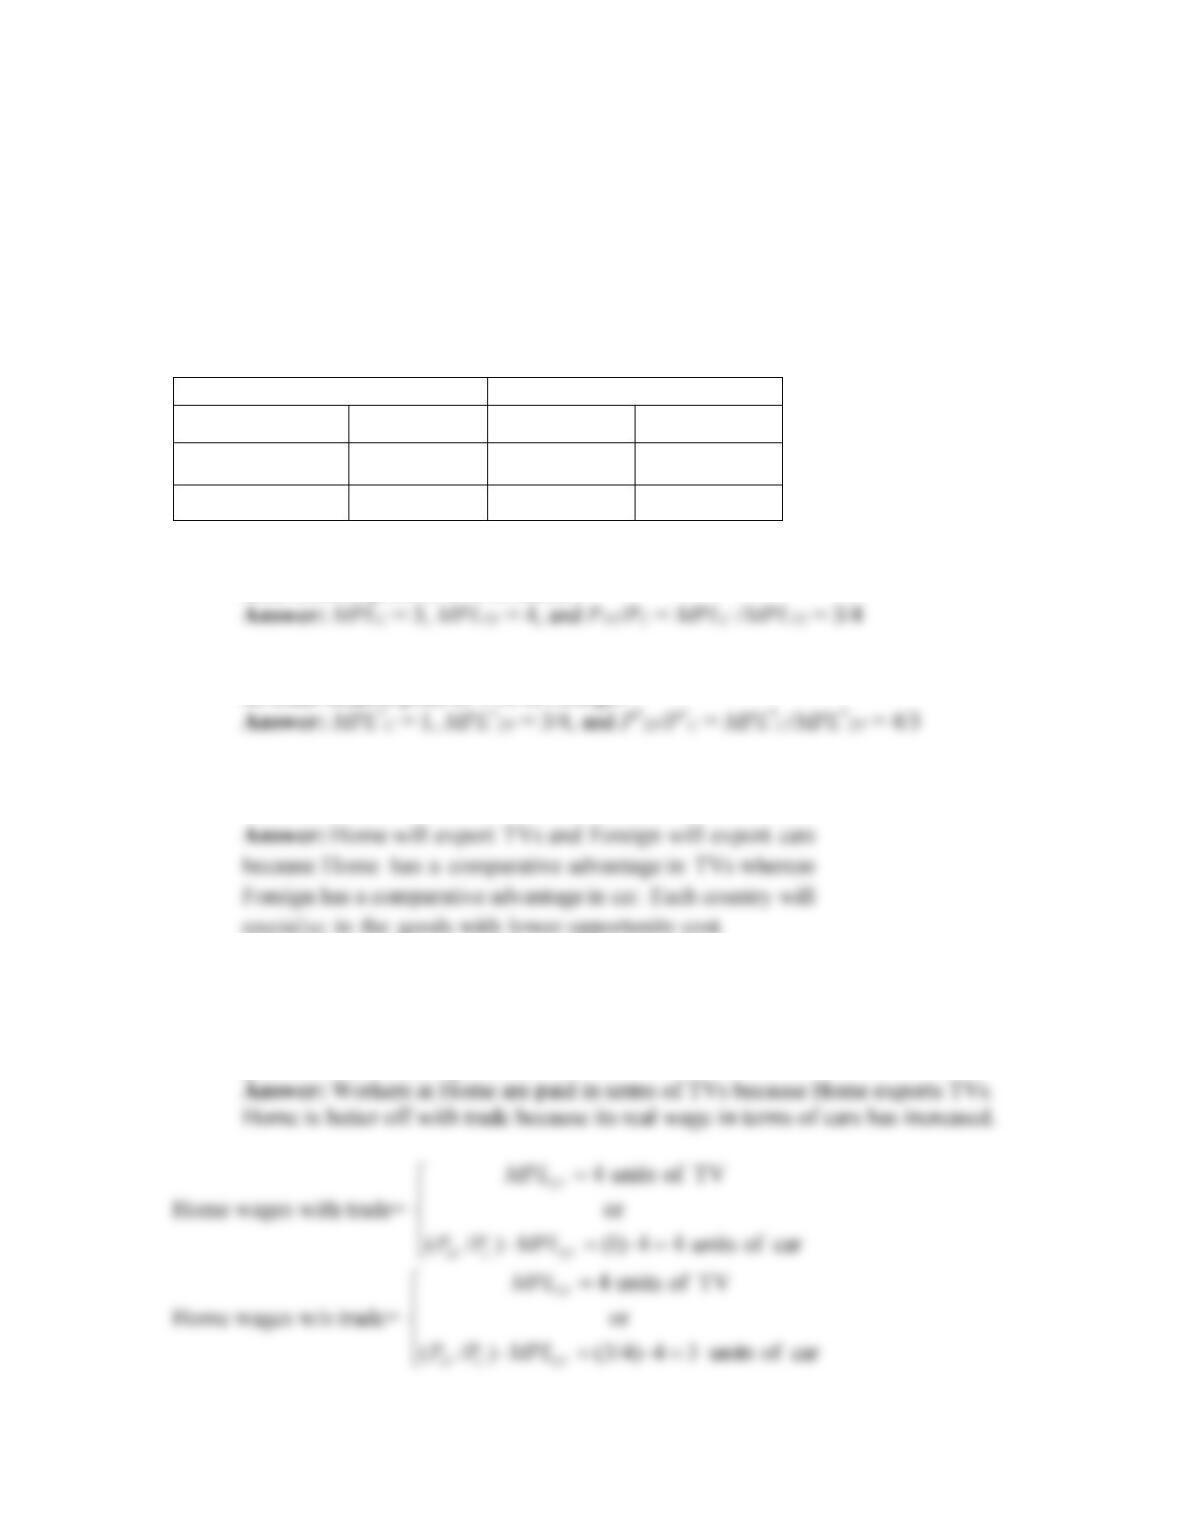
3. Suppose that each worker in Home can produce two cars or three TVs. Assume that
Home has four workers.
a. Graph the production possibilities frontier for Home.
Answer: See the following figure.
b. What is the no-trade relative price of cars in Home?
4. Suppose that each worker in Foreign can produce three cars or two TVs. Assume that
Foreign also has four workers.
a. Graph the production possibilities frontier for Foreign.
Answer: See following figure.
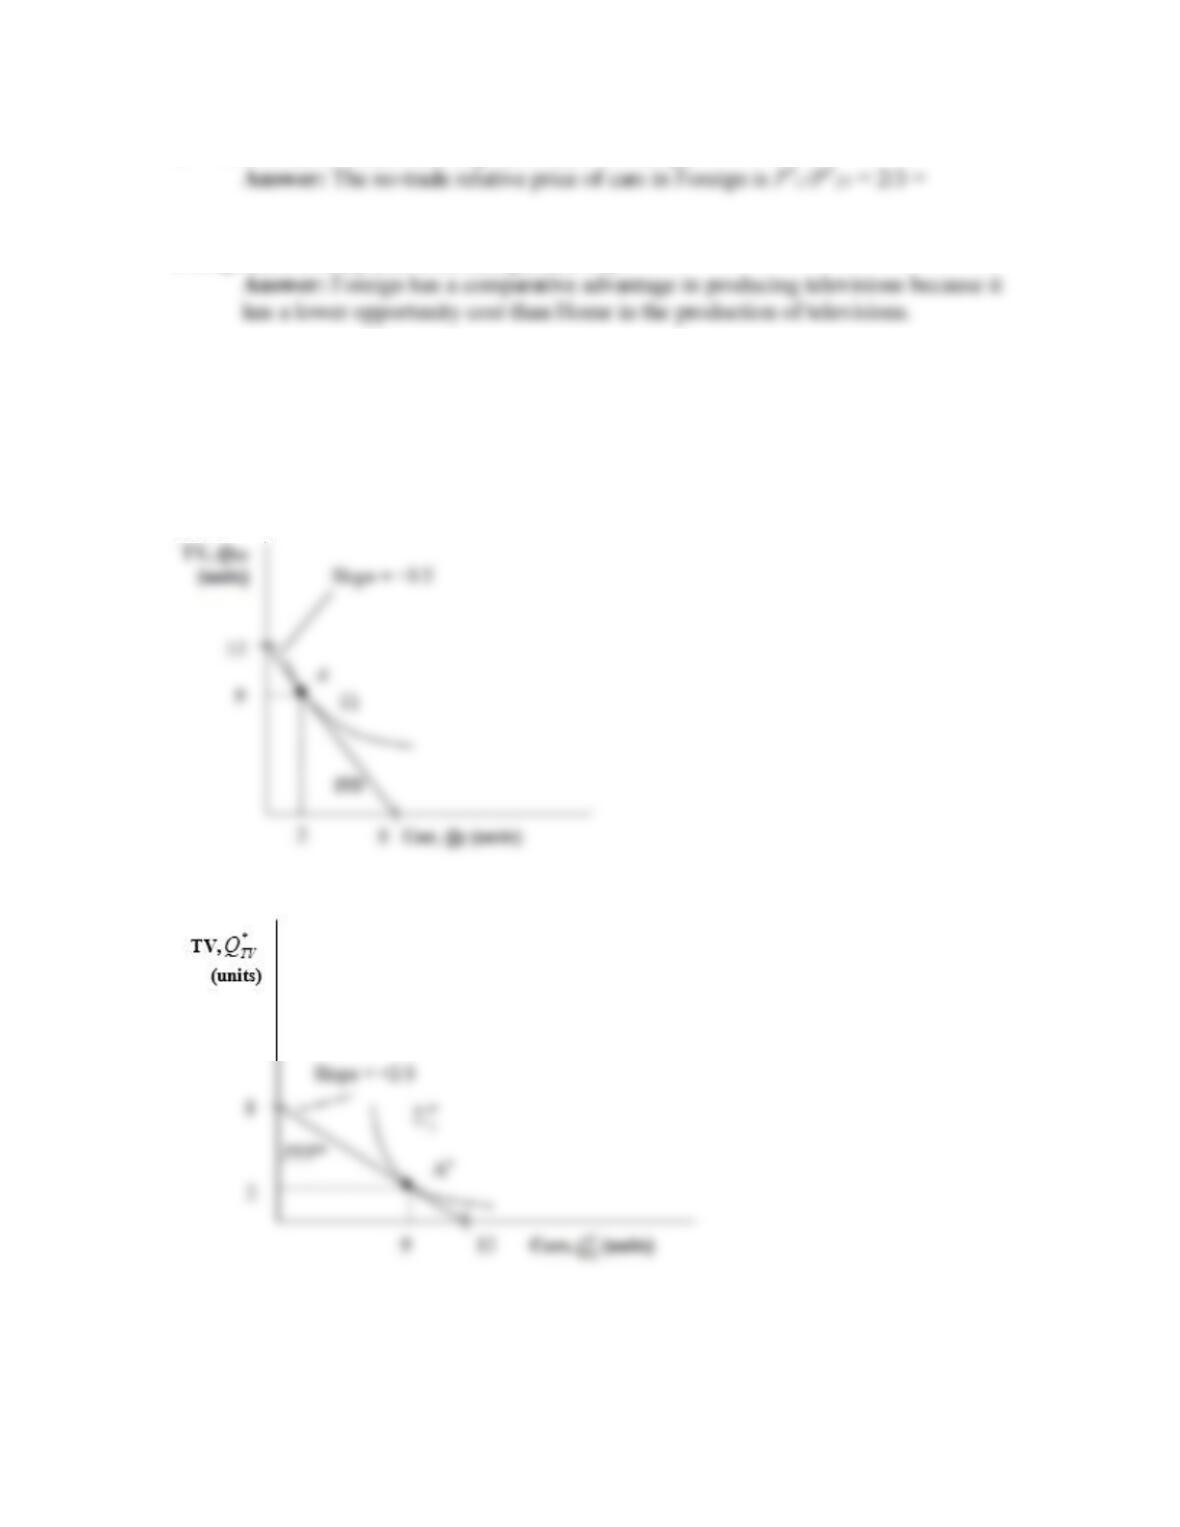
b. What is the no-trade relative price of cars in Foreign?
c. Using the information provided in Problem 3 regarding Home, in which good does
Foreign have a comparative advantage, and why?
5. Suppose that in the absence of trade, Home consumes two cars and nine TVs, while
Foreign consumes nine cars and two TVs. Add the indifference curve for each
country to the figures in Problems 3 and 4. Label the production possibilities frontier
(PPF), indifference curve (U1), and the no-trade equilibrium consumption and
production for each country.
Answer: See following figures.
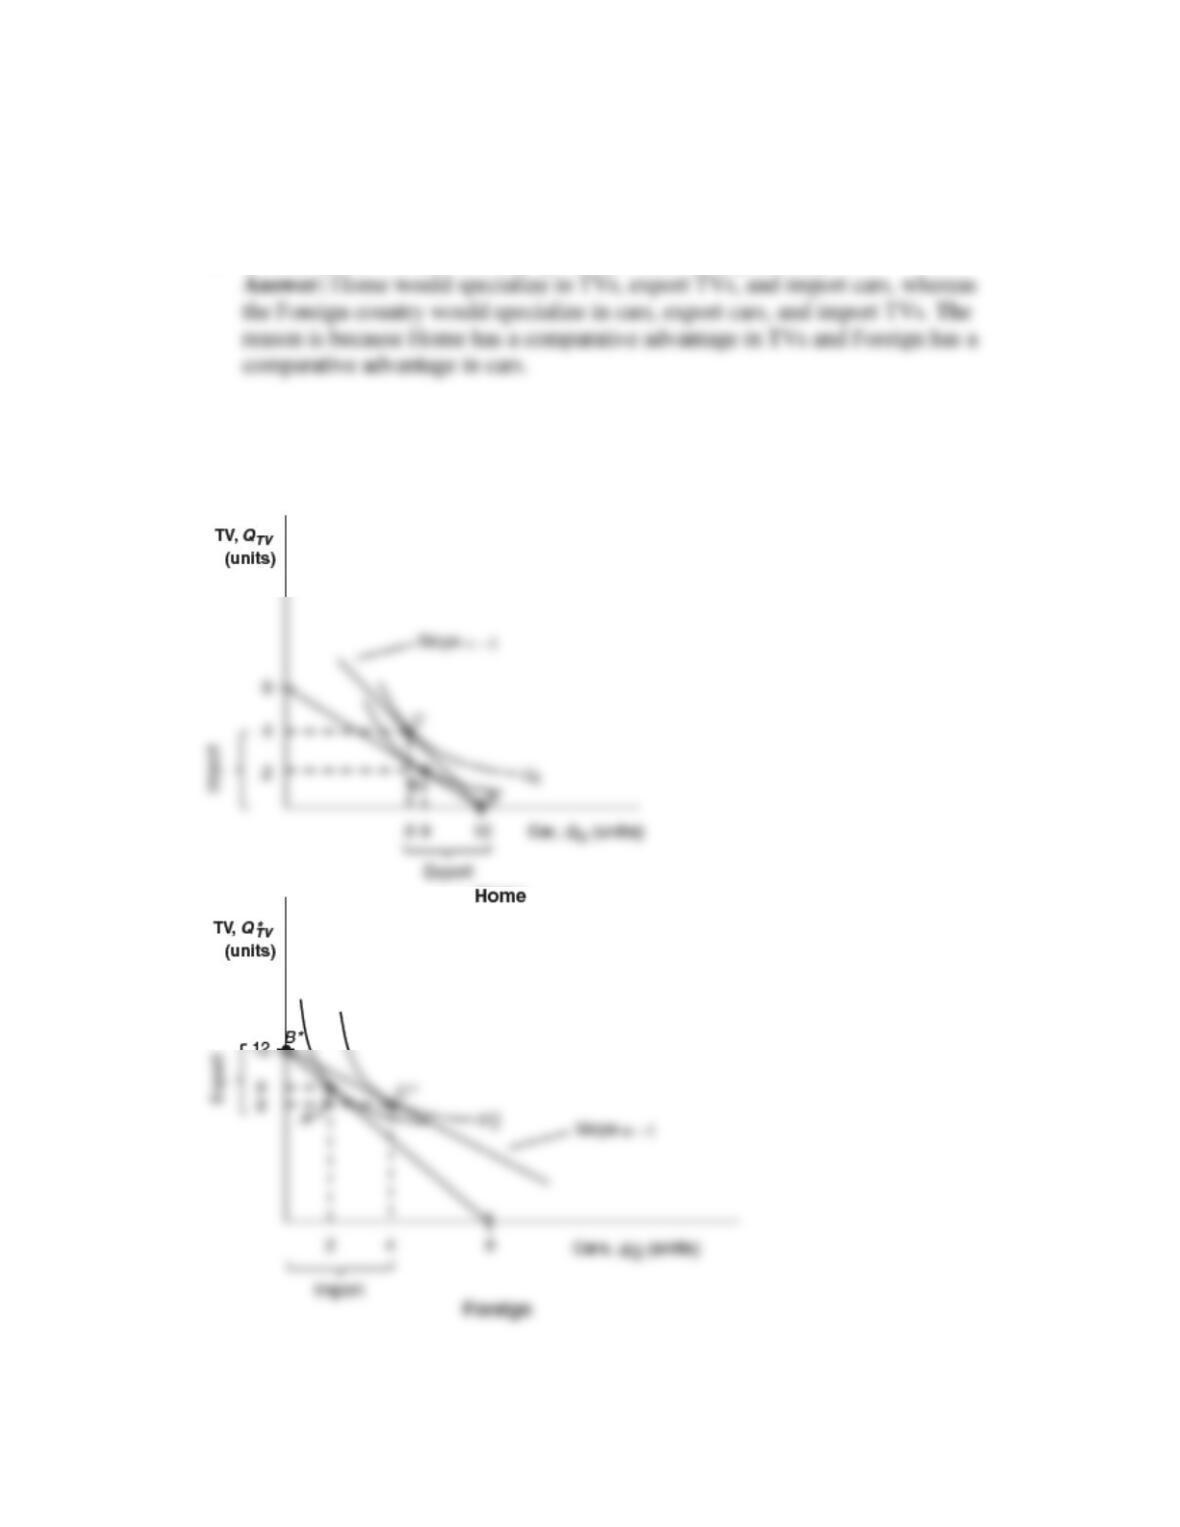
6. Now suppose the world relative price of cars is PC/PTV = 1.
a. In what good will each country specialize? Briefly explain why.
b. Graph the new world price line for each country in the figures in Problem 5, and
add a new indifference curve (U2) for each country in the trade equilibrium.
Answer: See the following figures.
c. Label the exports and imports for each country. How does the amount of Home
exports compare with Foreign imports?
d. Does each country gain from trade? Briefly explain why or why not.
Work It Out
Answer the following questions using the information given by the accompanying
table.
Home
Foreign
Absolute Advantage
Number of bicycles
produced per hour
4
6
?
Number of snowboards
produced per hour
6
8
?
Comparative Advantage
?
?
a. Complete the table for this problem in the same manner as Table 2-2.
Answer: See previous table.
b. Which country has an absolute advantage in the production of bicycles? Which
country has an absolute advantage in the production of snowboards?
c. What is the opportunity cost of bicycles in terms of snowboards in Home? What
is the opportunity cost of bicycles in terms of snowboards in Foreign?
d. Which product will Home export, and which product does Foreign export? Briefly
explain why.
7. Assume that Home and Foreign produce two goods, TVs and cars, and use the
information below to answer the following questions:
In the No-Trade equilibrium:
Home
Foreign
Wage
TV
= 12
Wage
C
= ?
Wage*
TV
= ?
Wage*
C
= 6
MPL
TV
= 4
MPL
C
= ?
MPL*
TV
= ?
MPL*
C
= 1
P
TV
= ?
P
C
= 4
P*
TV
= 8
P*
C
= ?
a. What is the marginal product of labor for TVs and cars in Home? What is the no-
trade relative price of TVs in Home?
b. What is the marginal product of labor for TVs and cars in Foreign? What is the
no-trade relative price of TVs in Foreign?
c. Suppose the world relative price of TVs in the trade equilibrium is PTV/PC = 1.
Which good will each country export? Briefly explain why.
specialize
in the goods with lower opportunity cost.
d. In the trade equilibrium, what is the real wage in Home in terms of cars and in
terms of TVs? How do these values compare with the real wage in terms of either
good in the no-trade equilibrium?
e. In the trade equilibrium, what is the real wage in Foreign in terms of TVs and in
terms of cars? How do these values compare with the real wage in terms of either
good in the no-trade equilibrium?
Answer: Foreign workers are paid in terms of cars because Foreign exports cars.
Foreign gains in terms of cars with trade.
f. In the trade equilibrium, do Foreign’s workers earn more or less than Home’s
workers, measured in terms of their ability to purchase goods? Explain why.
8. Why do some low-wage countries, such as China, pose a threat to manufacturers in
industrial countries, such as the United States, whereas other low-wage countries,
such as Haiti, do not?
Answer: To engage in international trade, a country must have a minimal threshold
Answer Problems 9 to 11 using the chapter information for Home and Foreign.
9. a. Suppose that the number of workers doubles in Home. What happens to the Home
PPF and what happens to the no-trade relative price of wheat?
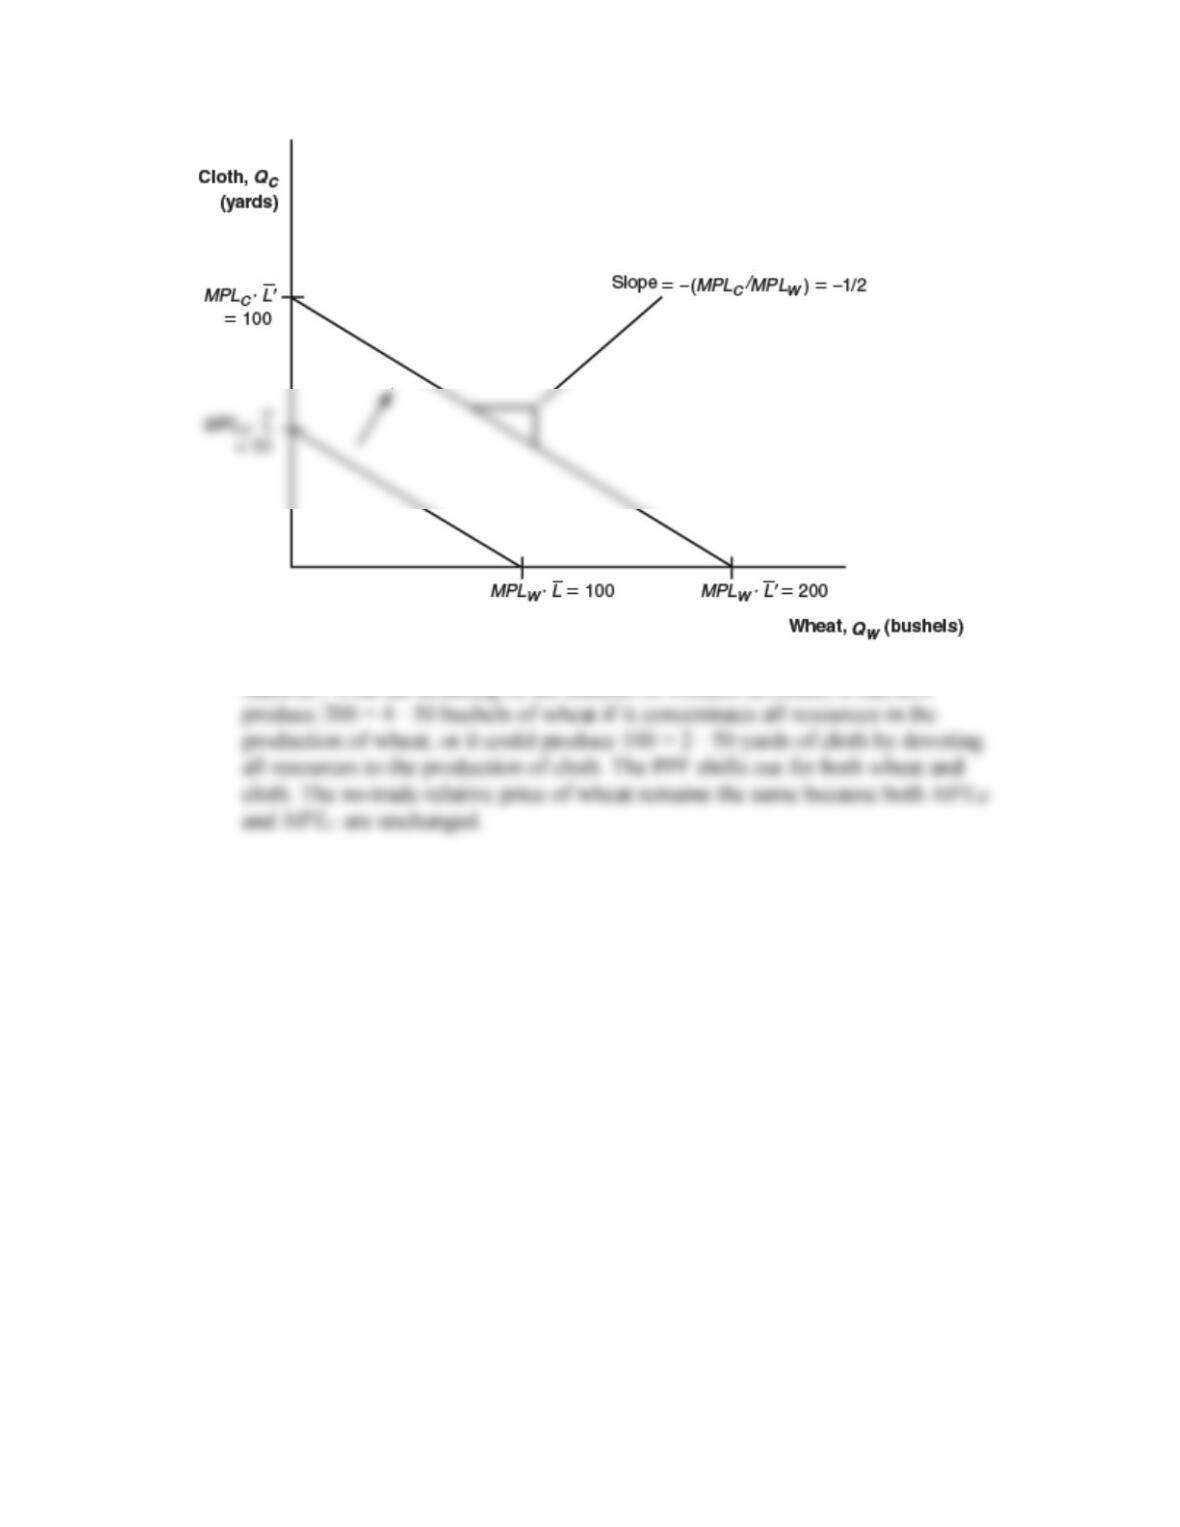
Answer: With the doubling of the number of workers in Home, it can now
b. Suppose that there is technological progress in the wheat industry such that Home
can produce more wheat with the same amount of labor. What happens to the
Home PPF and what happens to the relative price of wheat? Describe what would
happen if a similar change occurred in the cloth industry.
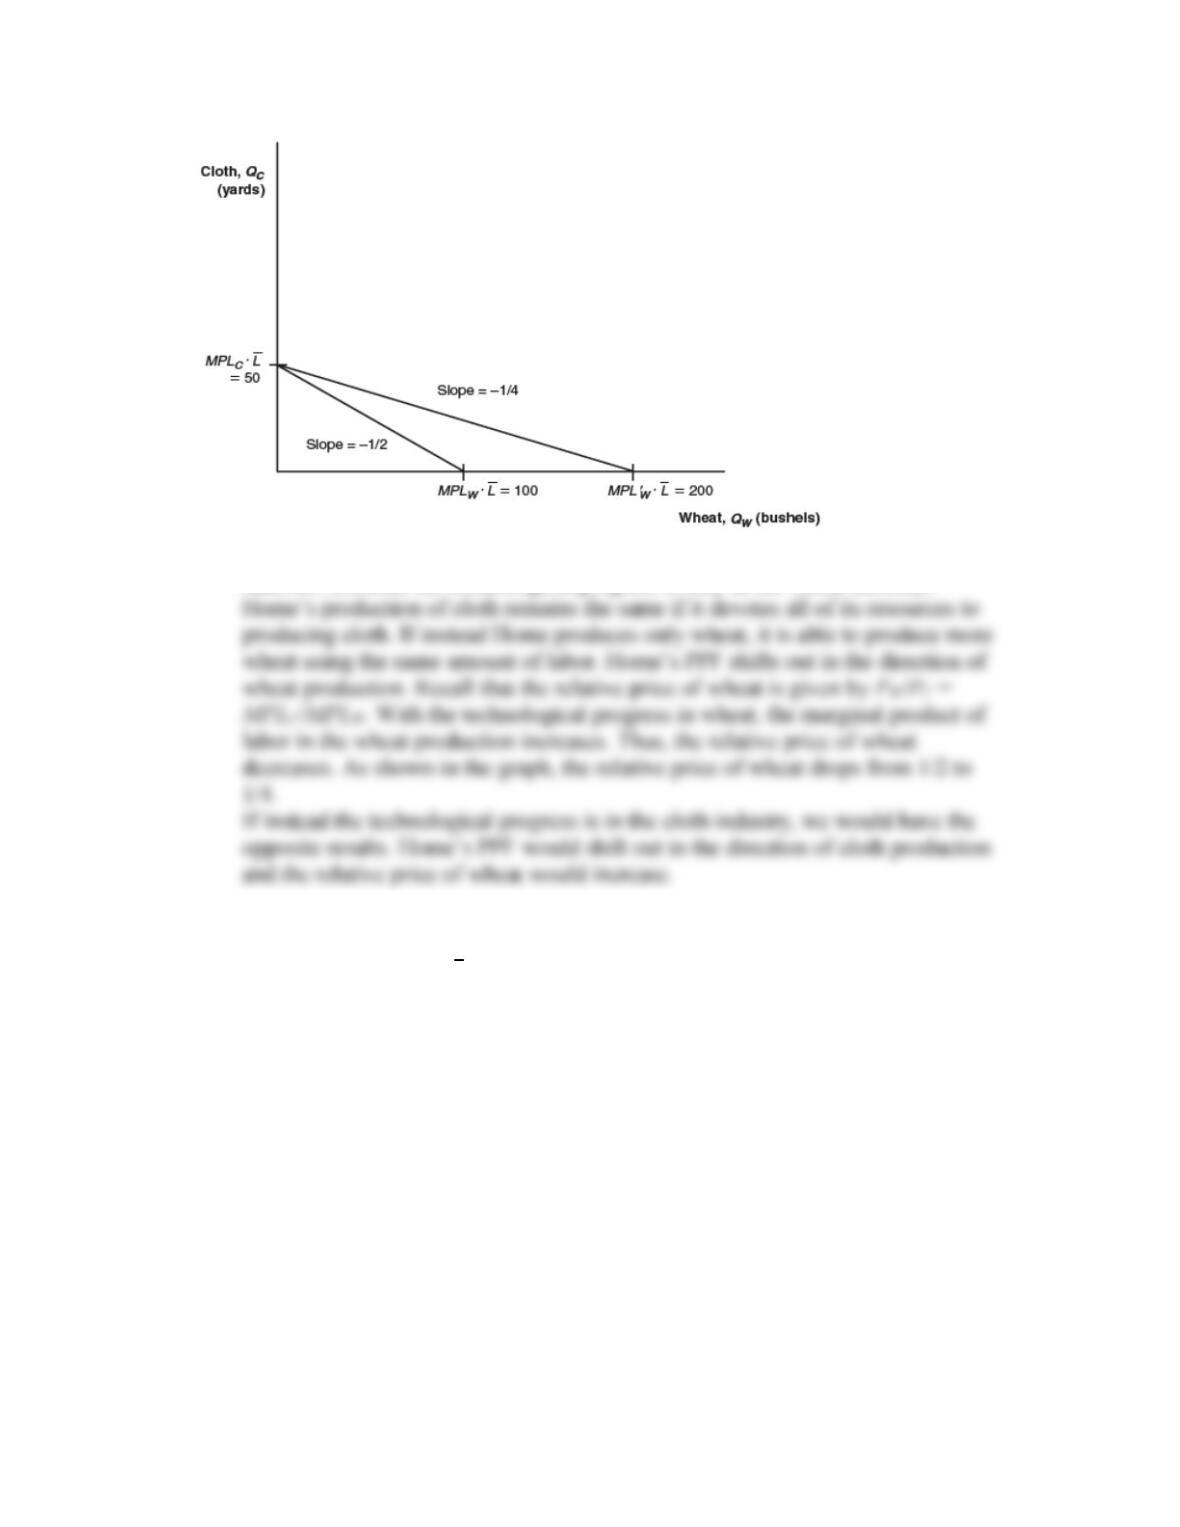
Answer: Because the technological progress is only in the wheat industry,
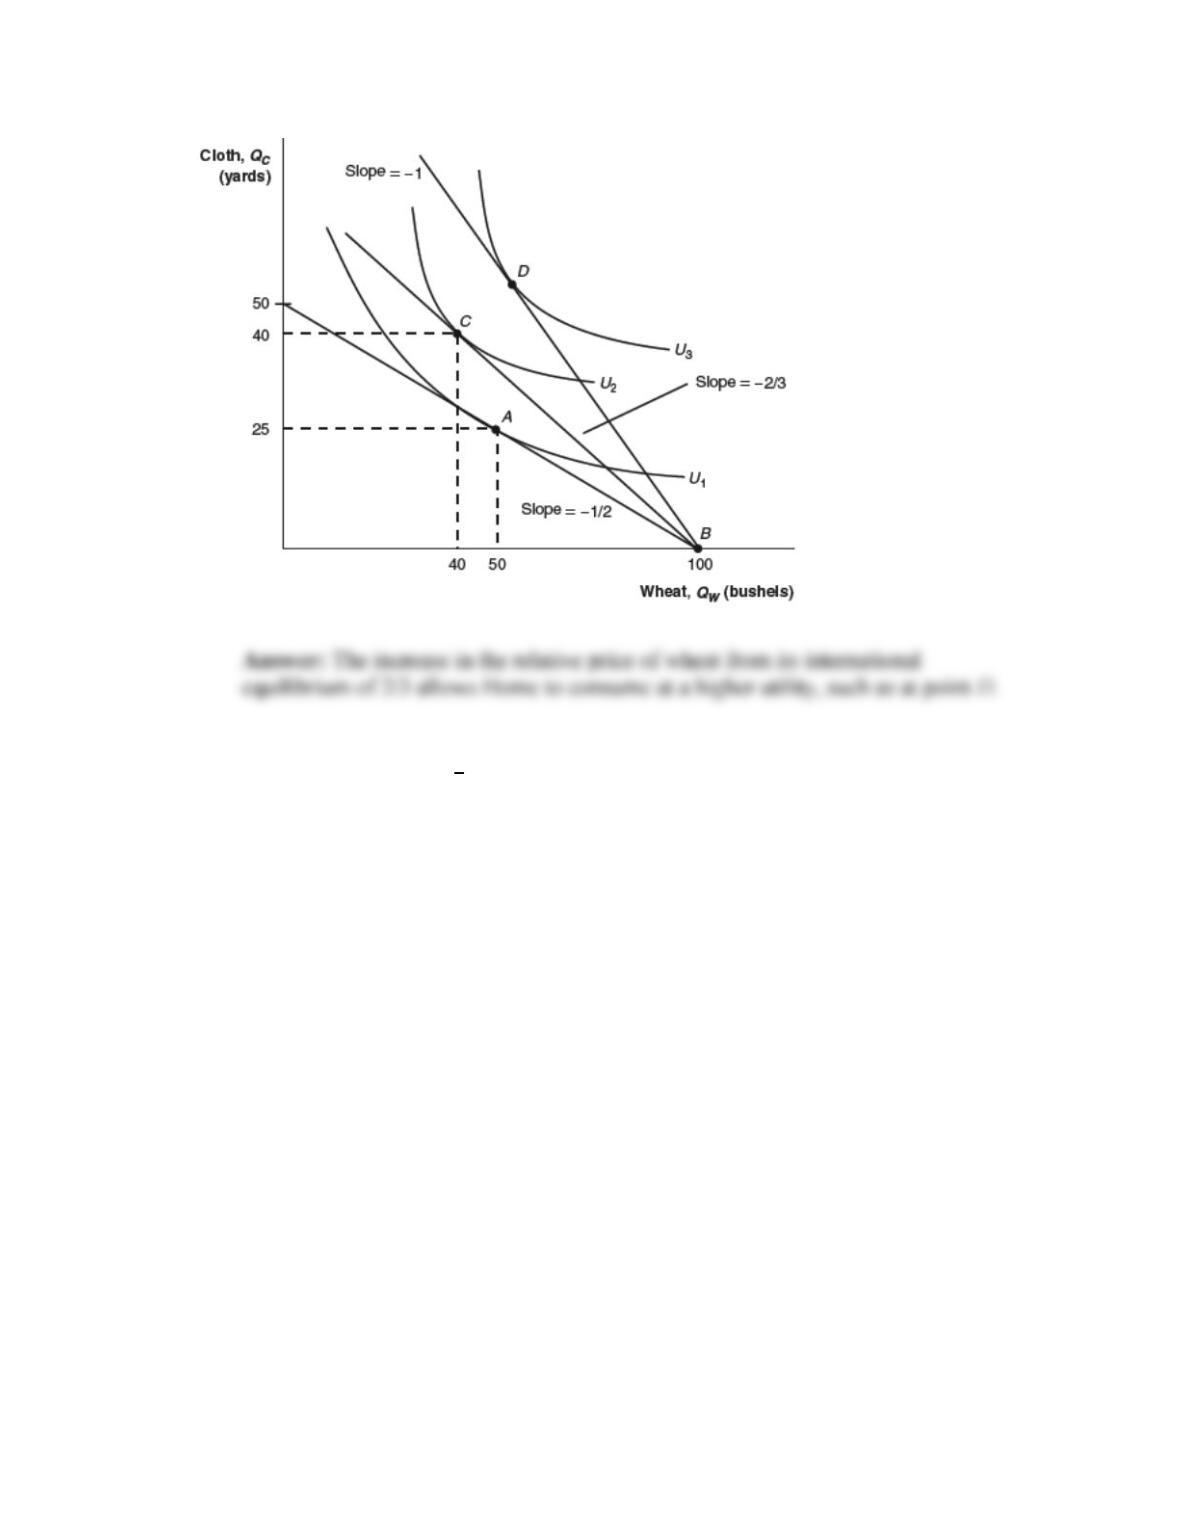
10. a. Using Figure 2–5, show that an increase in the relative price of wheat from its
world relative price of 2
3 will raise Home’s utility.
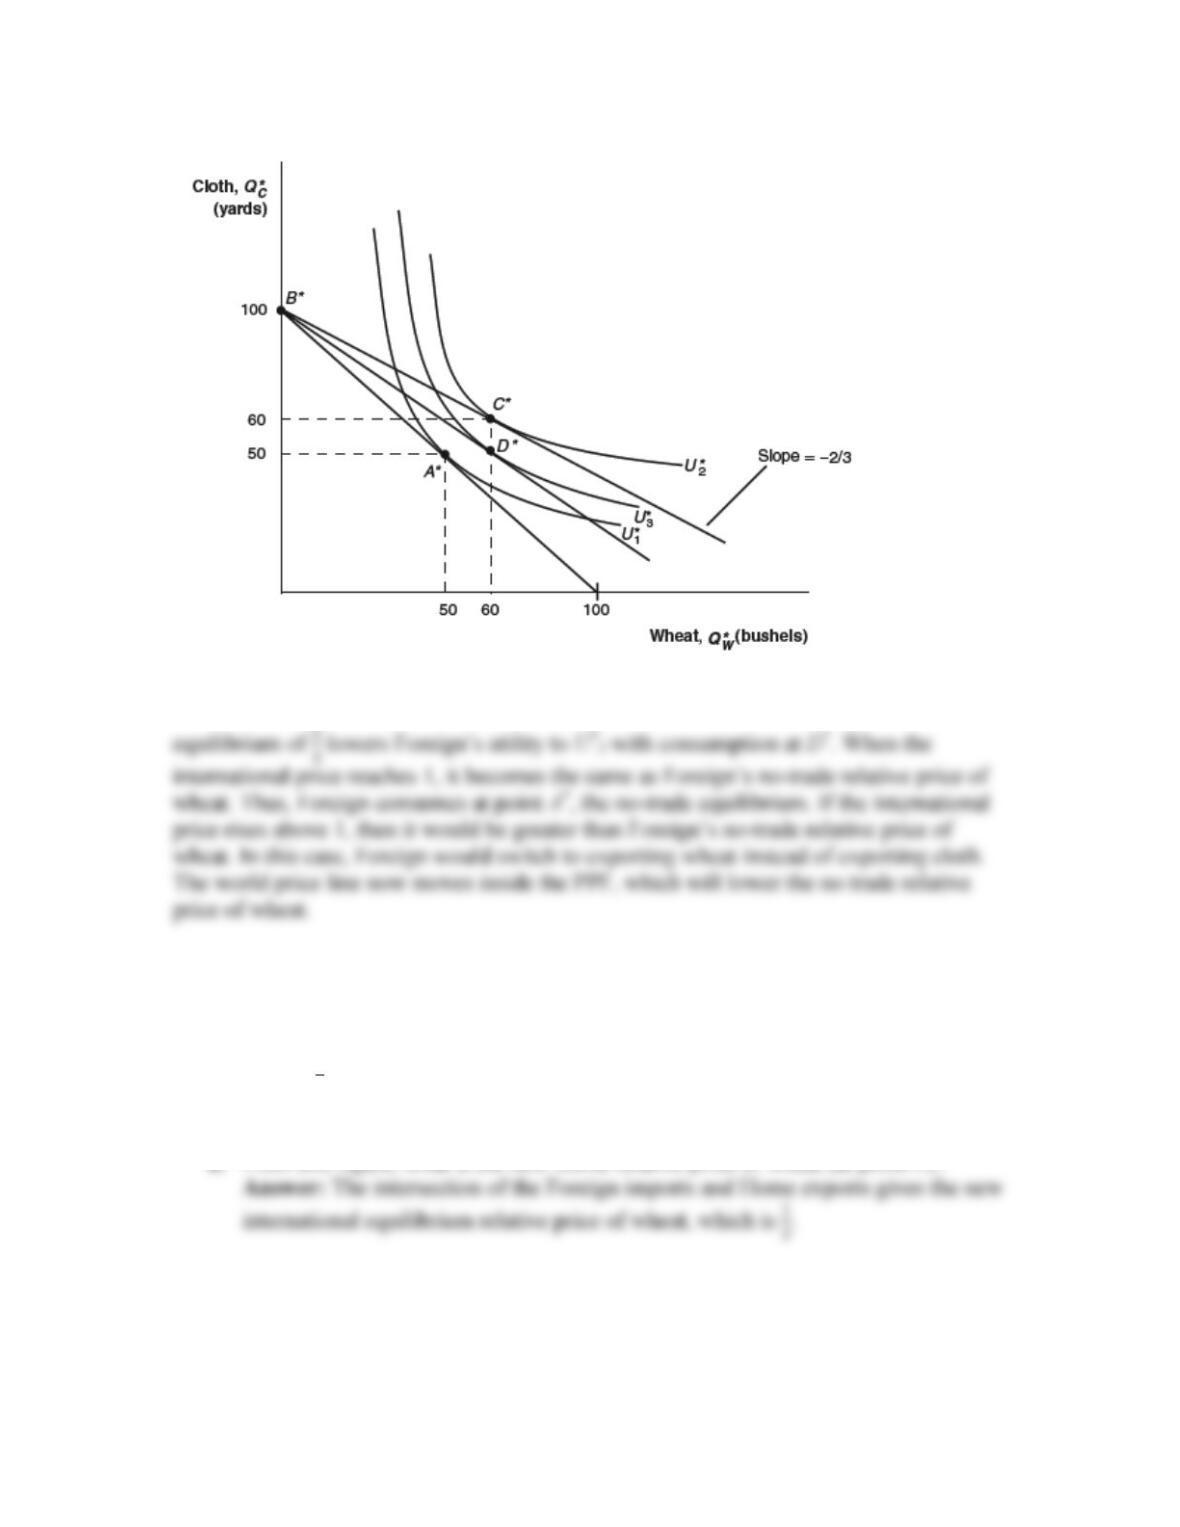
b. Using Figure 2–6, show that an increase in the relative price of wheat from its
world relative price of 2
3will lower Foreign’s utility. What is Foreign’s utility
when the world relative price reaches 1, and what happens in Foreign when the
world relative price of wheat rises above that level?
Answer: The increase in the relative price of wheat from its international
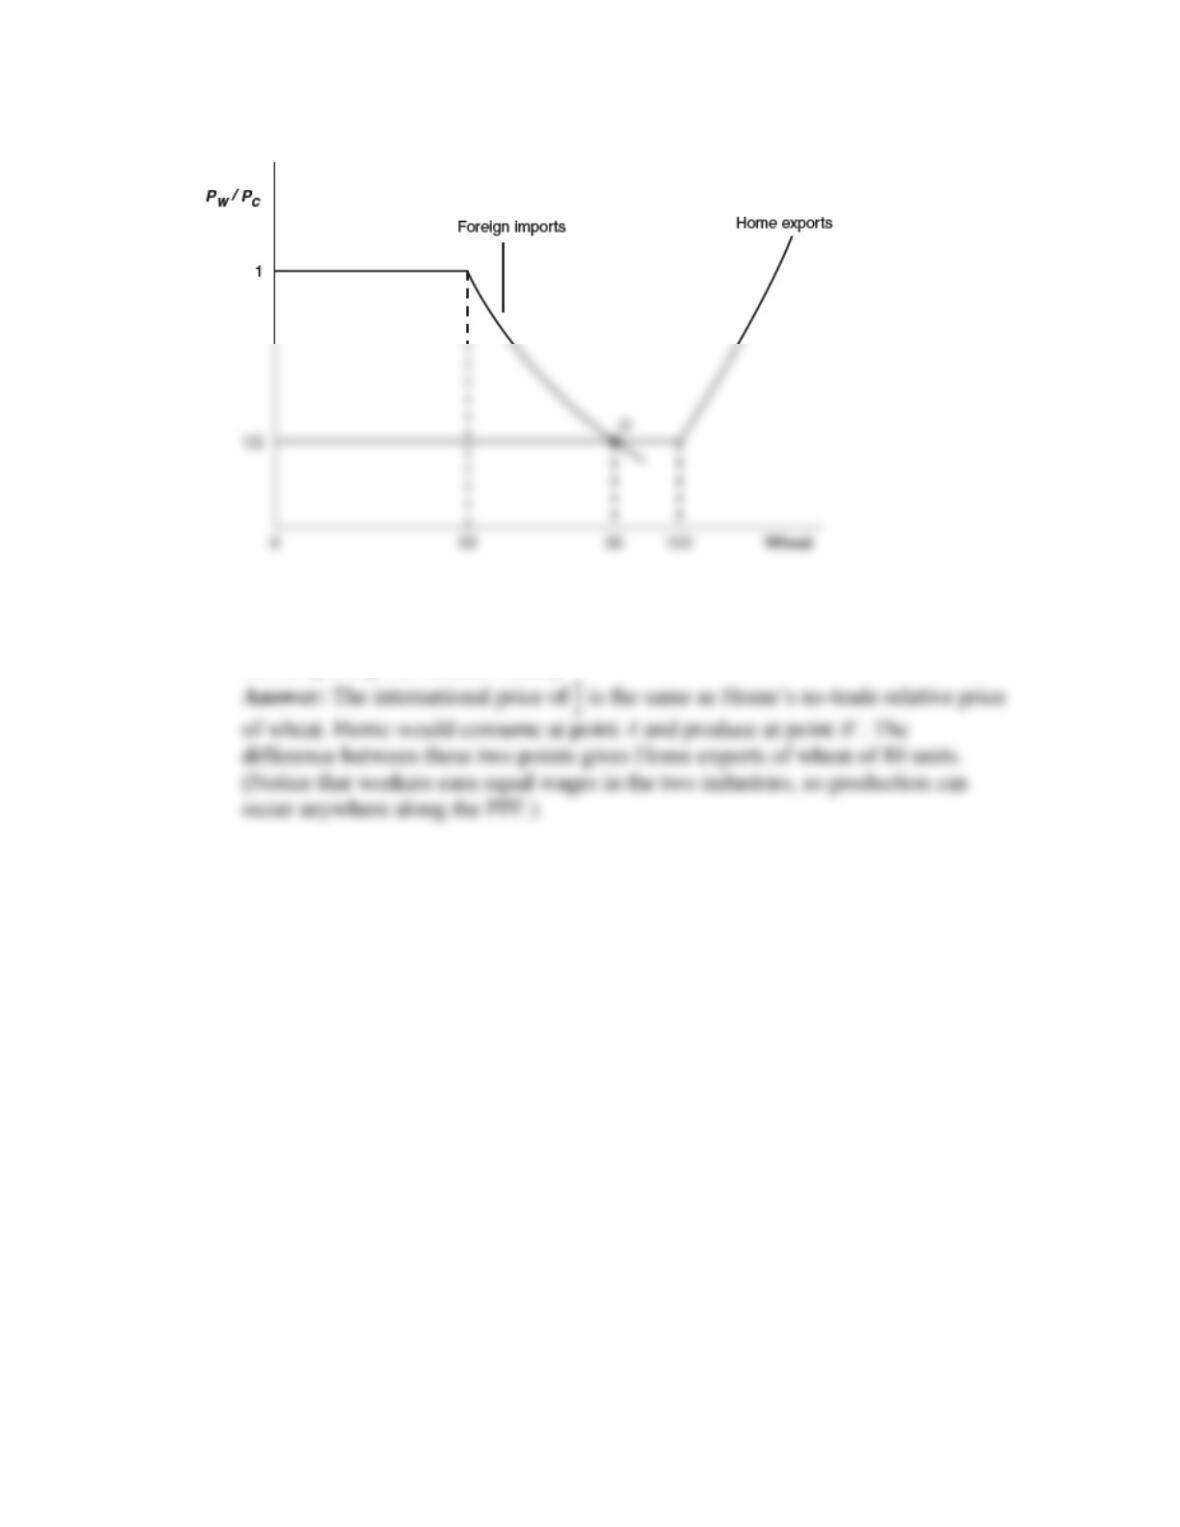
11. (This is a harder question.) Suppose that Home is much larger than Foreign. For
example, suppose we double the number of workers in Home from 25 to 50. Then,
suppose that Home is willing to export up to 100 bushels of wheat at its no-trade price
of PW/PC = 1
2, rather than 50 bushels of wheat as shown in Figure 2-11. In the
following figure, we draw a new version of Figure 2-11, with the larger Home.
a. From this figure, what is the new world relative price of wheat (at point D)?
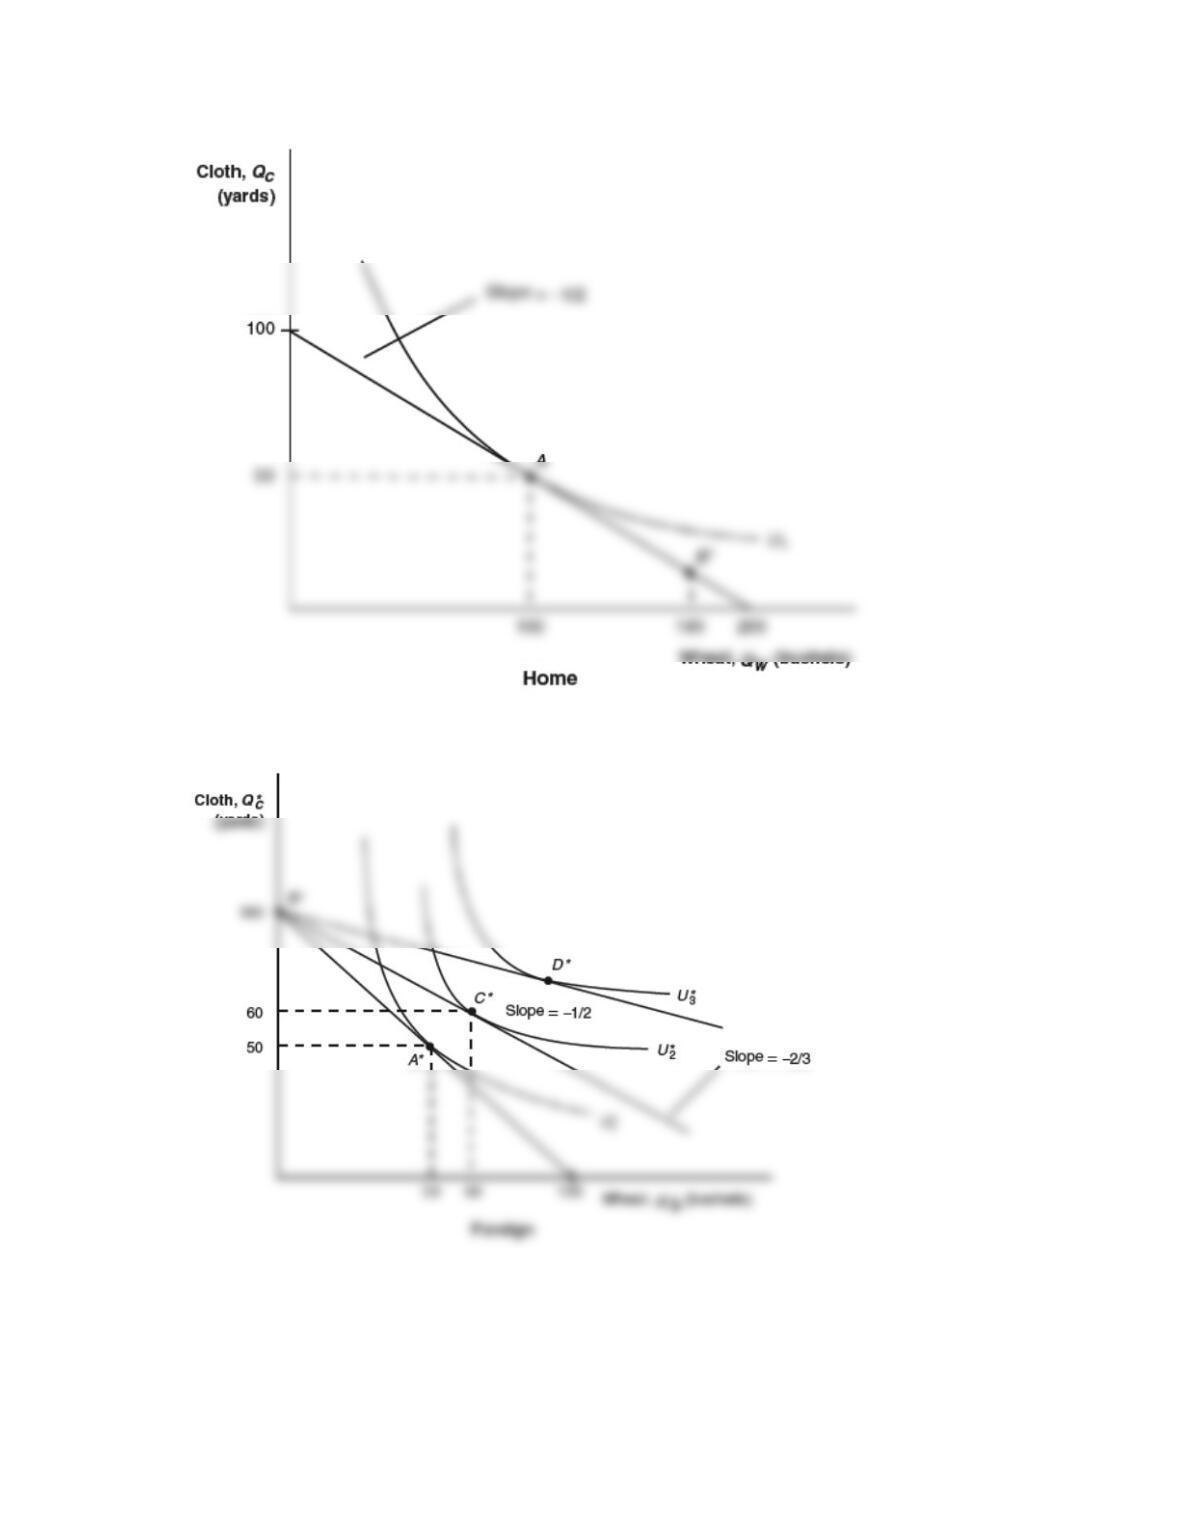
b. Using this new world equilibrium price, draw a new version of the trade
equilibrium in Home and in Foreign, and show the production point and
consumption point in each country.
Because the international price of 1/2 is lower than Foreign’s no-trade relative
price of wheat, Foreign is able to consume at point D*, which gives higher gains
from trade than at point C*.
c. Are there gains from trade in both countries? Explain why or why not.
Answer: The Foreign country gains a lot from trade, but the home country neither
12. Using the results from Problem 11, explain why the Ricardian model predicts that
Mexico would gain more than the United States when the two countries signed the
North American Free Trade Agreement, establishing free trade between them.