Courtesy of CRC Press/Taylor & Francis Group
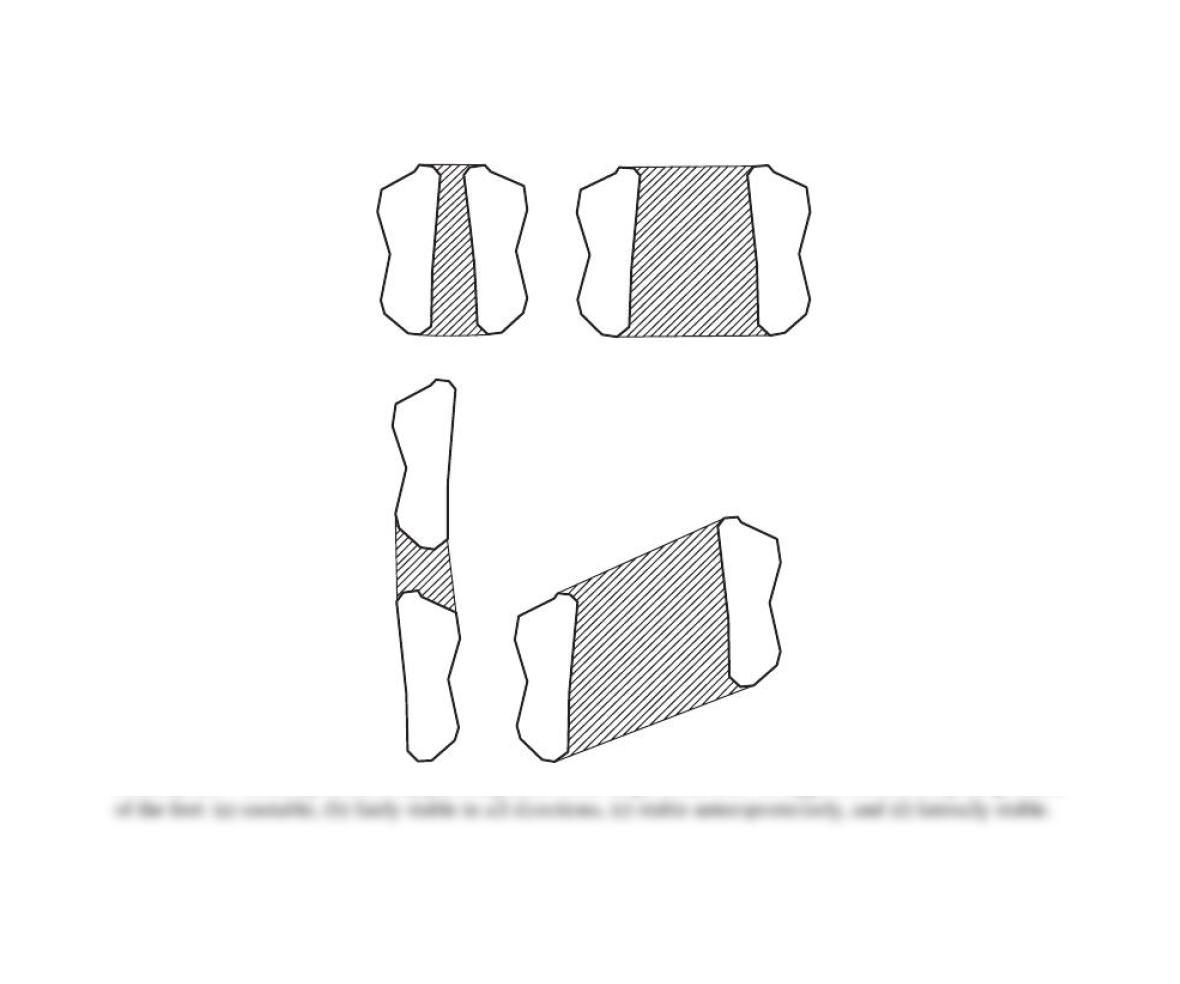
(a) (b)
(c)
(d)
FIGURE 2.1 Stability of the body parts depends on the shape of the base of support described by the position
002×001.eps
Courtesy of CRC Press/Taylor & Francis Group
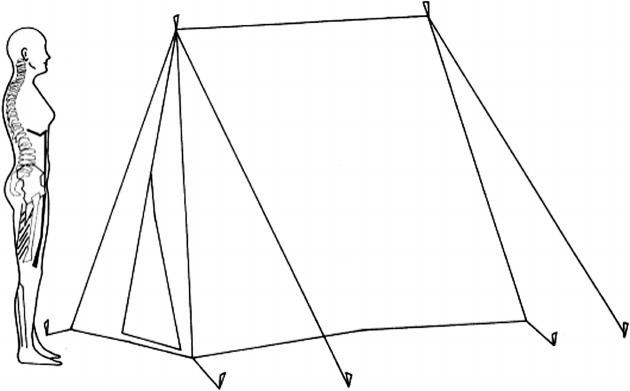
FIGURE 2.2 Tent analogy. The skeleton is the tent pole, the muscles are the guy ropes, and the soft tissues
are the canvas.
002x002.tif
Courtesy of CRC Press/Taylor & Francis Group
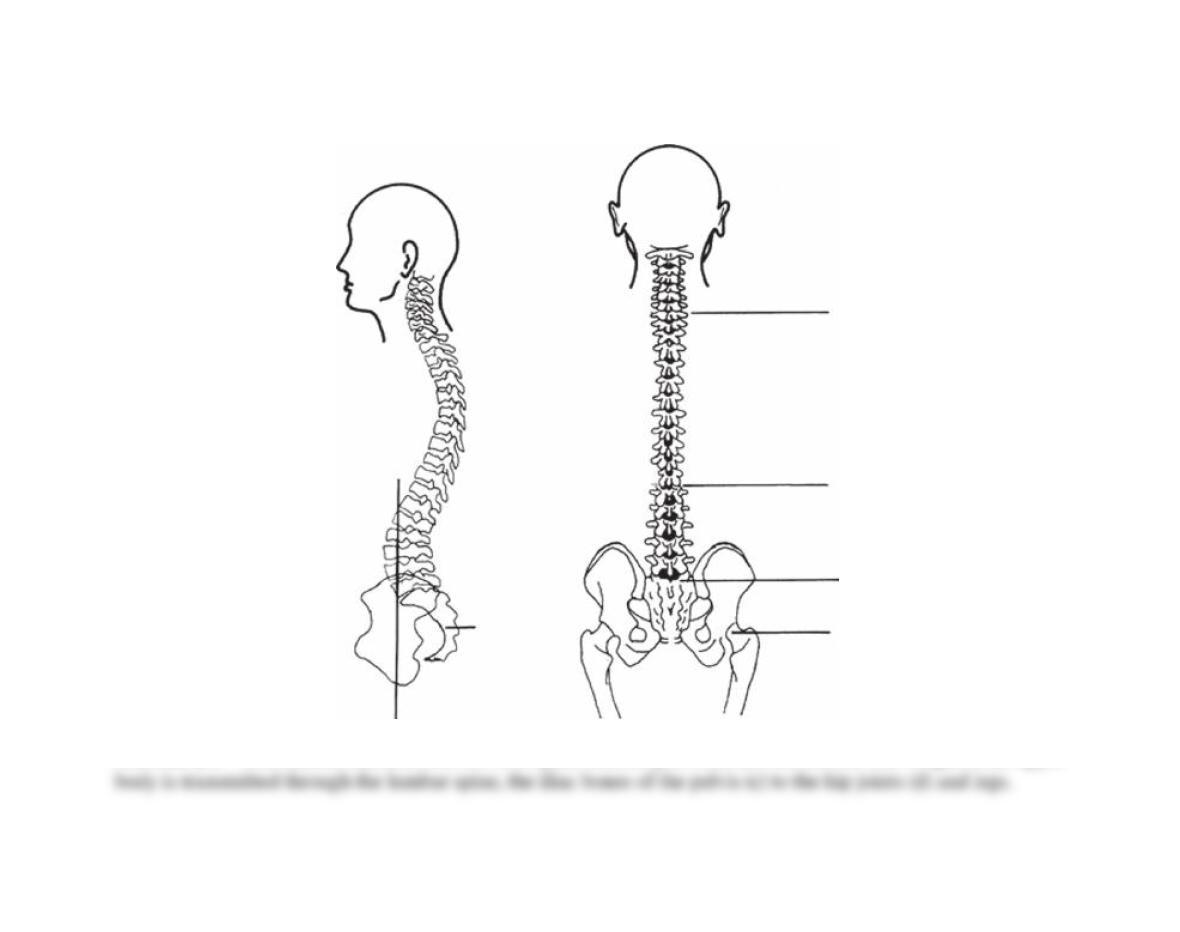
Iordosis
Kyphosis
Cervical
oracic
Lumbar
Sacral
cc
b
a
Iordosis
d
FIGURE 2.3 The lumbar, thoracic, and cervical spines and the pelvis (a) and sacrum (b). The weight of theupper
002×003.eps
Courtesy of CRC Press/Taylor & Francis Group
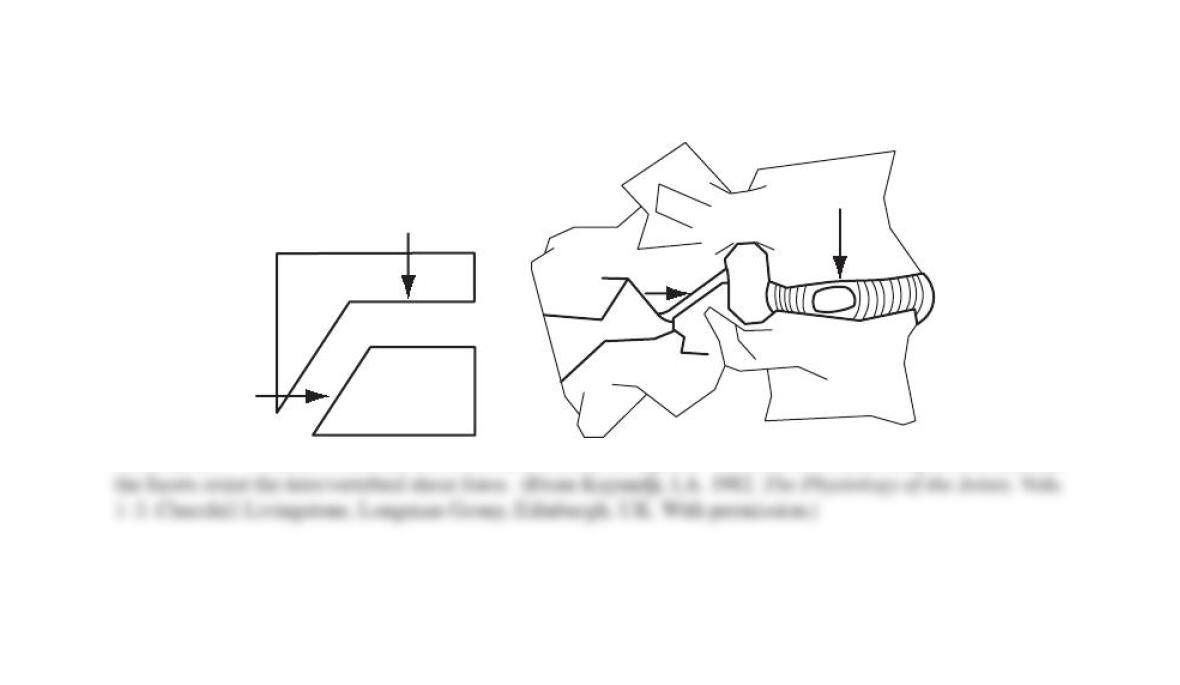
1
2
2
1
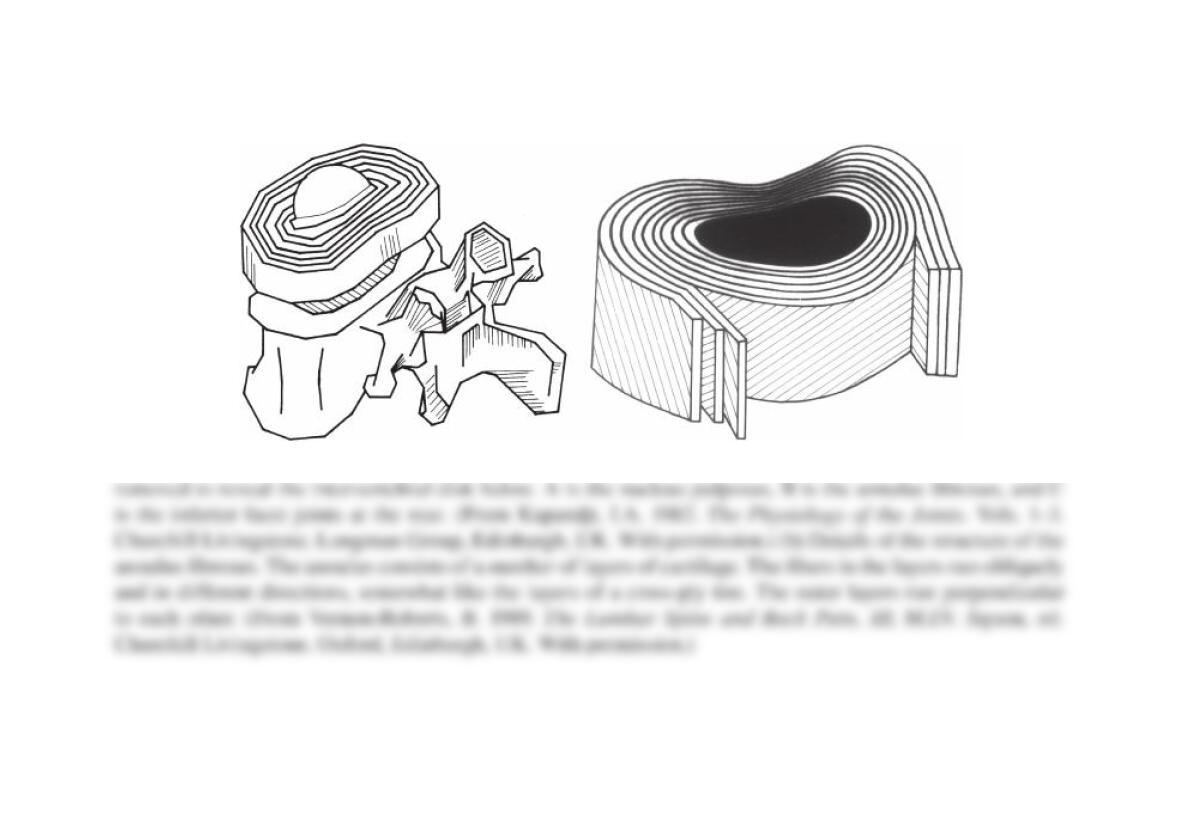
FIGURE 2.4 Function of (1) intervertebral disk and (2) facet joints. The disk resists the compressive load and
002×004.eps
Courtesy of CRC Press/Taylor & Francis Group
A
C
B
(a) (b)
FIGURE 2.5 Intervertebral disk and vertebral body. (a) In this view, the superior vertebral body has been
002×005.eps
Courtesy of CRC Press/Taylor & Francis Group
A
B
B
CC
A
BB
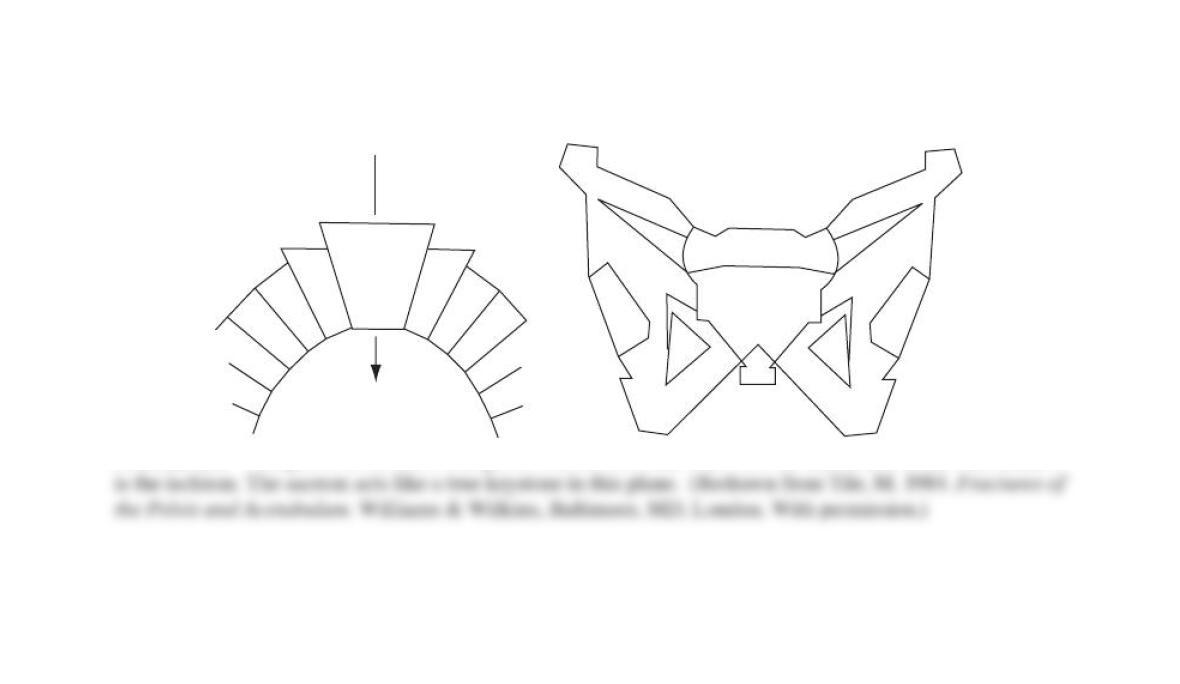
FIGURE 2.6 The pelvis as an arch. The pelvis viewed from the rear. A is the sacrum, B is the ilium, and C
002×006.eps
Courtesy of CRC Press/Taylor & Francis Group
A
B
C
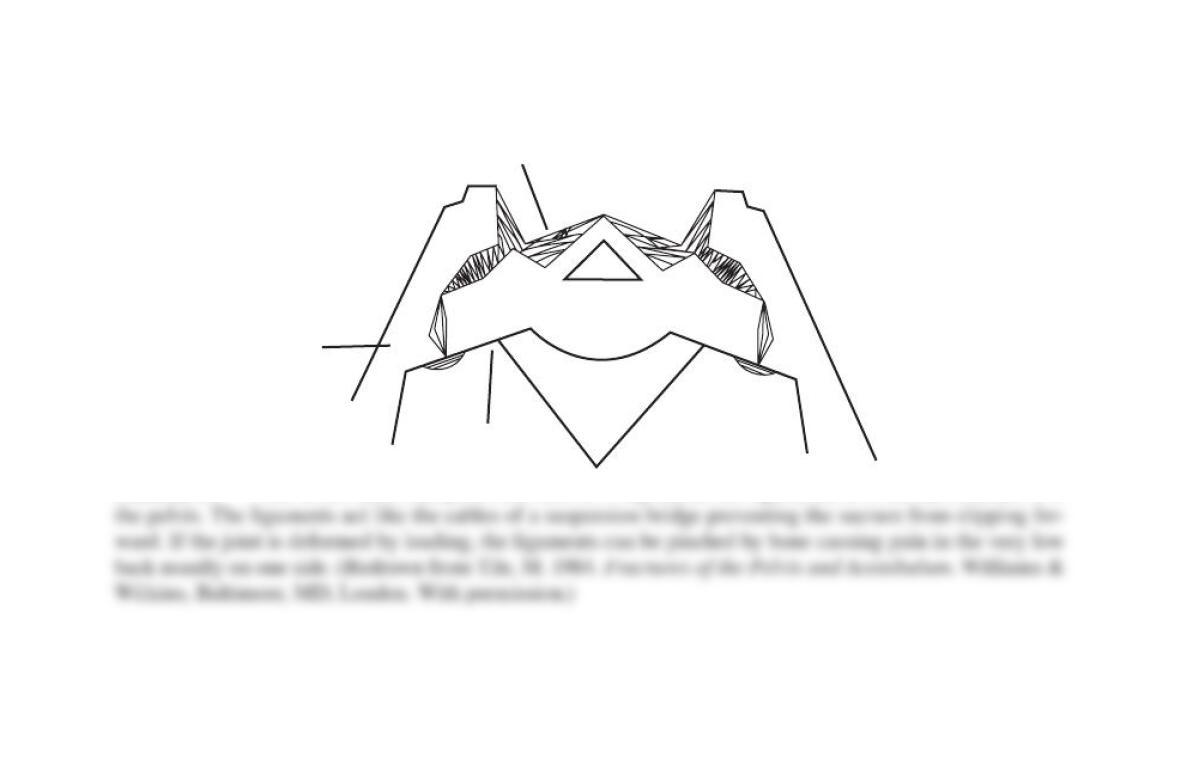
FIGURE 2.7 View of the sacroiliac joint from above. A represents the ligaments, B is the sacrum, and C is
002×007.eps
Courtesy of CRC Press/Taylor & Francis Group
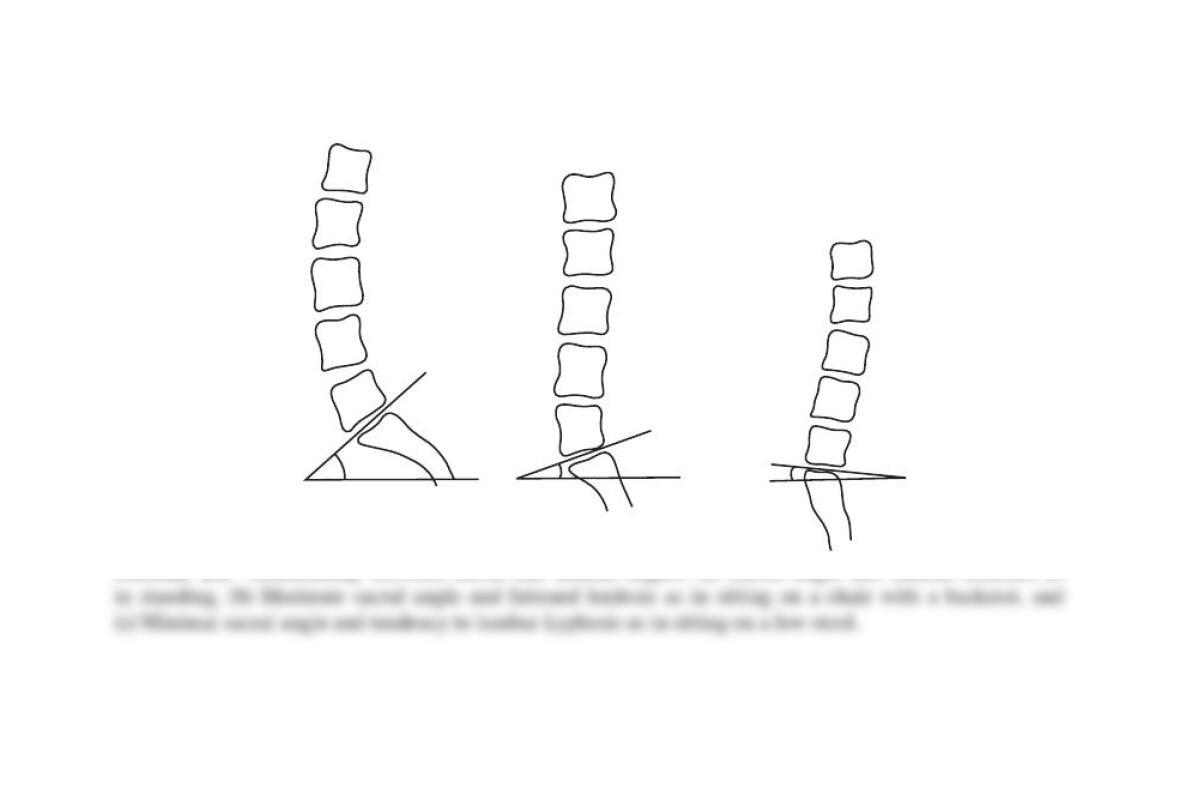
(a)
(b)
(c)
40° 15° –5°
FIGURE 2.8 Relationship between sacral and lumbar angles. (a) Sacral angle and lumbar lordosis, as
002×008.eps
Courtesy of CRC Press/Taylor & Francis Group
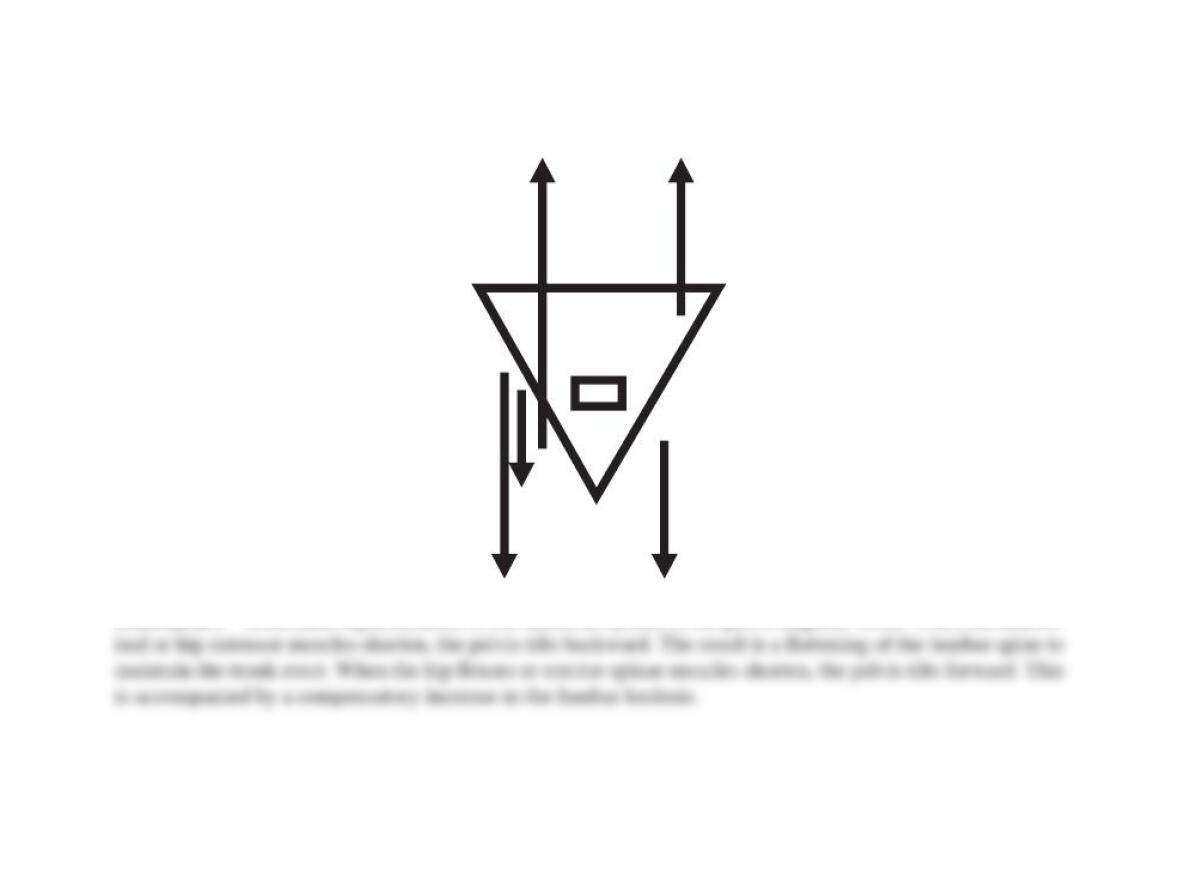
Abdominals Erector
spinae
Hip
extensors
Hip
flexors
FIGURE 2.9 Schematic representation of the muscular system of the pelvis (sagittal view). When the abdom-
002×009.eps
Courtesy of CRC Press/Taylor & Francis Group
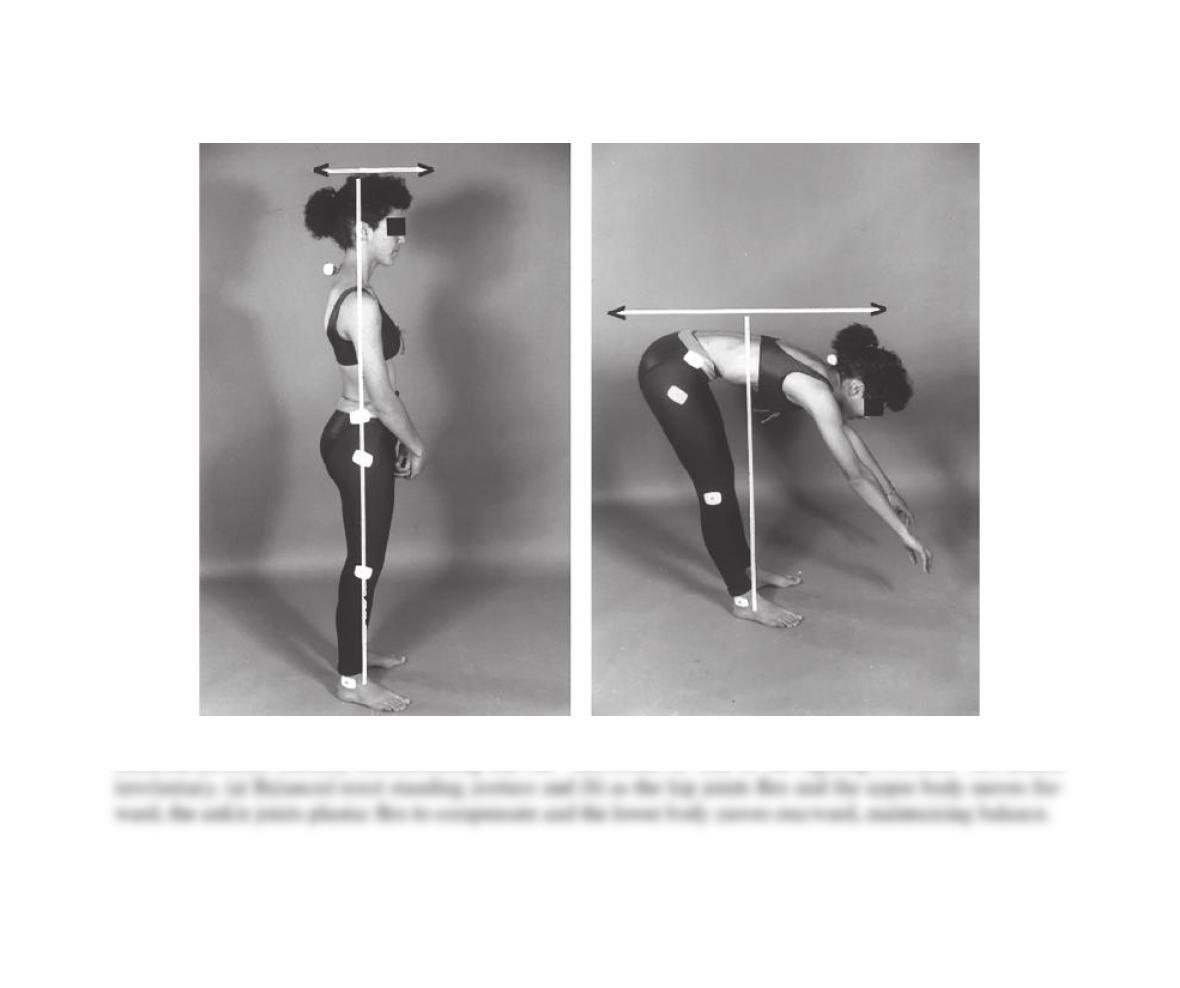
(a) (b)
FIGURE 2.10 When the base of support is constrained, compensatory movements occur automatically to
maintain postural stability demonstrating that the “attitudinal as well as the righting reactions” are indeed
002x010.eps
Courtesy of CRC Press/Taylor & Francis Group
002 x 011.tif
Courtesy of CRC Press/Taylor & Francis Group
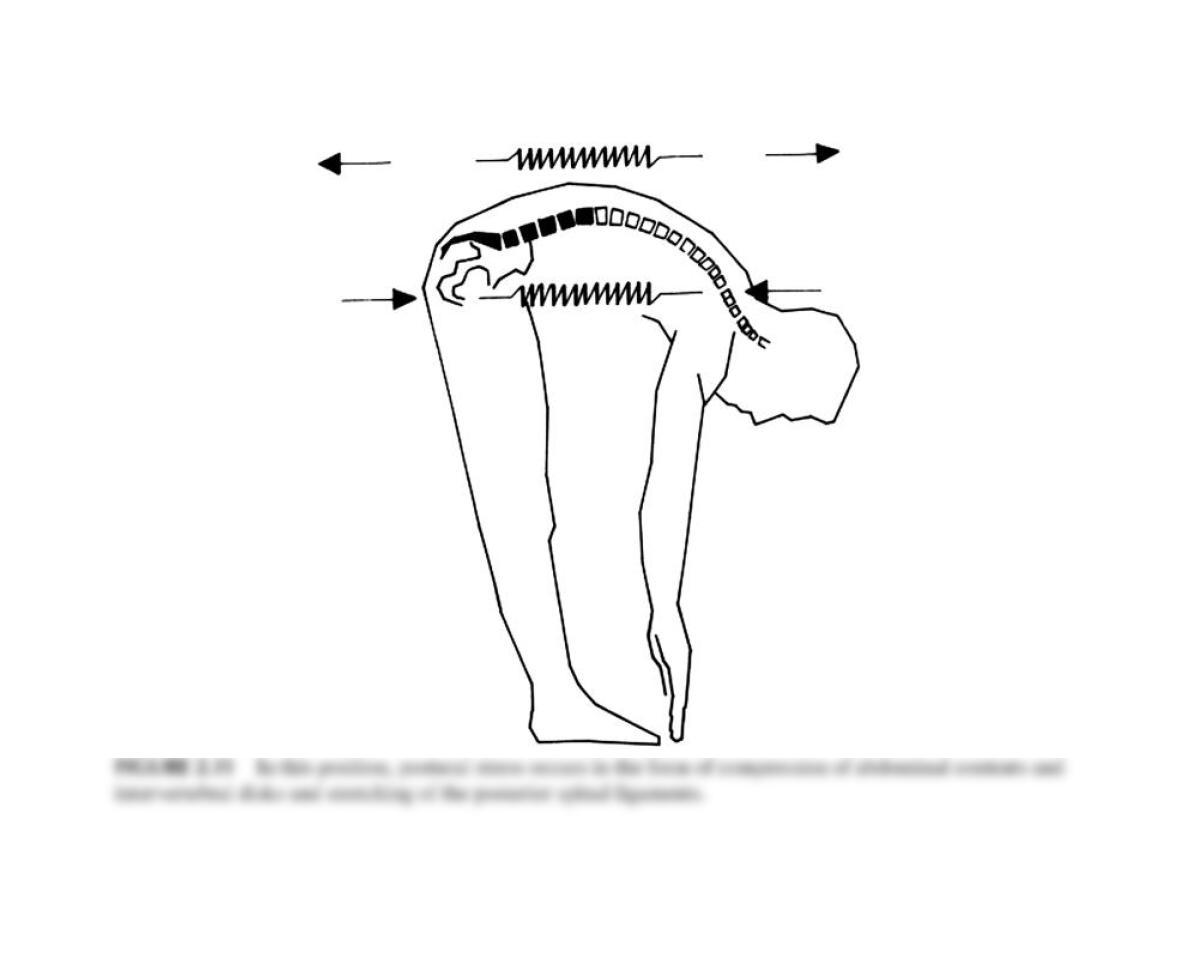
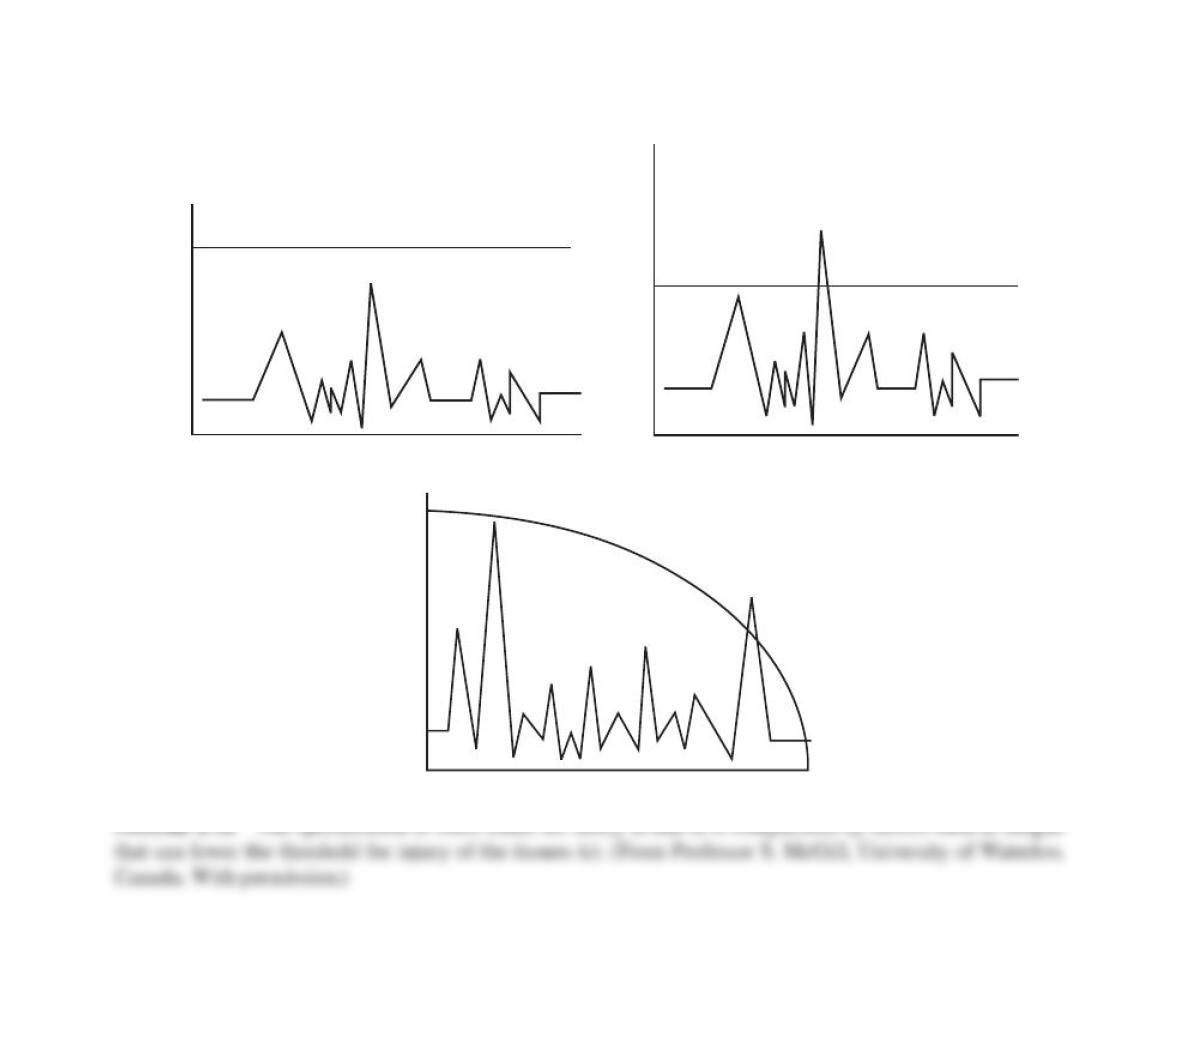
reshold of damage
Time
(a) (b)
Demand on tissues
Demand on tissues
reshold of
damage
Time
(c)
Demand on tissues
reshold of damage
Time
002x012.eps
Courtesy of CRC Press/Taylor & Francis Group
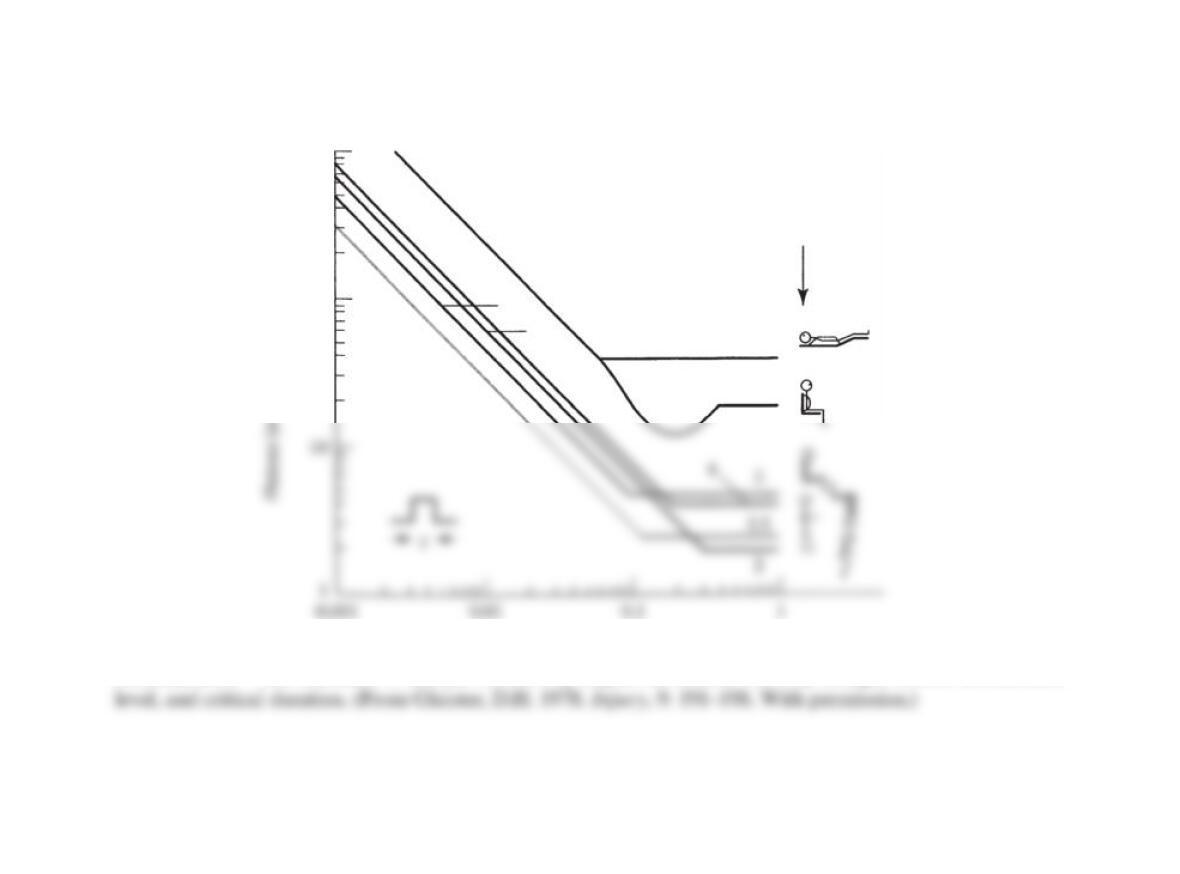
100
1000
20
3.0 6.1
4.6
7.6
24.4
m/s
40
Inertial forc
e
vector
G
Pulse duration t (s)
FIGURE 2.13 The tolerance to human whole-body impact for critical velocity change, critical acceleration
002x013.eps
Courtesy of CRC Press/Taylor & Francis Group
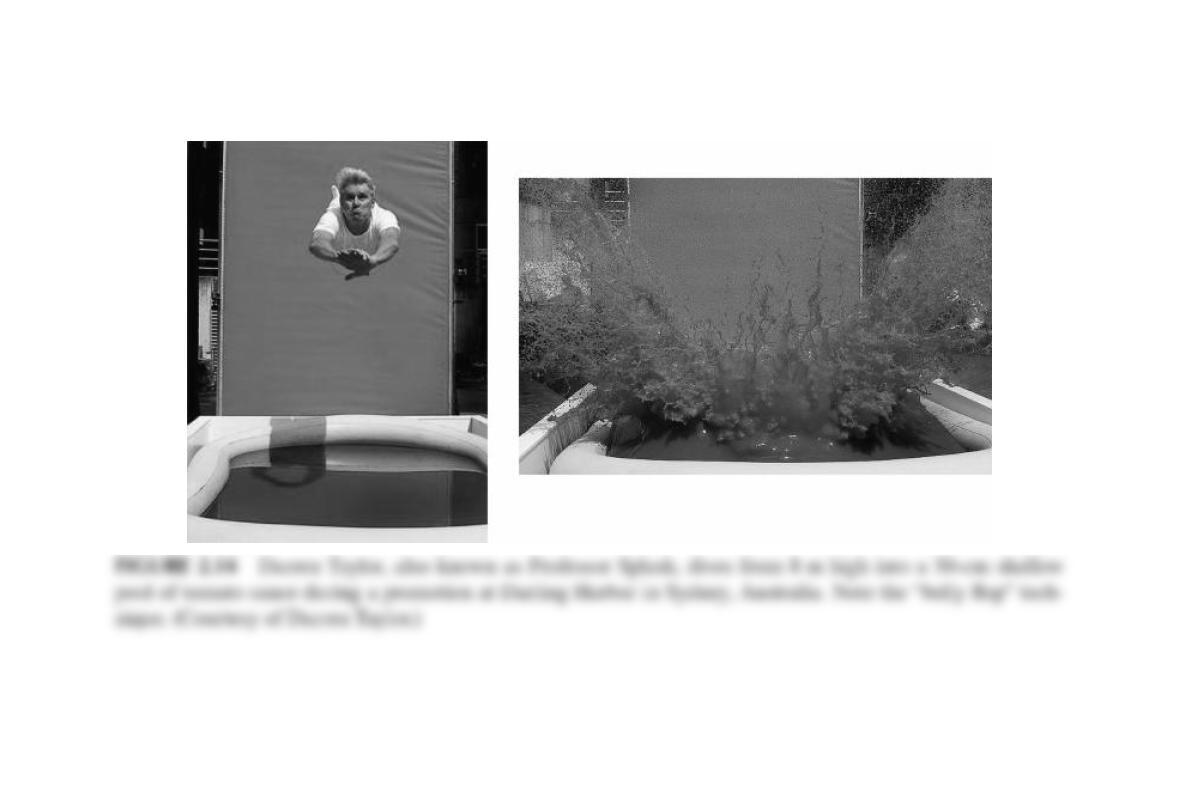
002x014.tif
Courtesy of CRC Press/Taylor & Francis Group
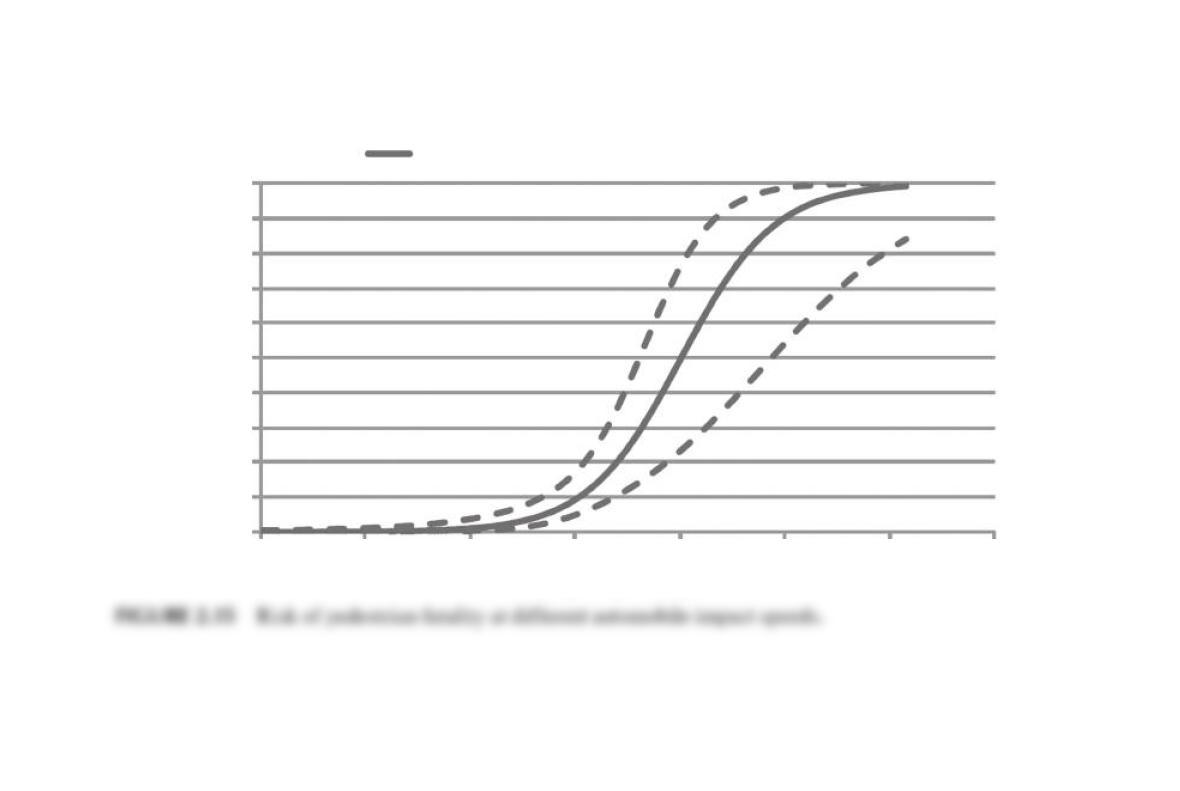
0
Risk of pedestrian fatality
0%
10%
20%
30%
40%
50%
60%
70%
80%
90%
100%
Ashton data (all ages, front of cars, n = 358)
10 20 30 40
Impact speed (mph)
50 60
70
002x015.eps
Courtesy of CRC Press/Taylor & Francis Group
002x016.tif
Courtesy of CRC Press/Taylor & Francis Group
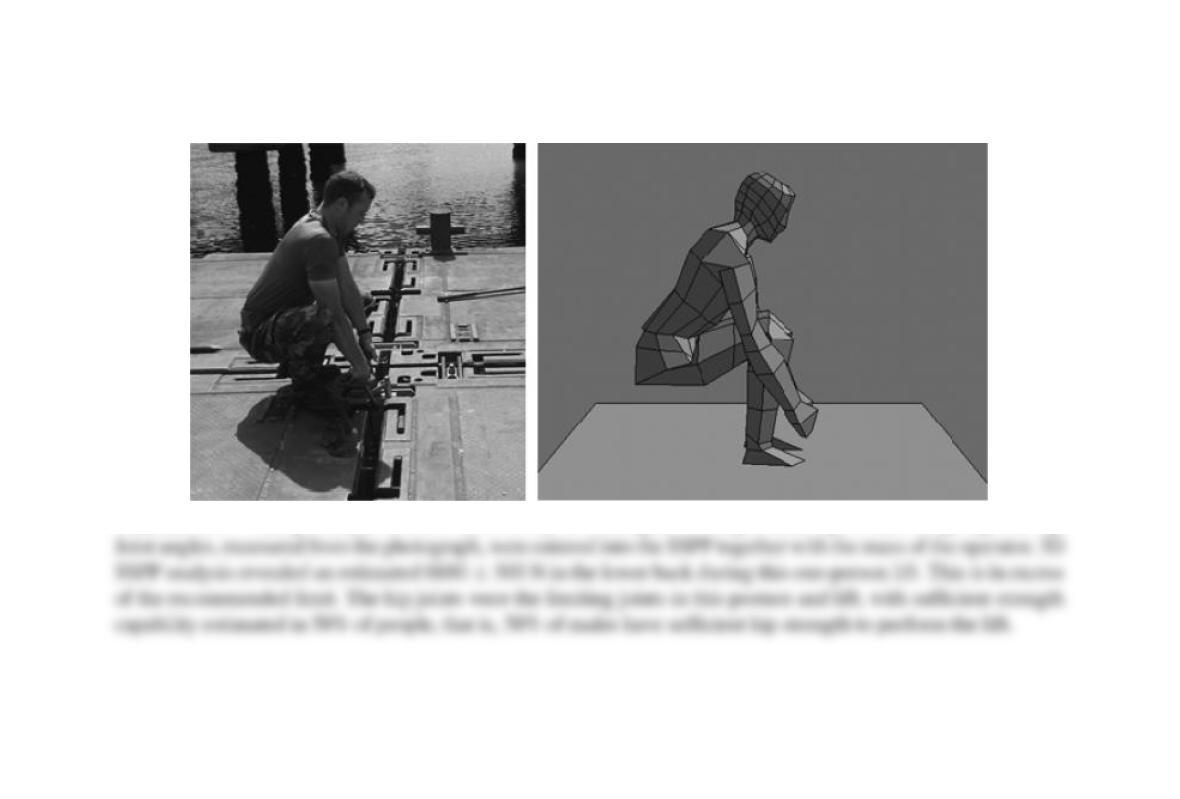
FIGURE 2.17 Sample output of SSPP (University of Michigan). Lifting a mooring bollard weighing 38.6 kg.
002x017.tif
Courtesy of CRC Press/Taylor & Francis Group
3
2
1
0
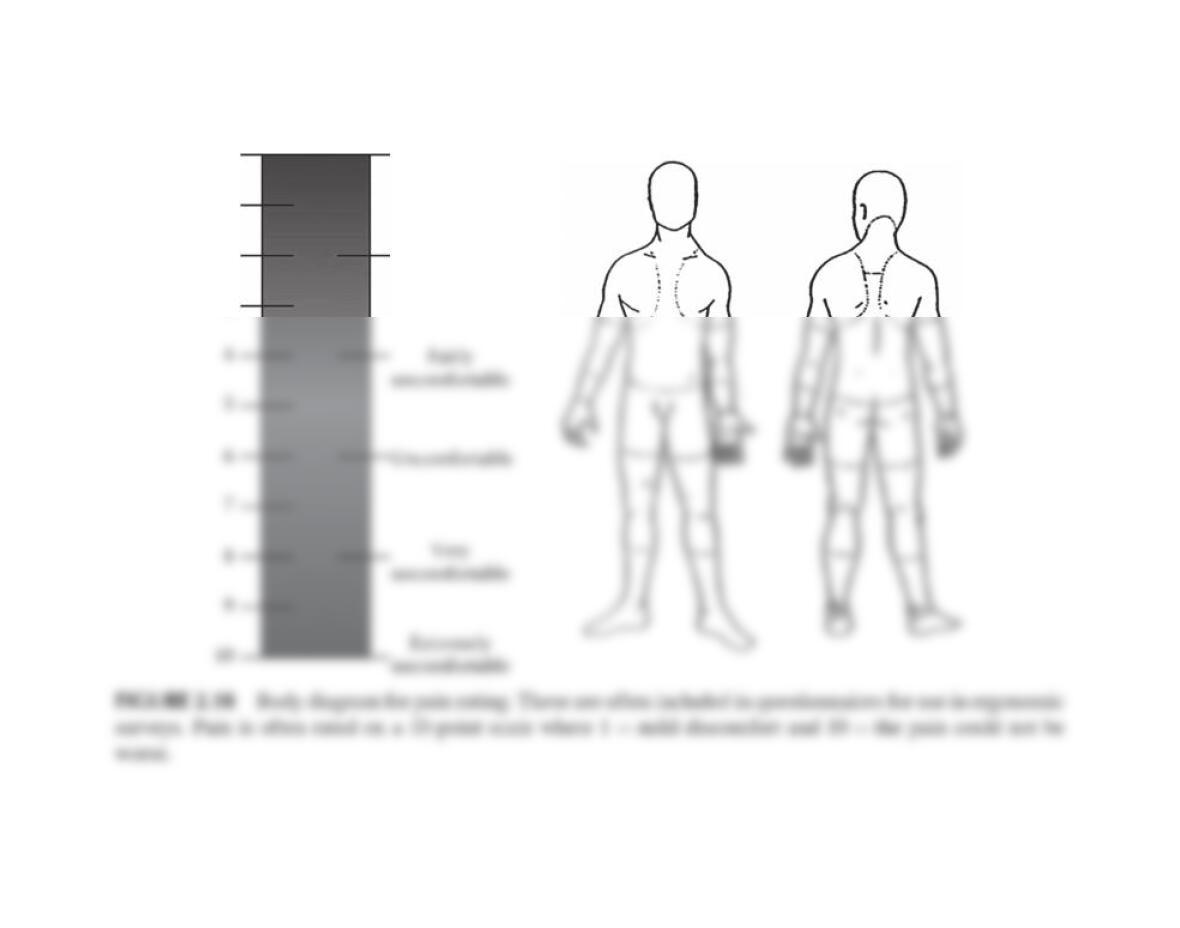
Not
uncomfortable
A little
uncomfortable
002x018.eps