30 Chapter 2
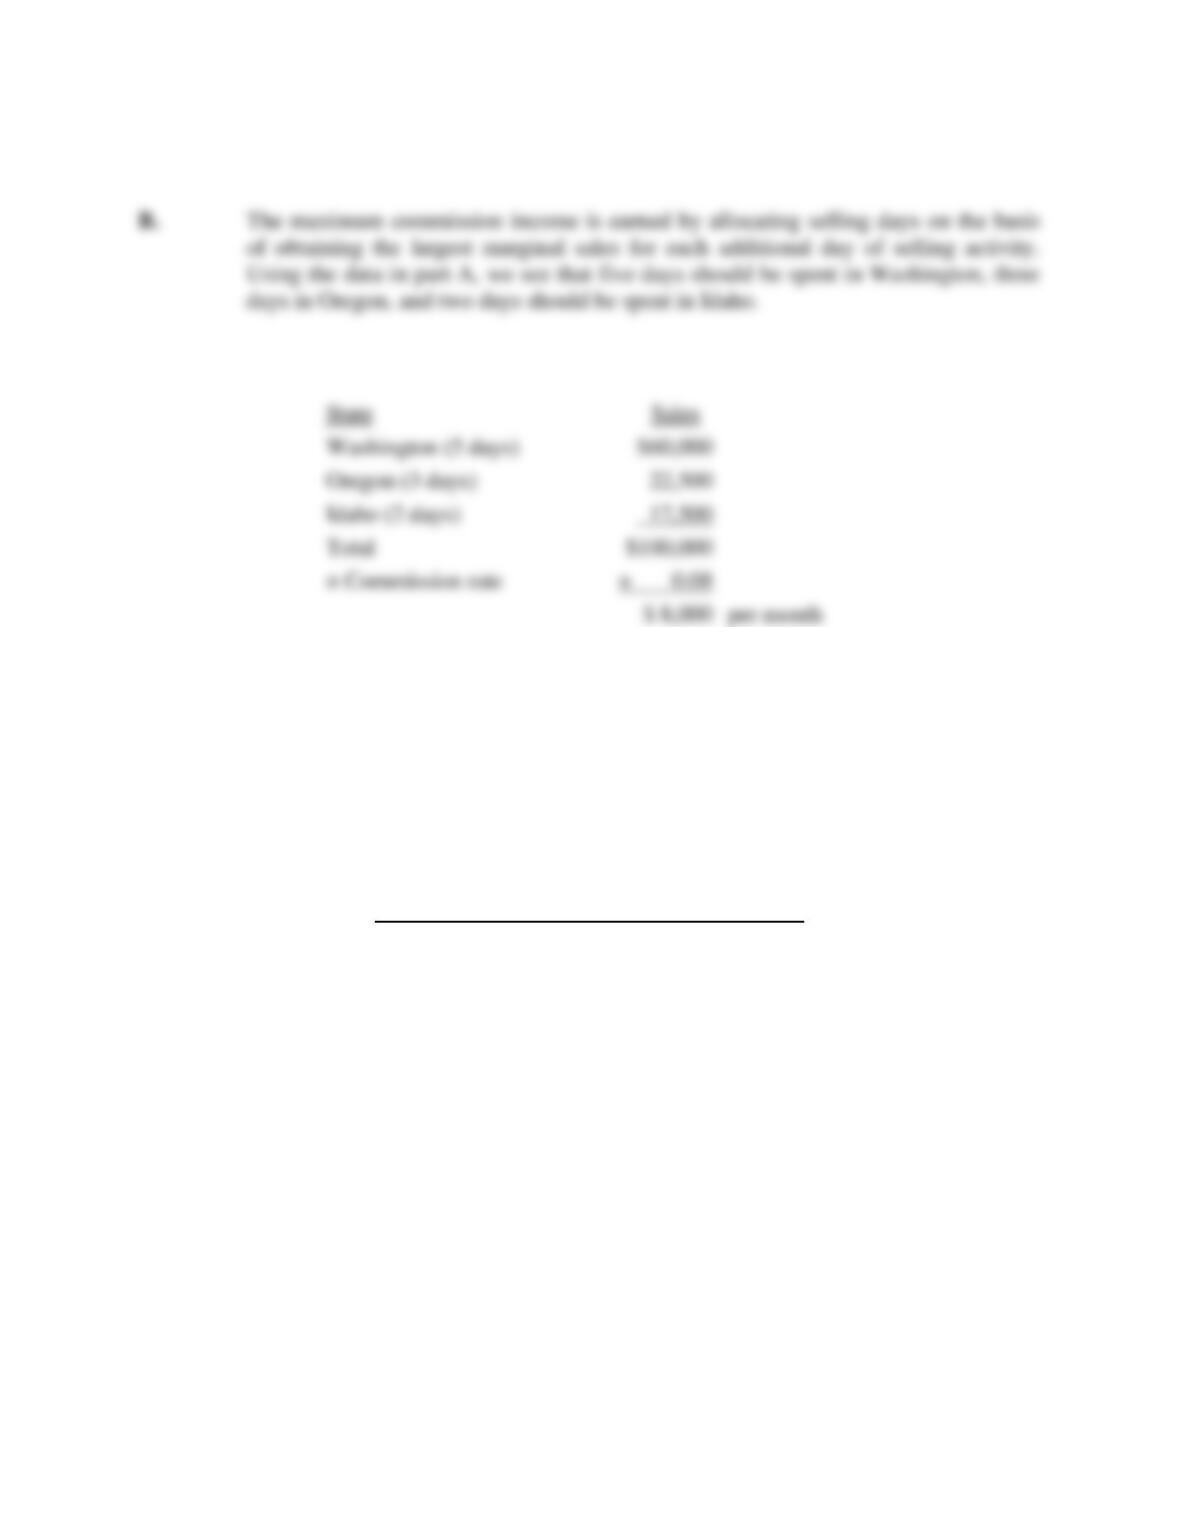
C. Given this time allocation, Grey’s maximum commission income is
P2.5 Marginal Analysis: Tables. Climate Control Devices, Inc., estimates that sales of
defective thermostats cost the firm $50 each for replacement or repair. Boone
Carlyle, an independent engineering consultant, has recommended hiring quality
control inspectors so that defective thermostats can be identified and corrected
before shipping. The following schedule shows the expected relation between the
number of quality control inspectors and the thermostat failure rate, defined in terms
of the percentage of total shipments that prove to be defective.
Number of Quality
Control Inspectors
Thermostat Failure
Rate (percent)
0
5.0
1
4.0
2
3.2
3
2.6
4
2.2
5
2.0
The firm expects to ship 250,000 thermostats during the coming year, and quality
control inspectors each command a salary of $60,000 per year.
A. Construct a table showing the marginal failure reduction (in units) and the
dollar value of these reductions for each inspector hired.
B. How many inspectors should the firm hire?
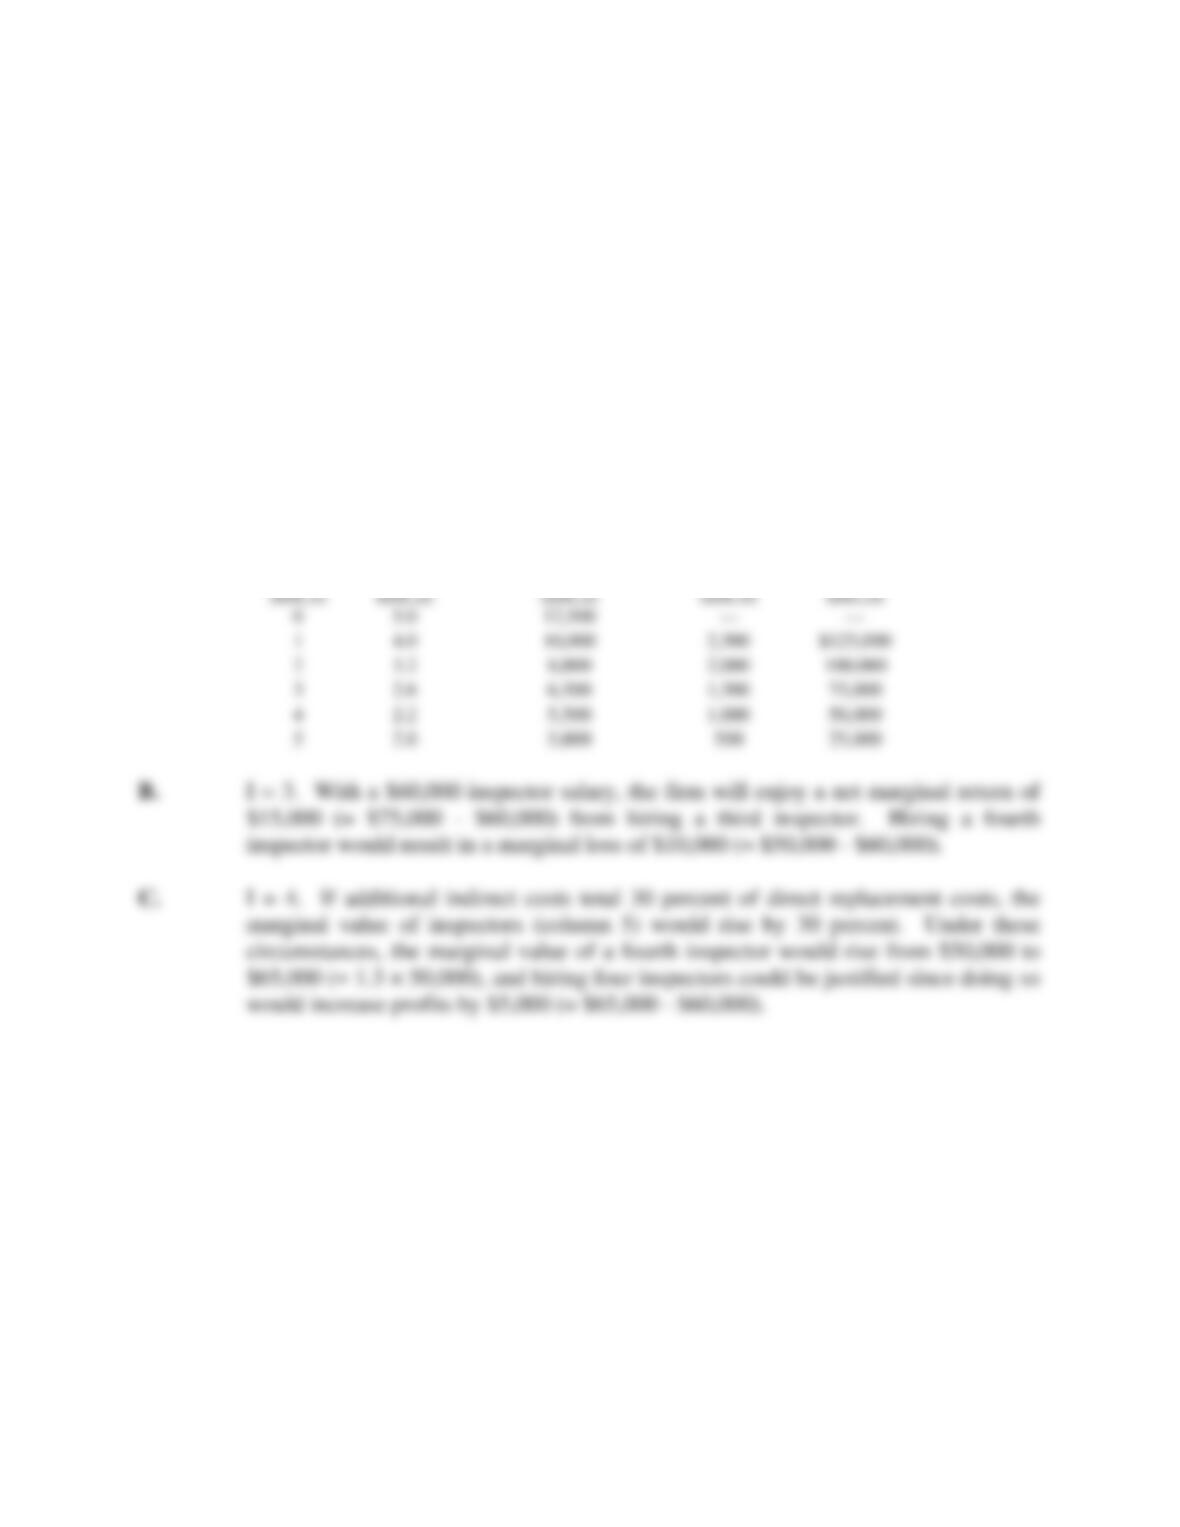
Economic Optimization 31
C. How many inspectors should be hired if additional indirect costs (lost customer
goodwill and so on) were to average 30 percent of direct replacement or repair
costs?
P2.5 SOLUTION
A.
Number
of Quality
Control
Inspectors
Thermostat
Failure rate
(percent)
Number of Failures (=
250,000 × (col. 2 ÷ 100)
Marginal
Failure
Reduction
Marginal Value
of Failure
Reduction (=
$50 × (col. 4)
P2.6 Price and Total Revenue. The Portland Sea Dogs, the AA affiliate of the Boston Red
Sox major league baseball team, have enjoyed a surge in popularity. During a recent
home stand, suppose the club offered $5 off the $12 regular price of reserved seats,
and sales spurted from 3,200 to 5,200 tickets per game.
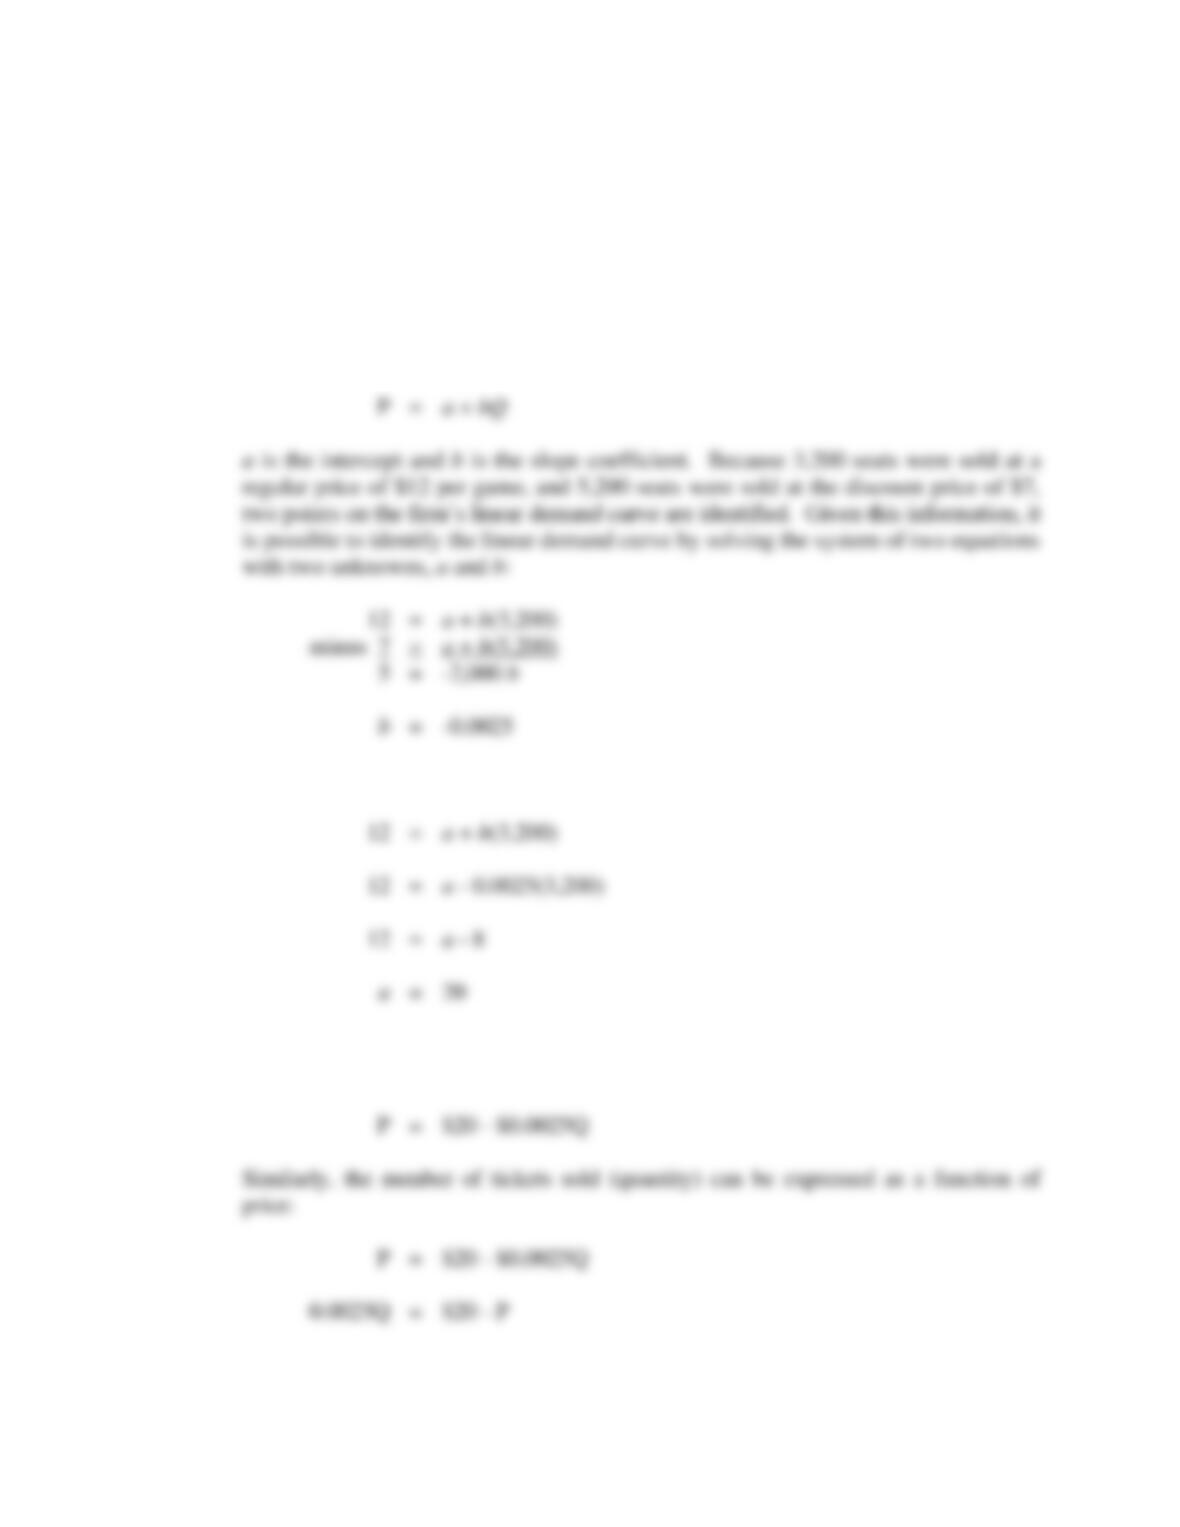
A. Derive the function that describes the price/output relation with price
expressed as a function of quantity (tickets sold). Also express tickets sold as a
function of price.
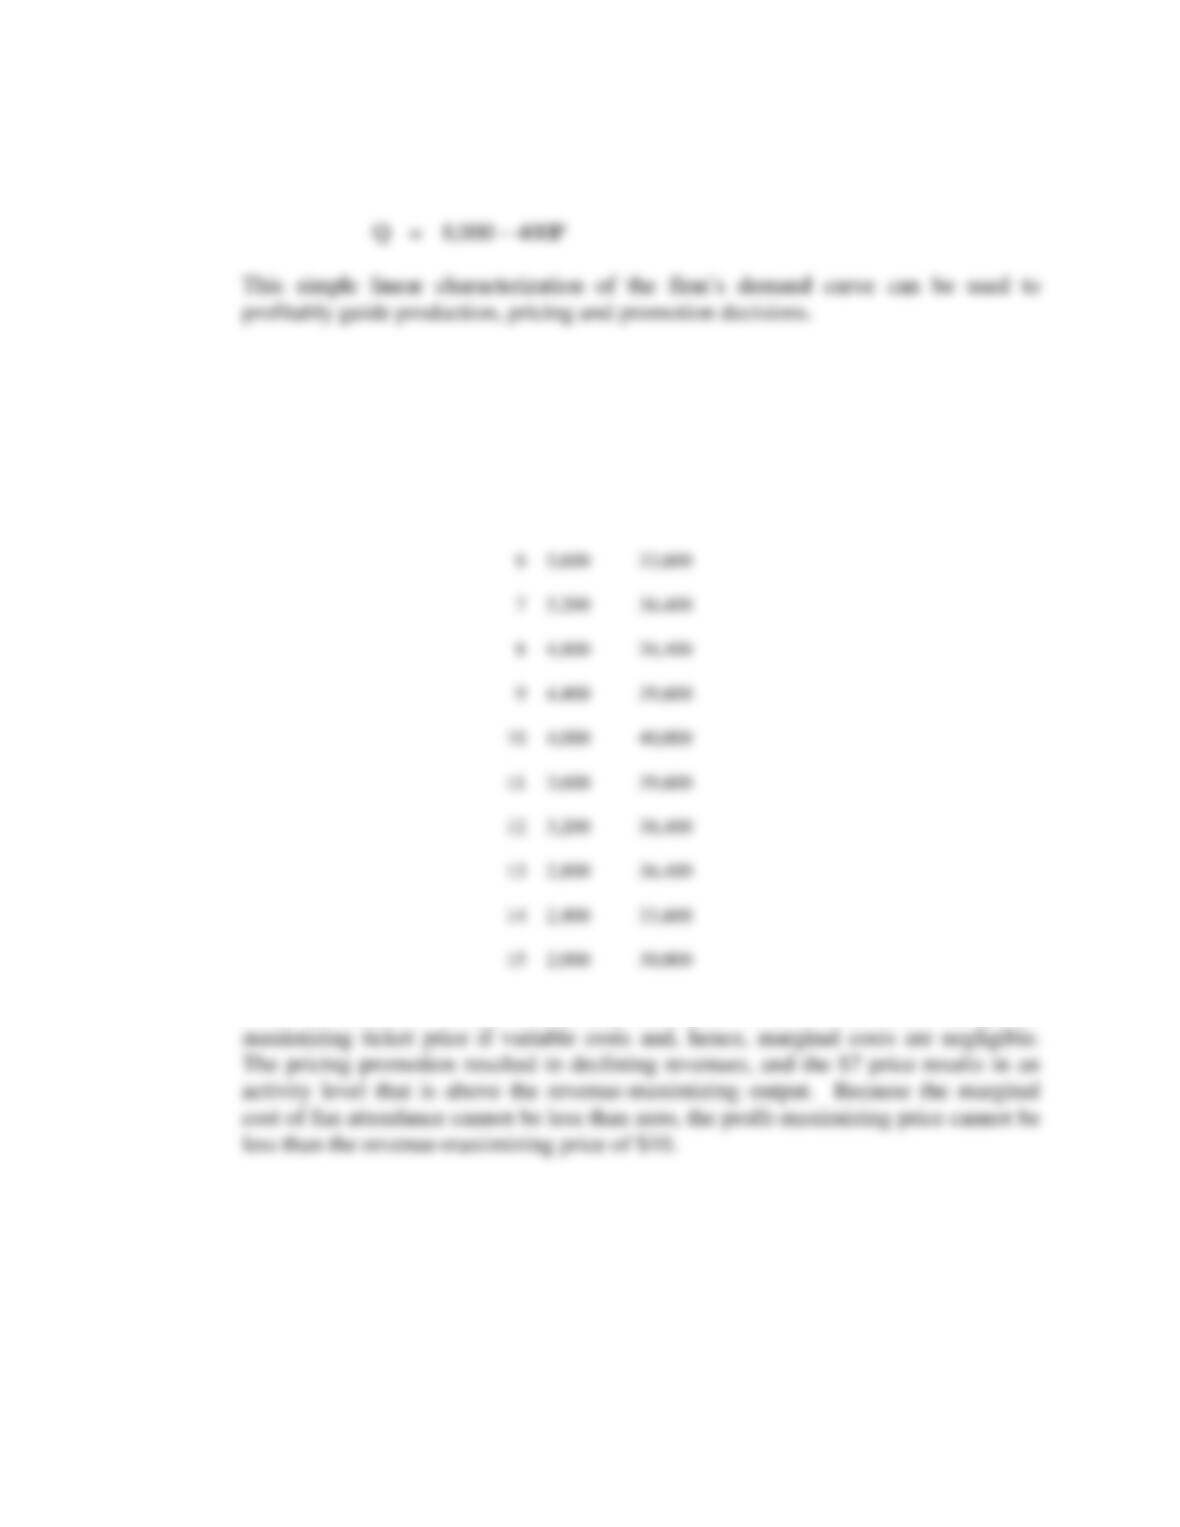
B. Use the information derived in part A to calculate total revenues at prices in $1
increments from $5 to $15 per ticket. What is the revenue-maximizing ticket
32 Chapter 2
price? If variable costs are negligible, is this amount also the profit–
maximizing ticket price?
P2.6 SOLUTION
A. When a linear demand curve is written as:
By substitution, if b = -0.0025, then:
With price expressed as a function of quantity, the reserved seat demand curve can be
written:
Economic Optimization 33
B. The Portland Sea Dogs could use the estimated linear market demand curve to
estimate the quantity demanded during the same marketing period for ticket prices in
the range from $5 to $15 per ticket, using $1 increments:
Price
Quantity
TR=P×Q
$5
6,000
30,000
5,600
33,600
4,800
38,400
4,400
39,600
10
11
3,600
39,600
12
3,200
38,400
13
2,800
36,400
14
2,400
33,600
15
2,000
30,000
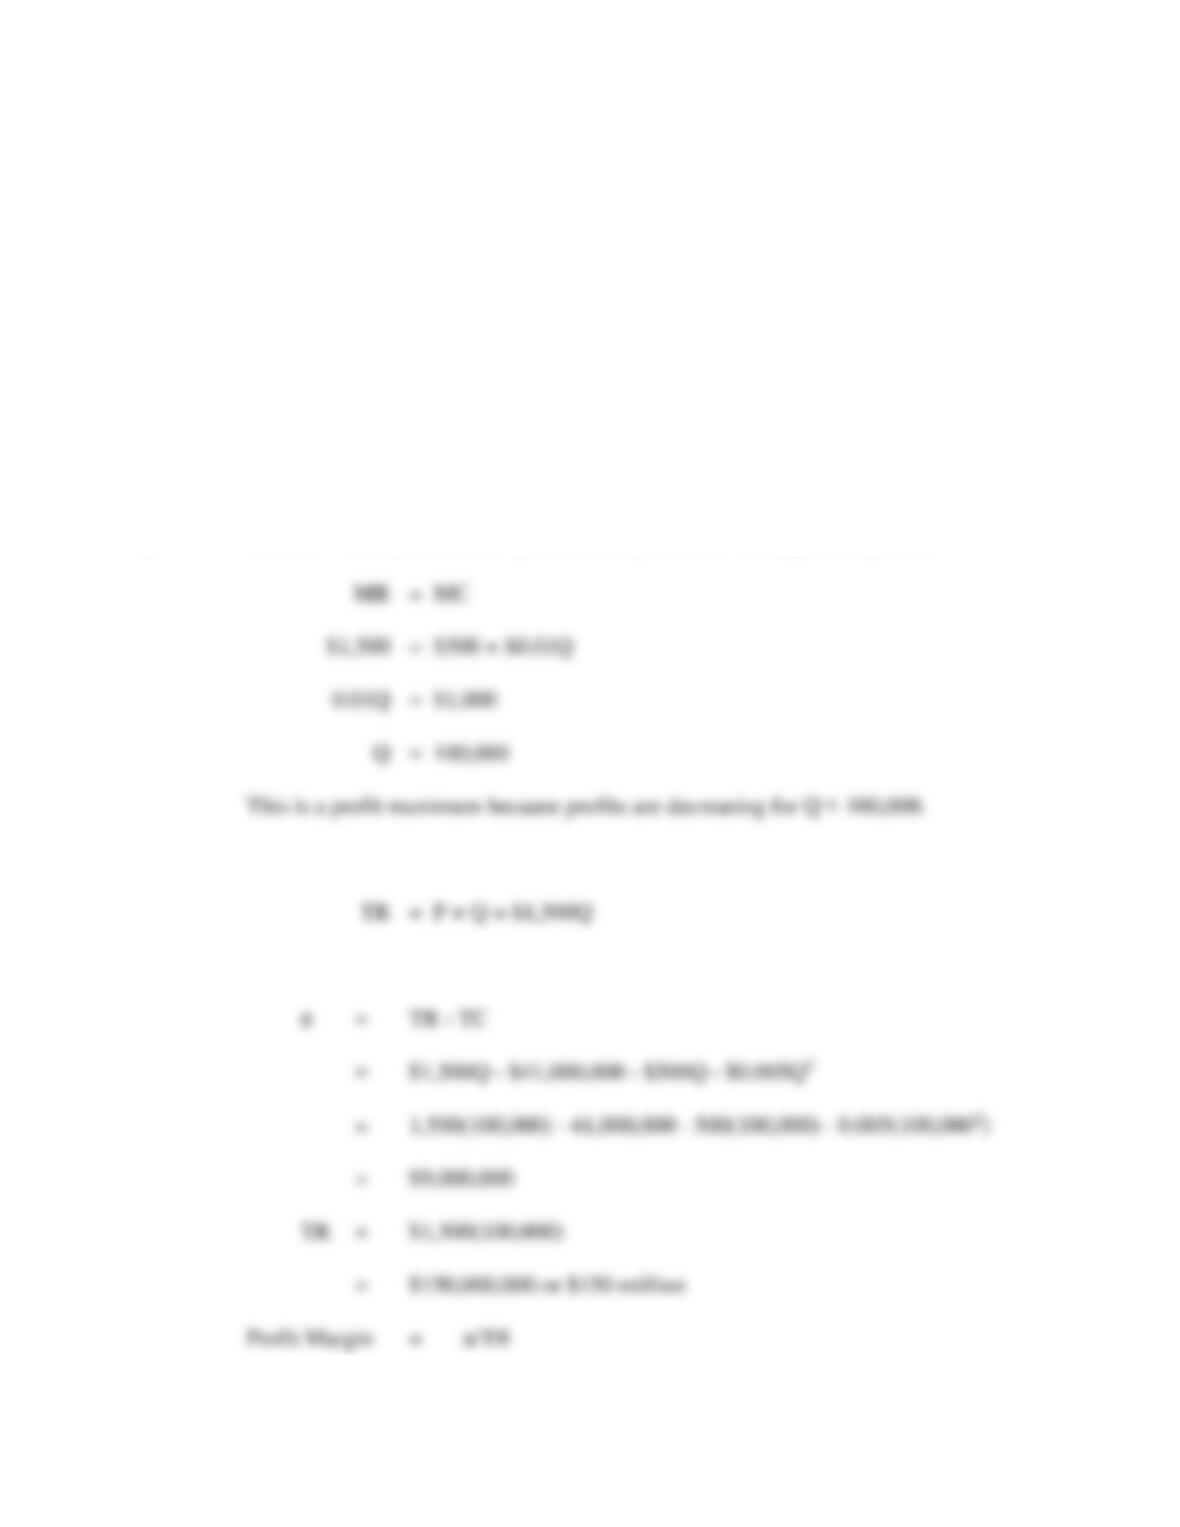
From the table, the revenue-maximizing ticket price is $10. This is also the profit–
P2.7 Profit Maximization: Equations. 21st Century Insurance offers mail-order
automobile insurance to preferred-risk drivers in the Los Angeles area. The
company is the low-cost provider of insurance in this market but doesn’t believe its
annual premium of $1,500 can be raised for competitive reasons. Rates are expected
to remain stable during coming periods; hence, P = MR = $1,500. Total and
marginal cost relations for the company are as follows:
34 Chapter 2
TC = $41,000,000 + $500Q + $0.005Q2
MC = ∂TC/∂Q = $500 + $0.01Q
A. Calculate the profit-maximizing activity level.
B. Calculate the company’s optimal profit, and optimal profit as a percentage of
sales revenue (profit margin).
P2.7 SOLUTION
A. Set MR = MC and solve for Q to find the profit-maximizing activity level:
B. The total revenue function for 21st Century Insurance is:
Then, total profit is
Economic Optimization 35
P2.8 Not-for-Profit Analysis. The Denver Athlete’s Club (DAC) is a private,
not-for-profit athletic club located in Denver, Colorado. DAC currently has 3,500
members but is planning on a membership drive to increase this number
significantly. An important issue facing John Blutarsky, DAC’s administrative
director, is the determination of an appropriate membership level. In order to
efficiently employ scarce DAC resources, the board of directors has instructed
Blutarsky to maximize DAC’s operating surplus, defined as revenues minus operating
costs. They have also asked Blutarsky to determine the effects of a proposed
agreement between DAC and a neighboring club with outdoor recreation and
swimming pool facilities. Plan A involves paying the neighboring club $100 per
DAC member. Plan B involves payment of a fixed fee of $400,000 per year. Finally,
the board has determined that the basic membership fee for the coming year will
remain constant at $2,500 per member irrespective of the number of new members
added and whether plan A or plan B is adopted.
In the calculations for determining an optimal membership level, Blutarsky
regards price as fixed; therefore, P = MR = $2,500. Before considering the effects
of any agreement with the neighboring club, Blutarsky projects total and marginal
cost relations during the coming year to be as follows:
TC = $3,500,000 + $500Q + $0.25Q2
MC = ∂TC/∂Q = $500 + $0.5Q
where Q is the number of DAC members.
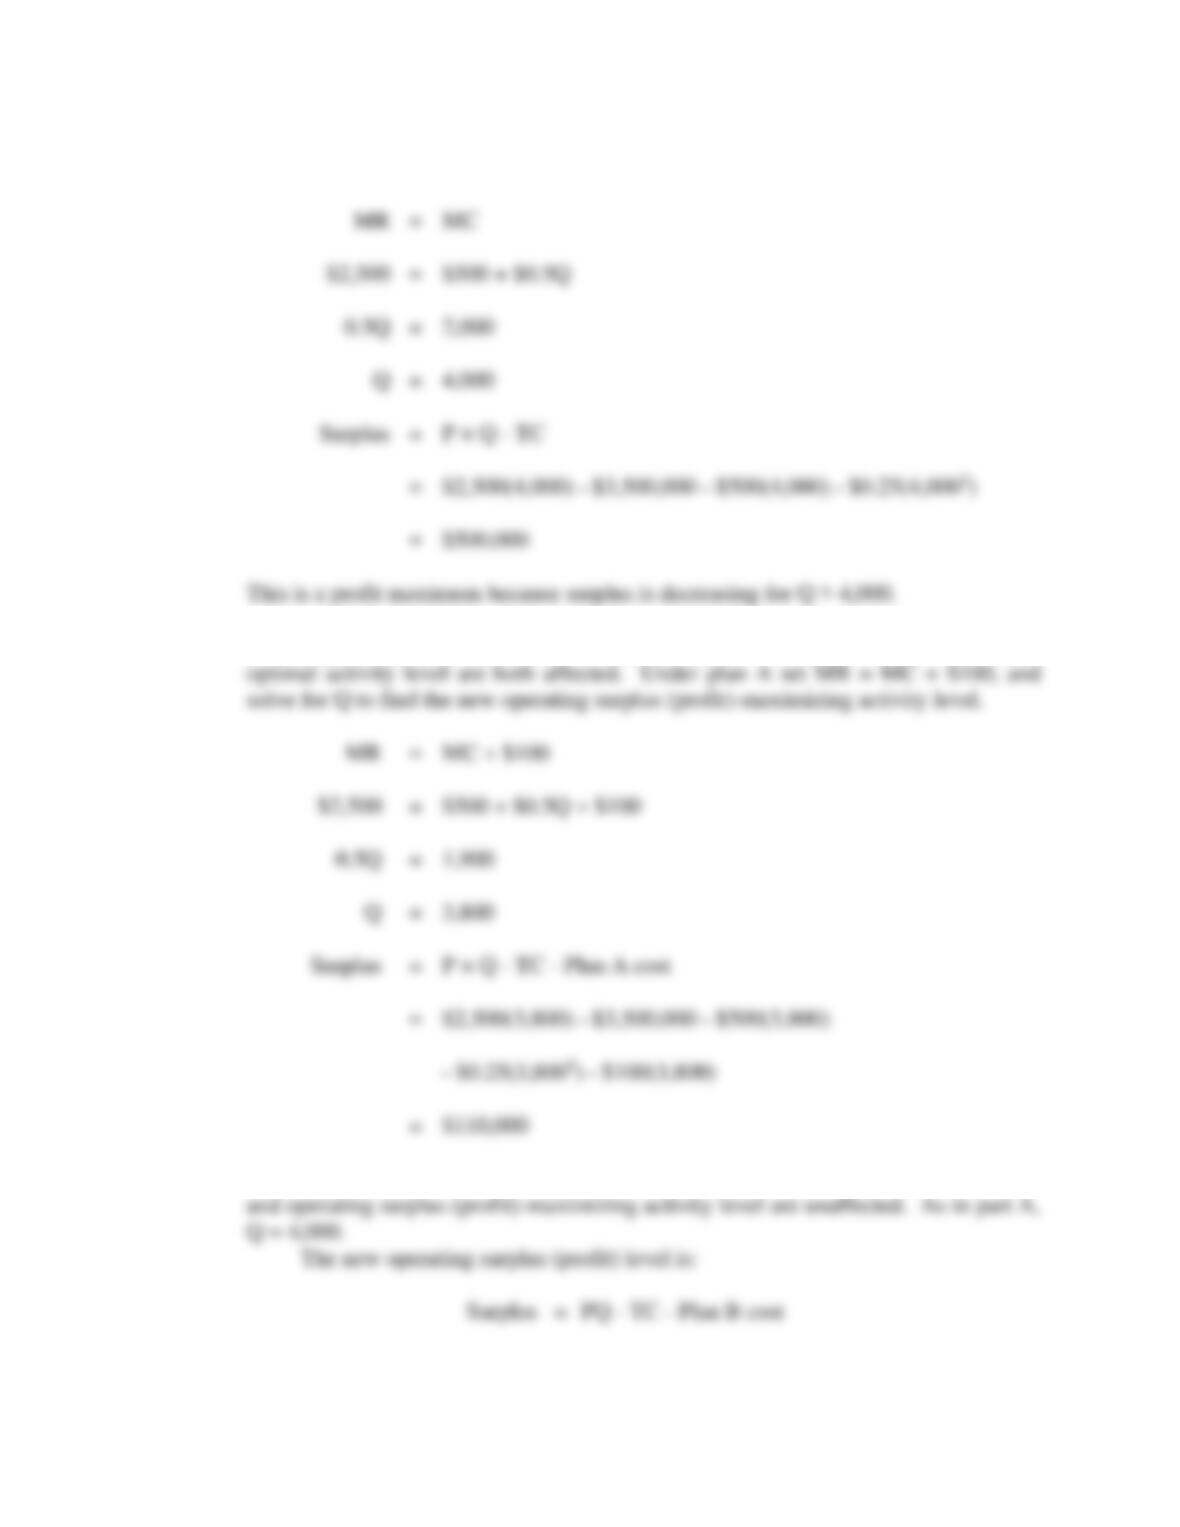
A. Before considering the effects of the proposed agreement with the neighboring
club, calculate DAC’s optimal membership and operating surplus levels.
B. Calculate these levels under plan A.
C. Calculate these levels under plan B.
P2.8 SOLUTION
36 Chapter 2
B. When operating costs increase by $100 per member, the marginal cost function and
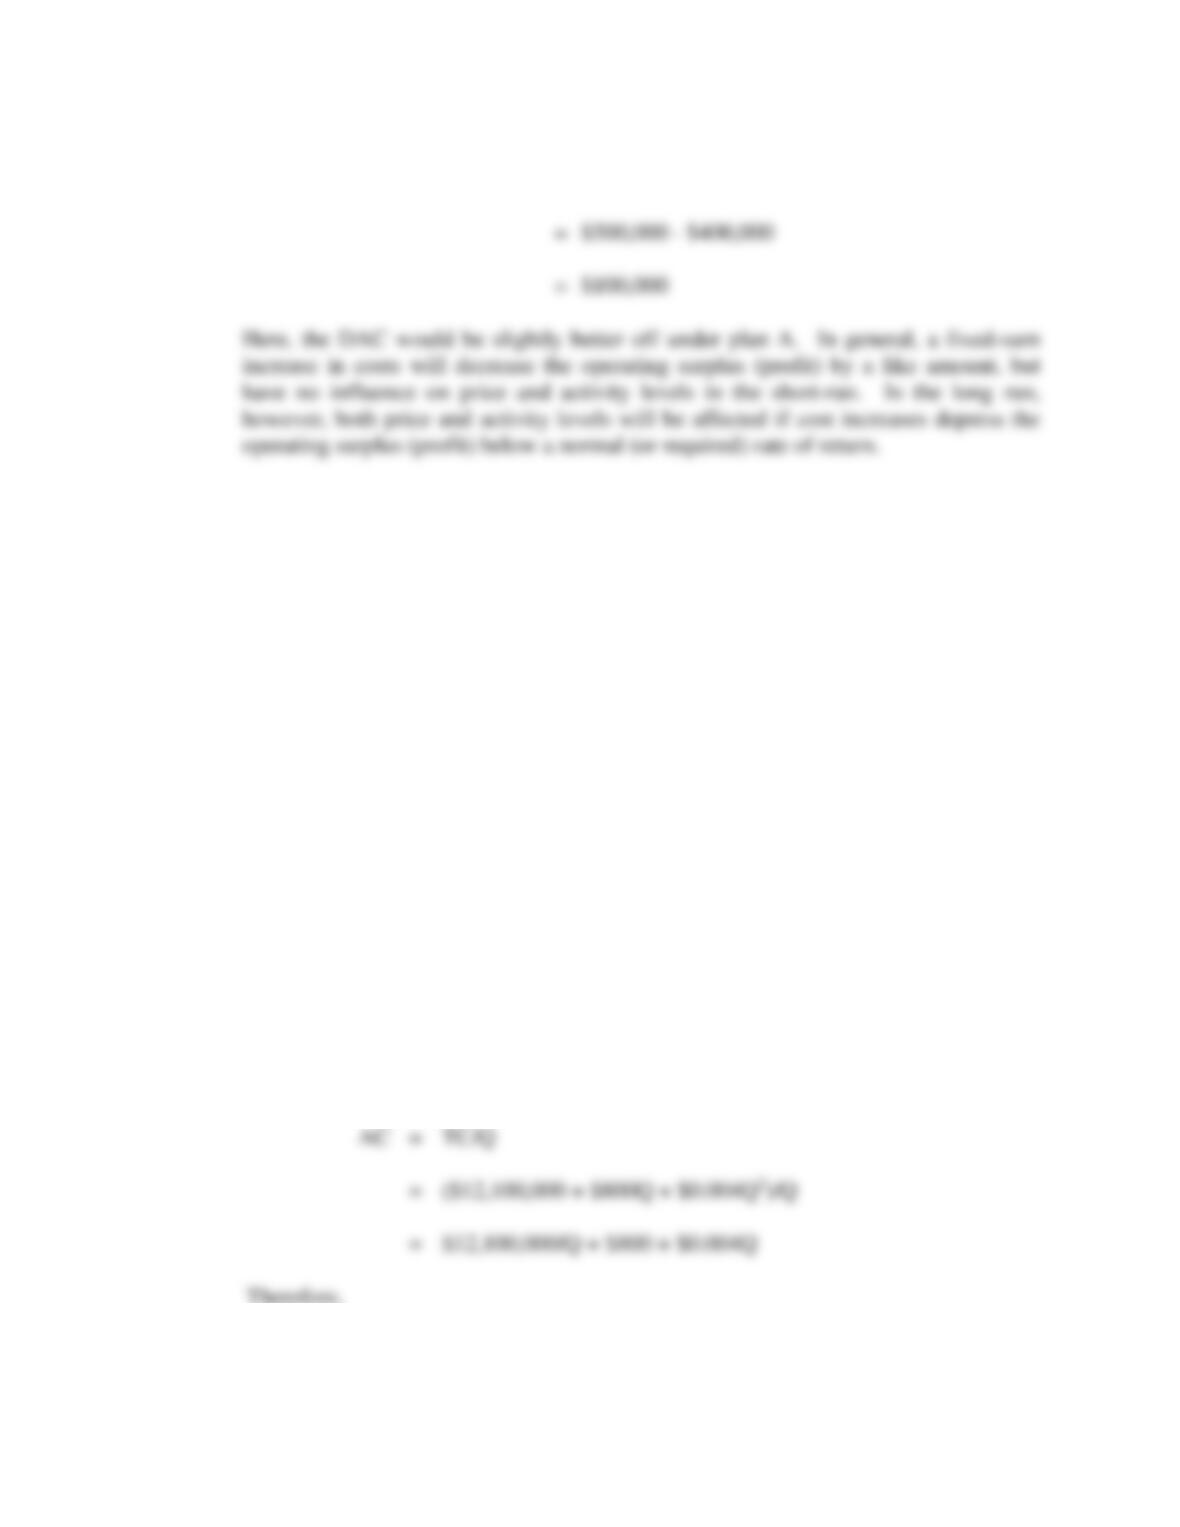
C. When operating costs increase by a flat $400,000 per year, the marginal cost function
Economic Optimization 37
P2.9 Average Cost Minimization. Giant Screen TV, Inc., is a Miami-based importer and
distributor of 60-inch screen HDTVs for residential and commercial customers.
Revenue and cost relations are as follows:
TR = $1,800Q – $0.006Q2
MR = ∂TR/∂Q = $1,800 – $0.012Q
TC = $12,100,000 + $800Q + $0.004Q2
MC = ∂TC/∂Q = $800 + $0.008Q
A. Calculate output, marginal cost, average cost, price, and profit at the average
cost-minimizing activity level.
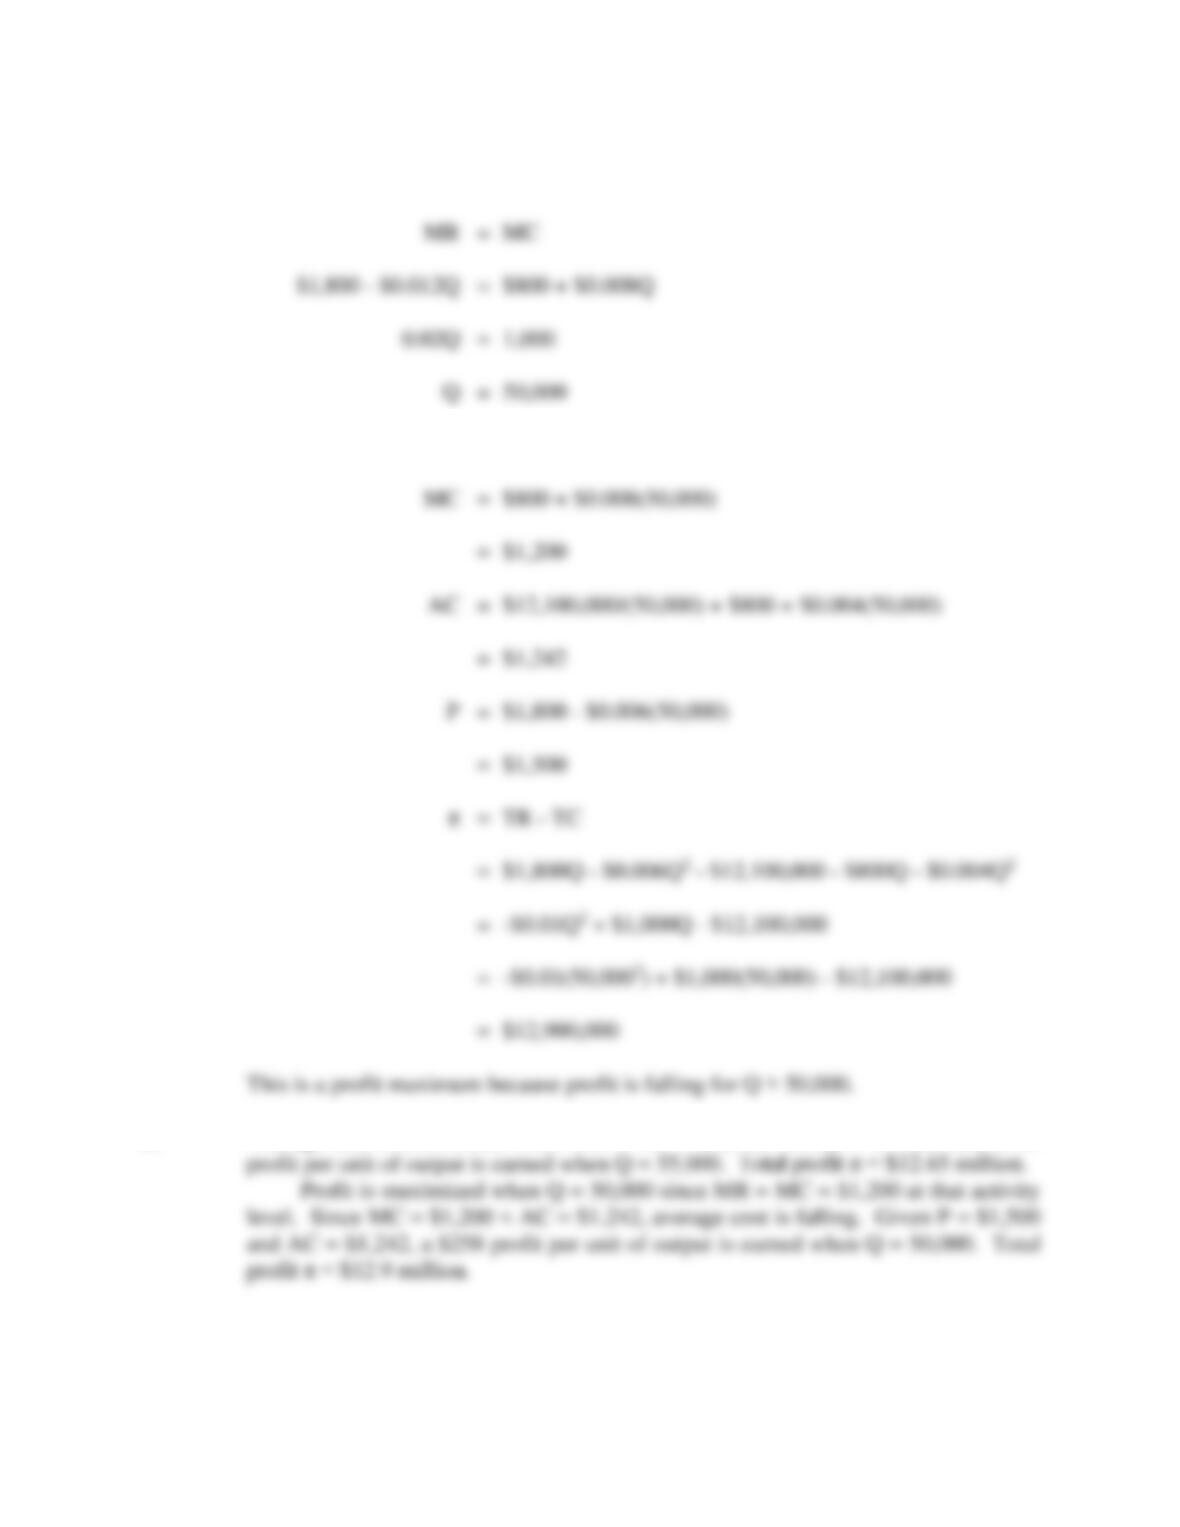
B. Calculate these values at the profit-maximizing activity level.
C. Compare and discuss your answers to parts A and B.
P2.9 SOLUTION
A. To find the average cost-minimizing level of output, set MC = AC and solve for Q.
Because,
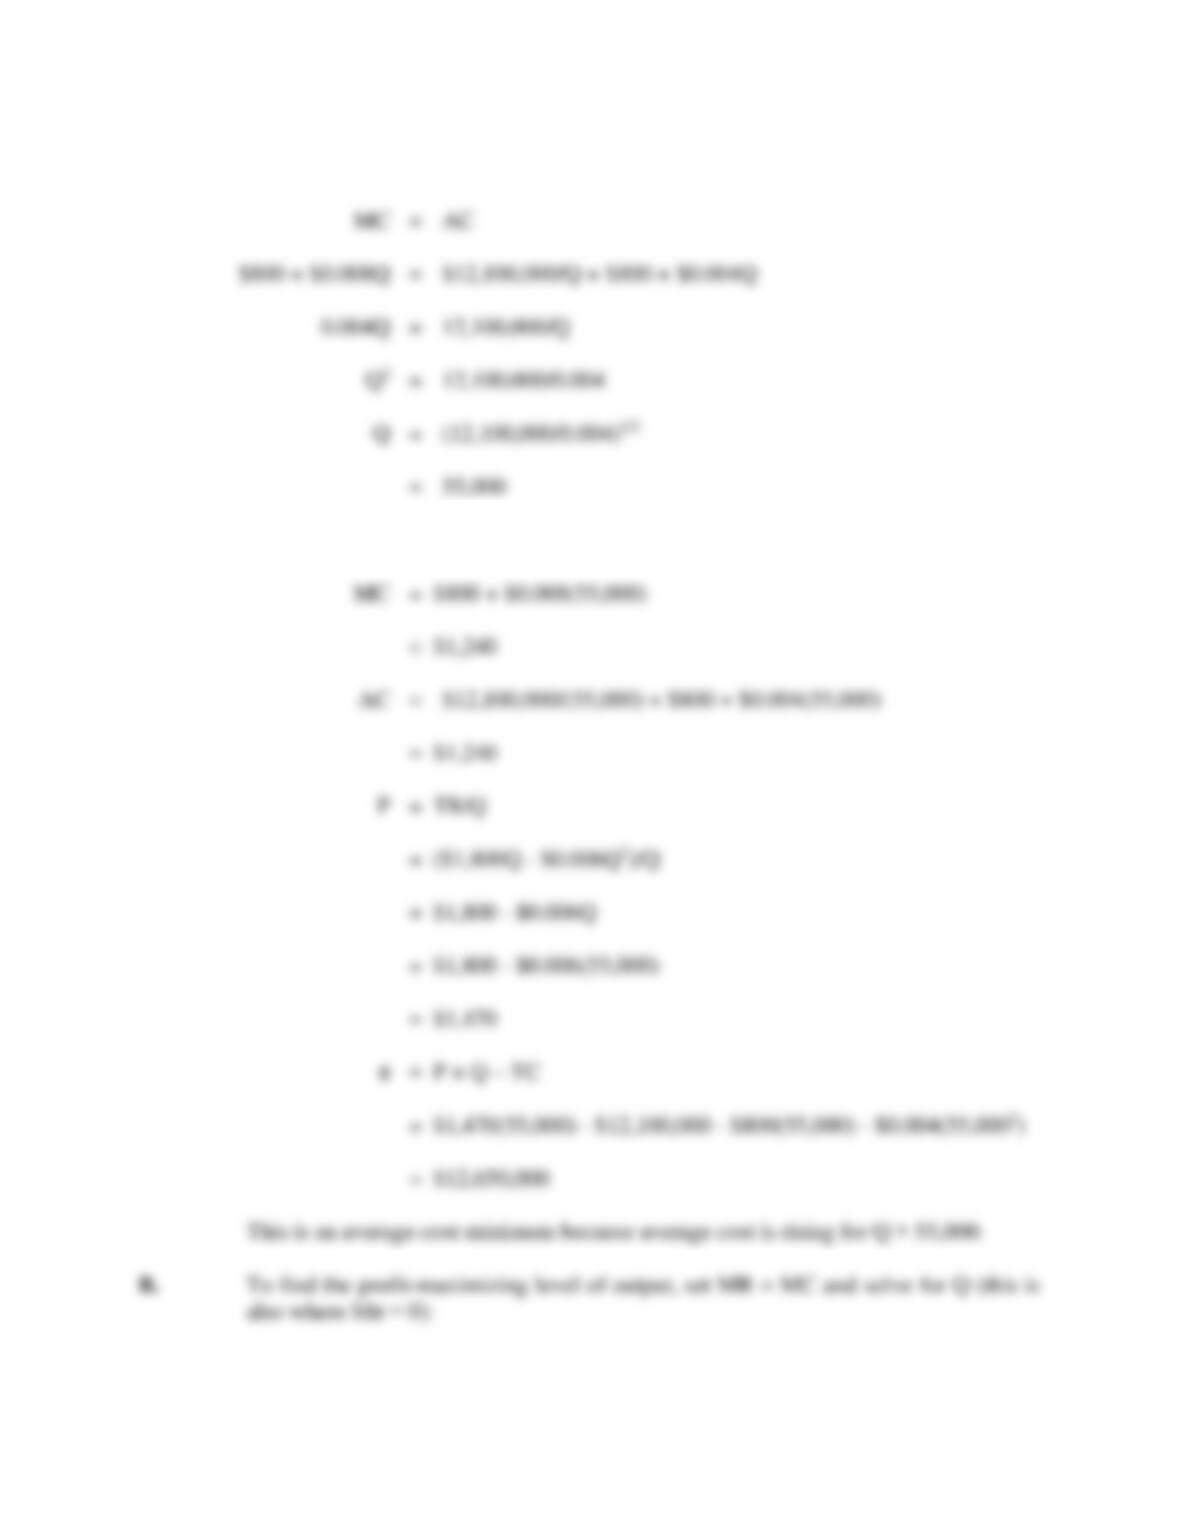
38 Chapter 2
And,
Economic Optimization 39
And
C. Average cost is minimized when MC = AC = $1,240. Given P = $1,470, a $230
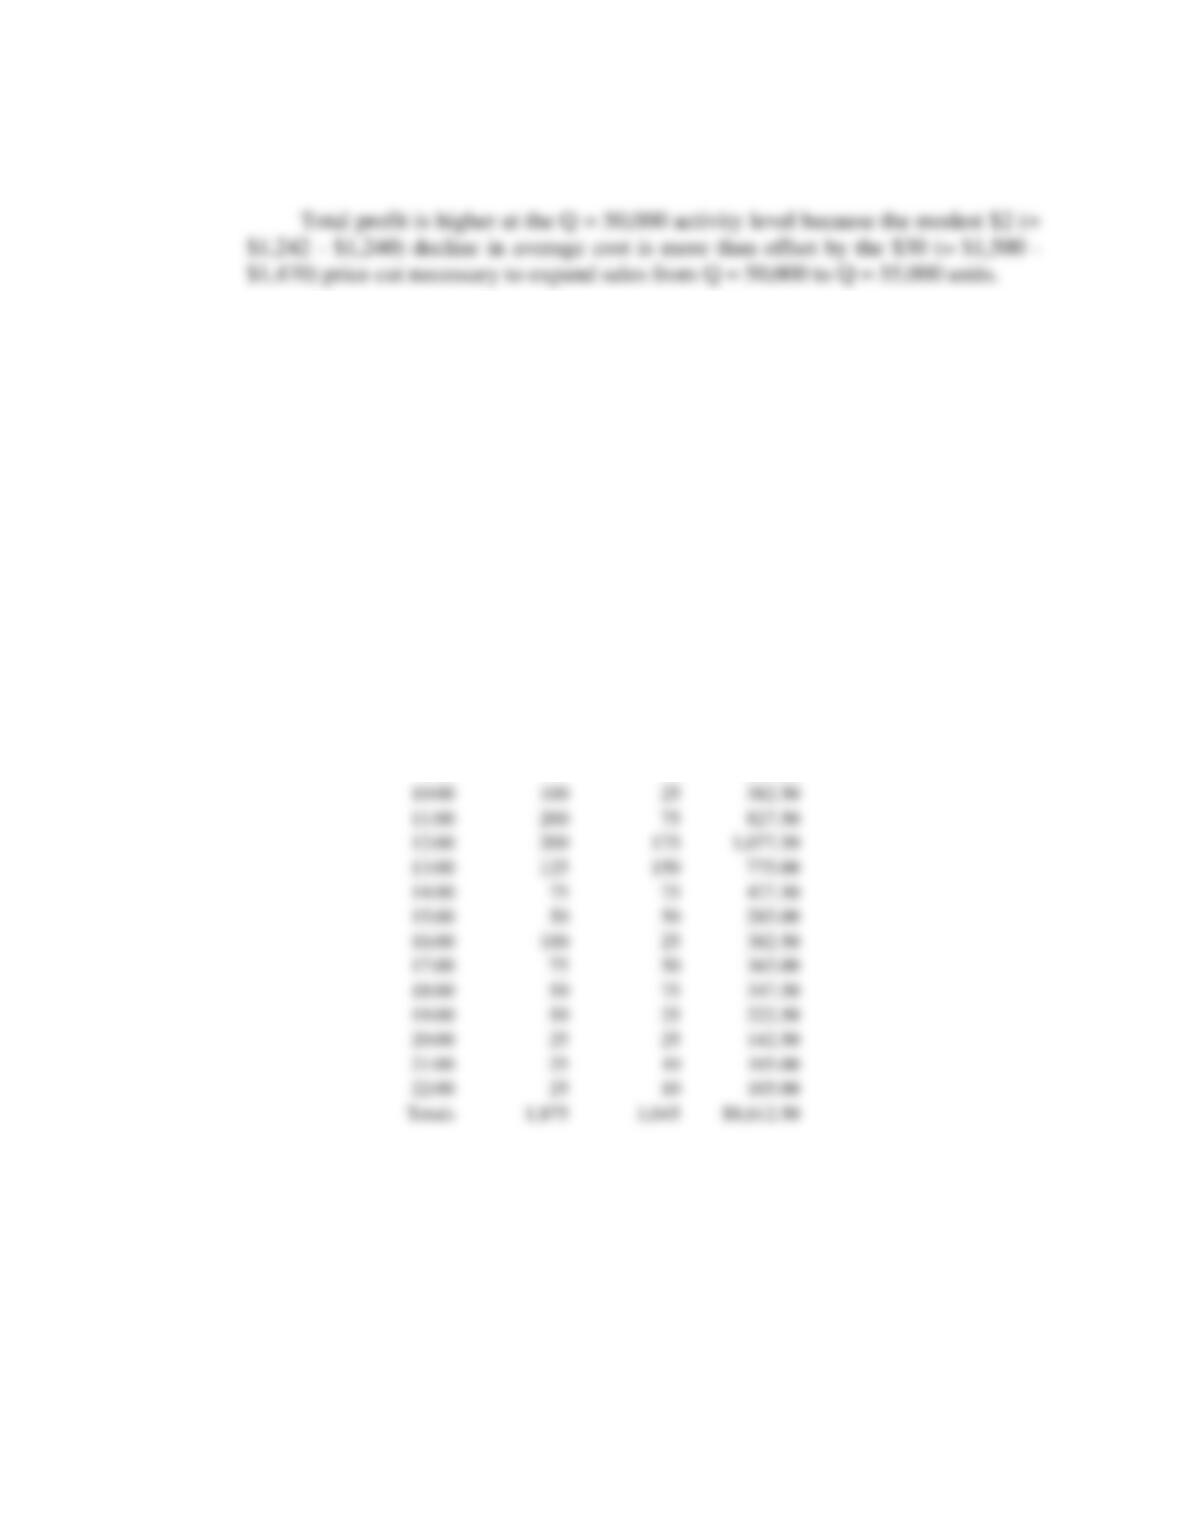
40 Chapter 2
P2.10 Incremental Analysis. Founded in 1985, Starbucks Corporation offers brewed
coffees, espresso beverages, cold blended beverages, various complementary food
items, and related products at over 12,000 retail outlets in the United States Canada,
the United Kingdom, Thailand, Australia, Germany, China, Singapore, Puerto Rico,
Chile, and Ireland. Over 100 outlets are featured in the Greater Chicago Land area
alone. For a new unit in Chicago’s O’Hare Airport, suppose beverage customers
spend an average $4 on beverages with an 80 percent gross margin, and food
customers spend an average $5 on sandwiches and salads with a 50 percent gross
margin. In both cases, gross margin is simply price minus input cost and does not
reflect variable labor and related expenses. Customer traffic throughout the day is as
follows:
Hour of
day
Beverage
Customers
Food
Customers
Profit
Contribution
6:00
150
50
$605.00
7:00
250
100
1,050.00
8:00
200
75
827.50
9:00
175
50
685.00
100
25
382.50
200
75
827.50
200
175
1,077.50
125
150
775.00
75
427.50
50
285.00
100
25
382.50
50
365.00
75
347.50
25
222.50
25
142.50
10
105.00
10
105.00
A. Assume labor, electricity, and other incremental costs are $175 per hour of
operation; calculate the profit-maximizing hours of operation per day.
B. Assume the store is open 365 days per year, and that incremental rental costs
are $2 million per year. Calculate optimal incremental profits. Should
Starbucks close this site?
Economic Optimization 41
P2.10 SOLUTION
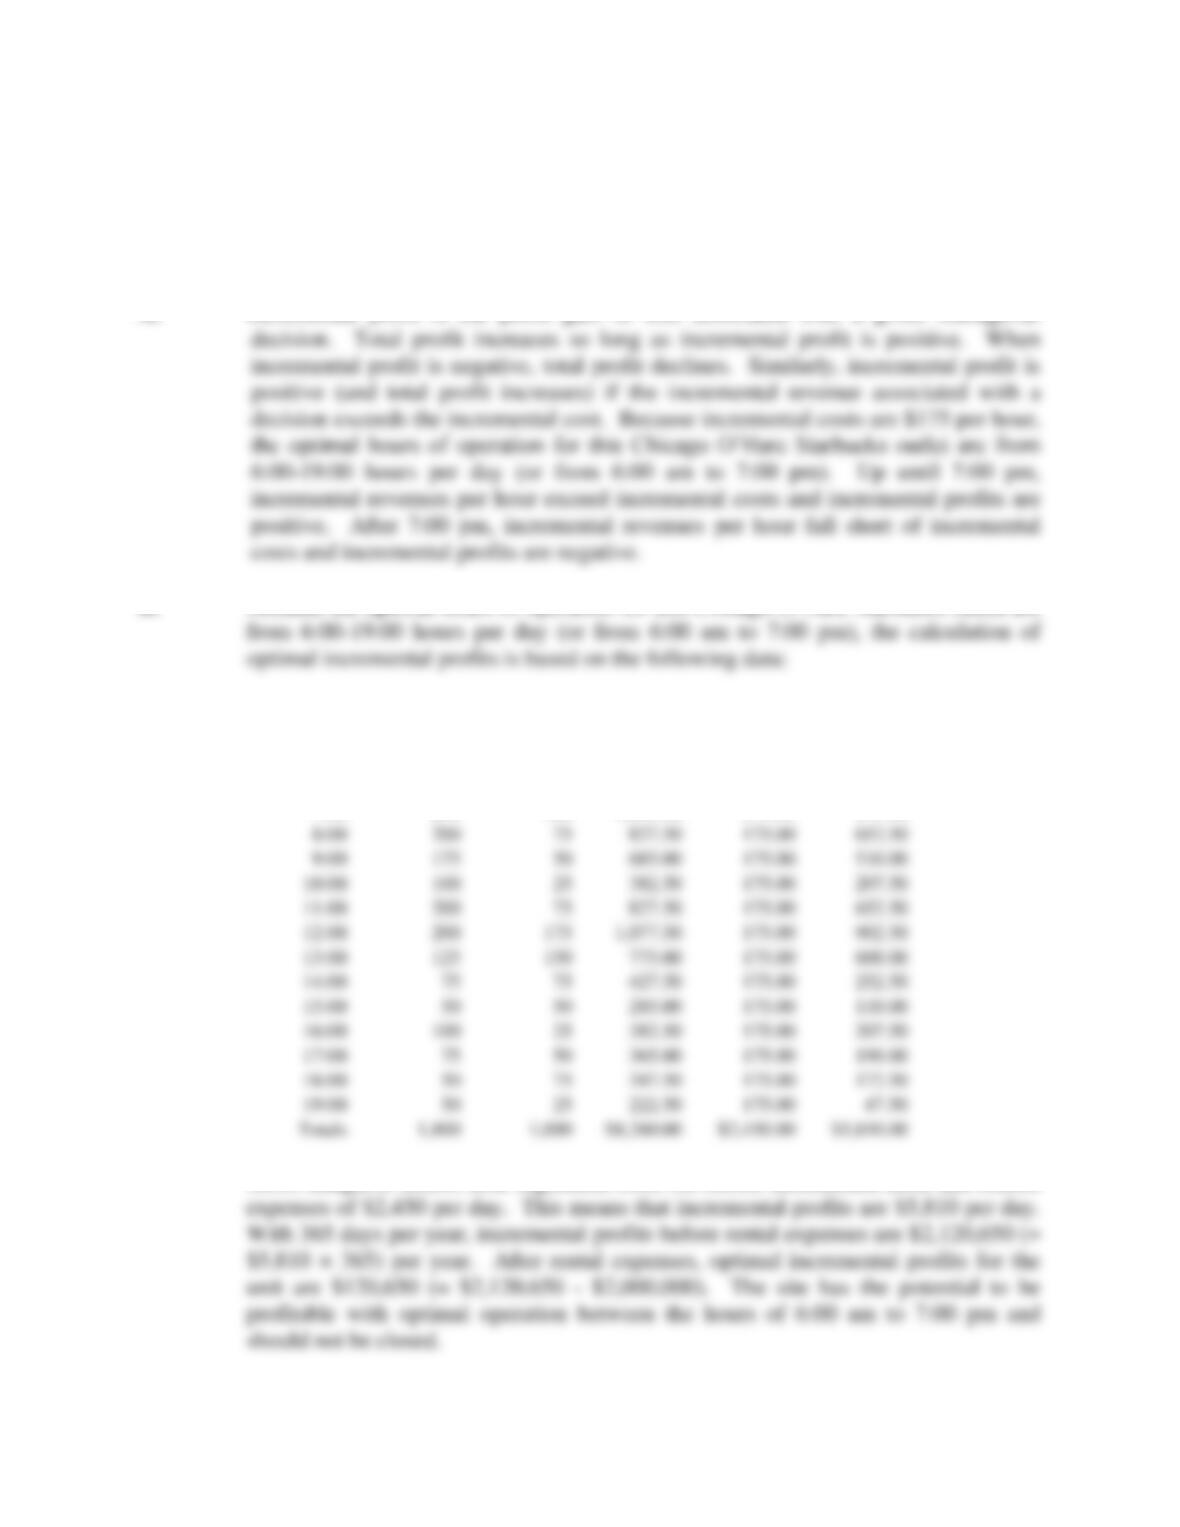
A. Incremental profit is the profit gain or loss associated with a given managerial
B. Because the optimal hours of operation for this Chicago O’Hare Starbucks outlet are
Hour of
day
Beverage
Customers
Food
Customers
Gross
Margin
Incremental
Costs/hour
Incremental
Profits/hour
6:00
150
50
$605.00
175.00
$430.00
7:00
250
100
1,050.00
175.00
875.00
8:00
200
75
175.00
652.50
9:00
175
50
175.00
510.00
100
25
175.00
207.50
200
75
175.00
652.50
200
175
1,077.50
175.00
902.50
125
150
600.00
75
175.00
252.50
50
175.00
110.00
100
25
175.00
207.50
50
175.00
190.00
75
175.00
172.50
25
175.00
Totals
Gross margin is $8,260 after ingredient costs but before incremental labor and related
42 Chapter 2
CASE STUDY FOR CHAPTER 2
Spreadsheet Analysis of the EOQ at the Neighborhood Pharmacy, Inc.
A spreadsheet is a table of data organized in a logical framework similar to an accounting
income statement or balance sheet. At first, this marriage of computers and accounting
information might seem like a minor innovation. However, it is not. For example, with
computerized spreadsheets it becomes possible to easily reflect the effects on revenue, cost, and
profit of a slight change in demand conditions. Similarly, the effects on the profit-maximizing or
breakeven activity levels can be easily determined. Various “what if?” scenarios can also be
tested to determine the optimal or profit-maximizing activity level under a wide variety of
that can be employed to analyze a variety of typical optimization problems.
To illustrate the use of spreadsheets in economic analysis, consider the hypothetical case
of The Neighborhood Pharmacy, Inc. (NPI), a small but rapidly growing operator of a number of
large-scale discount pharmacies in the greater Boston, Massachusetts, metropolitan area. A key
contributor to the overall success of the company is a system of tight controls over inventory
acquisition and carrying costs. The company’s total annual costs for acquisition and inventory
of pharmaceutical items are composed of the purchase cost of individual products supplied by
wholesalers (purchase costs); the clerical, transportation, and other costs associated with
placing each individual order (order costs); and the interest, insurance, and other expenses
involved with carrying inventory (carrying costs). The company’s total inventory-related costs
During the relevant planning period, the per unit purchase cost for an important
prescribed (ethical) drug is P = $4, the total estimated use for the planning period is X = 5,000,
the cost of placing an order is Θ = $50; and the per unit carrying cost is C = $0.50, calculated
as the current interest rate of 12.5 percent multiplied by the per unit purchase cost of the item.
Economic Optimization 43
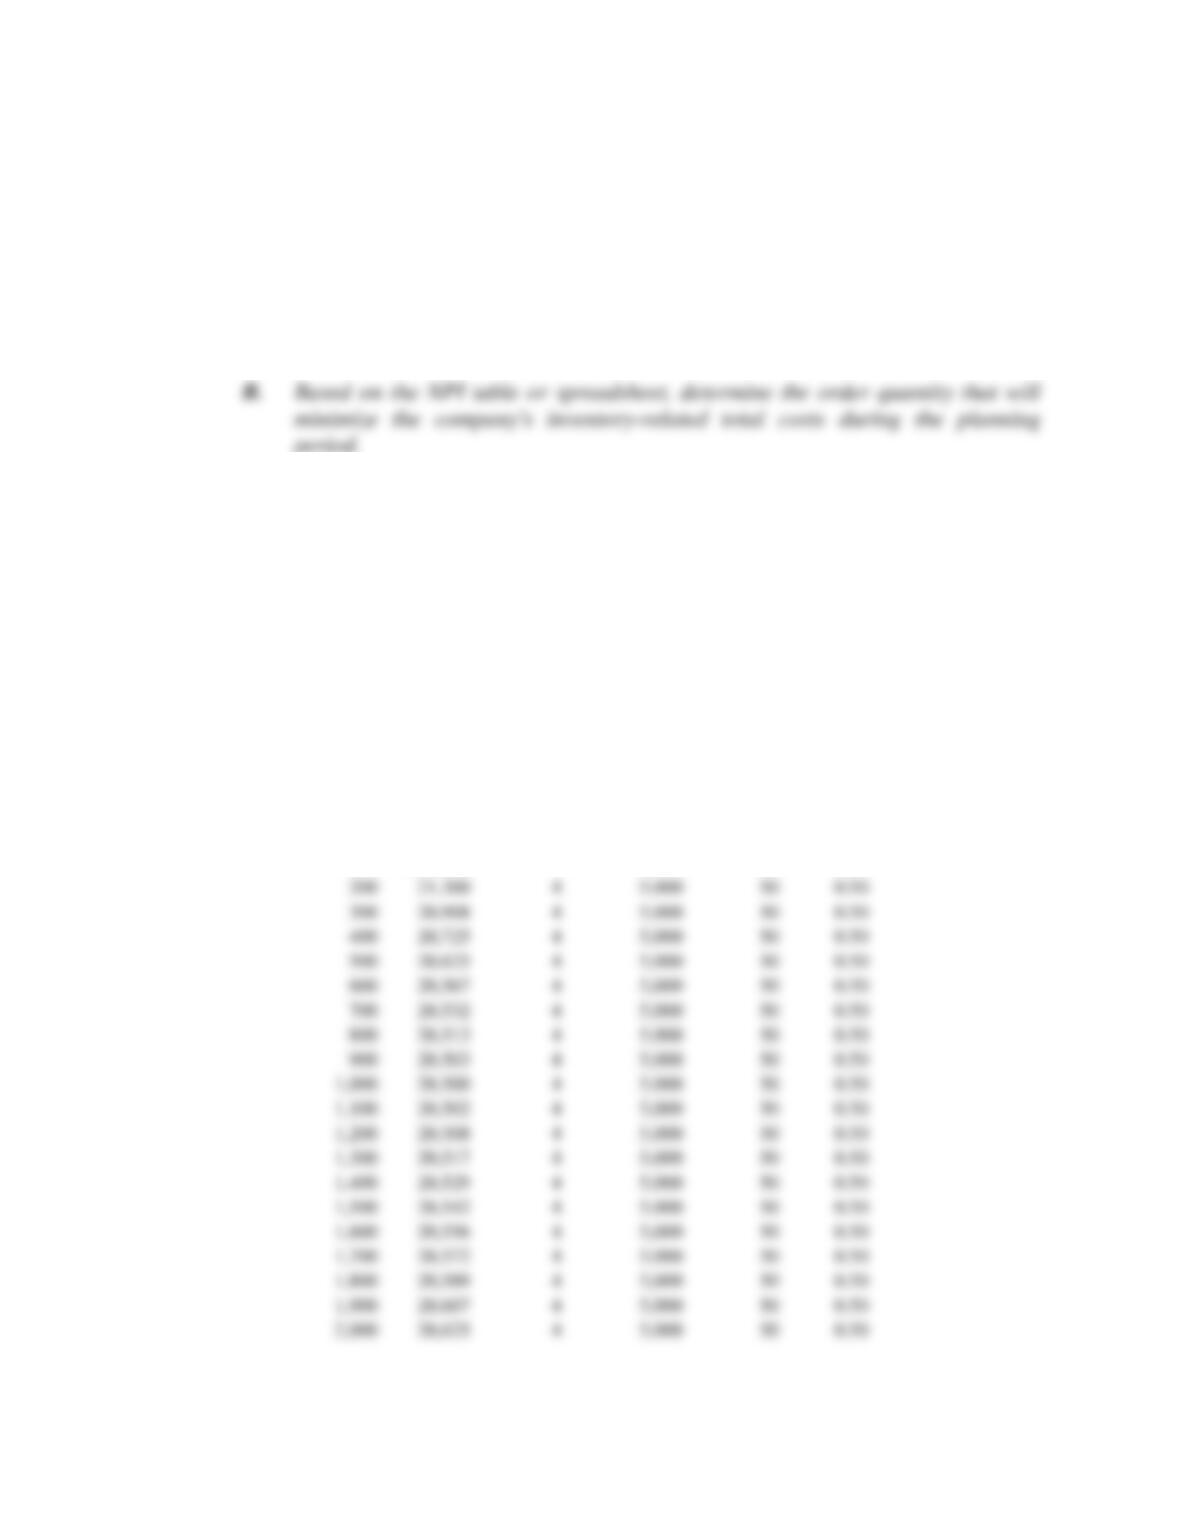
A. Set up a table or spreadsheet for NPI’s order quantity (Q), inventory-related
total cost (TC), purchase price (P), use requirement (X), order cost (Θ), and
carrying cost (C). Establish a range for Q from 0 to 2,000 in increments of 100
(i.e., 0, 100, 200, …, 2,000).
period.
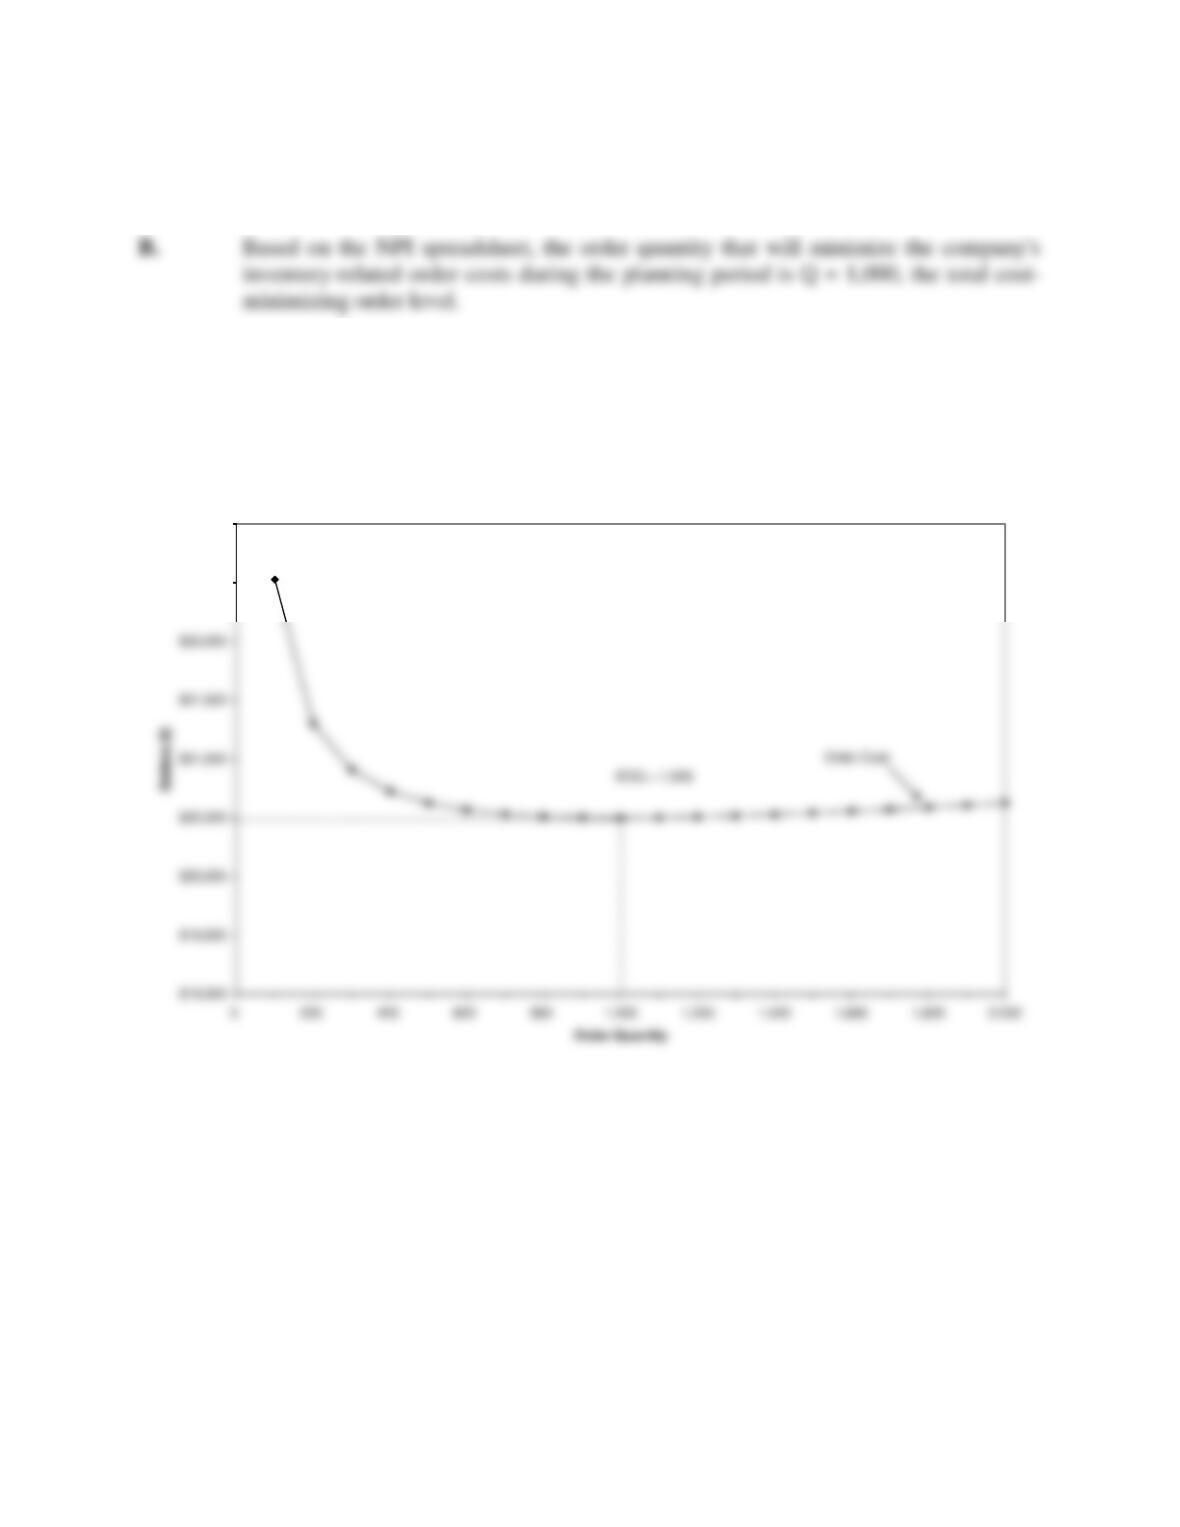
C. Placing inventory-related total costs, TC, on the vertical or y-axis and the order
quantity, Q, on the horizontal or x-axis, plot the relation between inventory–
related total costs and the order quantity.
CASE STUDY SOLUTION
A. The table or spreadsheet for NPI’s order quantity (Q), inventory-related total cost
(TC), purchase price (P), use requirement (X), order cost (Θ), and carrying cost (C)
appears as follows:
Quantity
(Q)
Total
Cost
(TC)
Price (P)
Use
Requirement
(X)
Order
Cost θ
Carrying
Cost (C)
0
4
5,000
$50
$0.50
100
$22,525
4
5,000
50
0.50
200
4
5,000
50
0.50
300
4
5,000
50
0.50
400
4
5,000
50
0.50
500
4
5,000
50
0.50
600
4
5,000
50
0.50
700
4
5,000
50
0.50
800
4
5,000
50
0.50
900
4
5,000
0.50
1,000
4
5,000
50
0.50
1,100
4
5,000
50
0.50
1,200
4
5,000
50
0.50
1,300
4
5,000
50
0.50
1,400
4
5,000
50
0.50
1,500
4
5,000
50
0.50
1,600
4
5,000
50
0.50
1,700
4
5,000
50
0.50
1,800
4
5,000
50
0.50
1,900
4
5,000
50
0.50
44 Chapter 2
C. Using inventory-related total costs, TC, on the vertical Y axis, and the order quantity,
Q, on the horizontal X axis, a plot of the relation between inventory-related total costs
and the order quantity appears as follows:
Neighborhood Pharmacy EOQ
$22,500
$23,000
Economic Optimization 45
Appendix 2B
MULTIVARIATE OPTIMIZATION AND THE LAGRANGIAN TECHNIQUE
PROBLEM AND SOLUTION
2B.1 Lagrangian Multipliers. Amos Jones and Andrew Brown own and operate Amos &
Andy, Inc., a Minneapolis-based installer of conversion packages for vans
manufactured by the major auto companies. Amos & Andy has fixed capital and
labor expenses of $1.2 million per year, and variable materials expenses average
$2,000 per van conversion. Recent operating experience suggests the following
annual demand relation for Amos & Andy products:
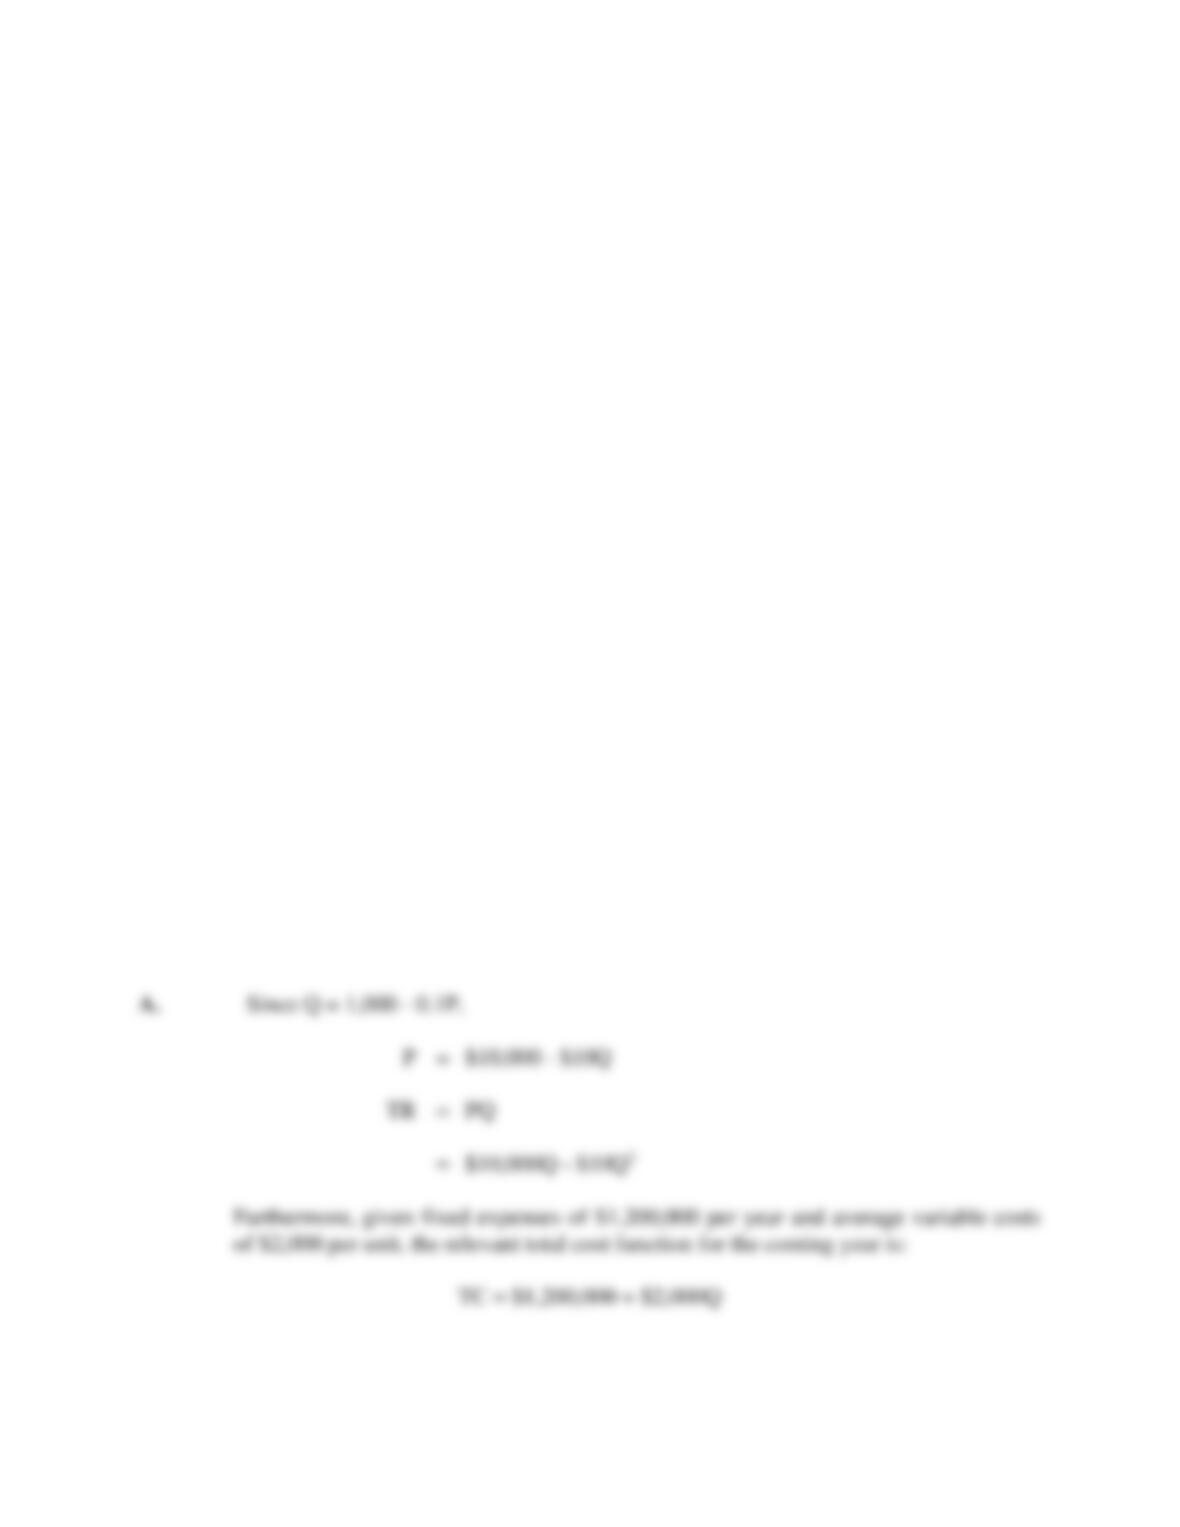
Q = 1,000 – 0.1P
where Q is the number of van conversions (output) and P is price.
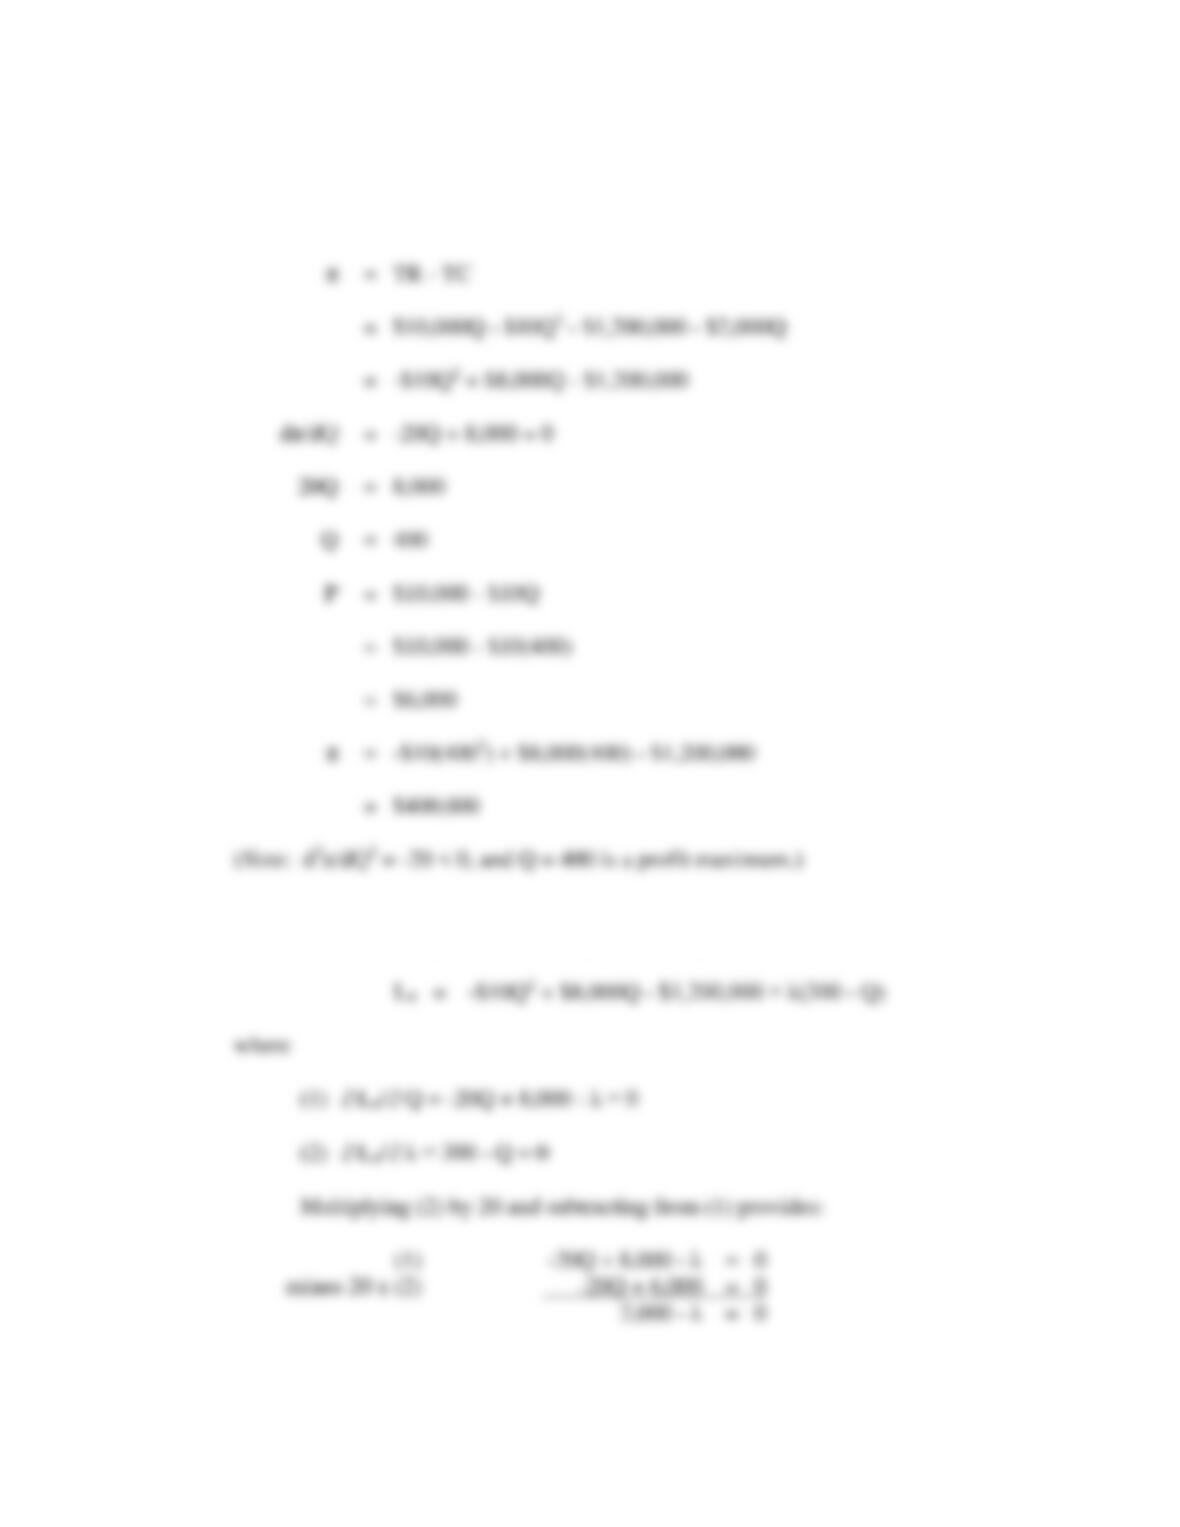
A. Calculate Amos & Andy’s profit-maximizing output, price, and profit levels.
B. Using the Lagrangian multiplier method, calculate profit-maximizing output,
price, and profit levels in light of a parts shortage that limits Amos & Andy’s
output to 300 conversions during the coming year.
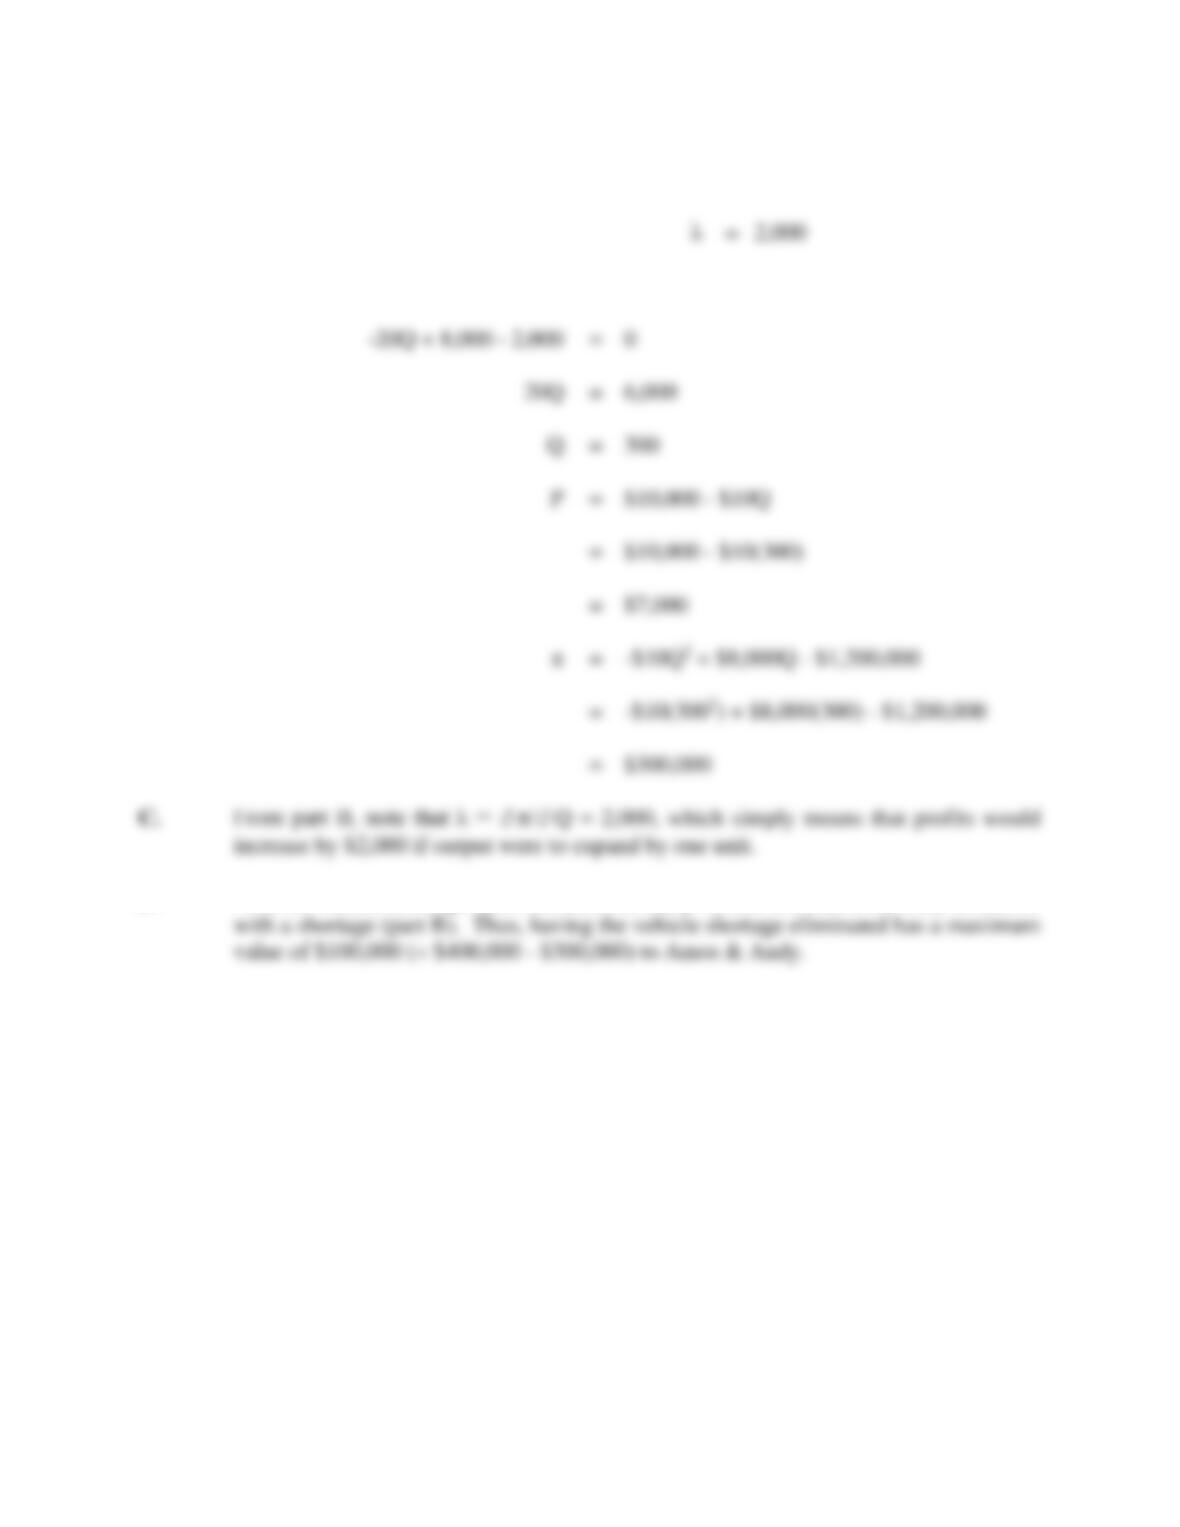
C. Calculate and interpret λ, the Lagrangian multiplier.
D. Calculate the value to Amos & Andy of having the parts shortage eliminated.
P2B.1 SOLUTION
46 Chapter 2
The Amos & Andy profit function is
B. With Amos & Andy output limited to Q = 300, the constraint 0 = 300 – Q becomes
active. Amos & Andys’ constrained optimization problem can then be written
Economic Optimization 47
Then substituting λ = 2,000 into (1) yields:
D. With no vehicle shortage (part A) Amos & Andy earned $400,000, but only $300,000