Chapter 2
ECONOMIC OPTIMIZATION
QUESTIONS & ANSWERS
Q2.1 In 2007, Chrysler Group said it would cut 13,000 jobs, close a major assembly plant
and reduce production at other plants as part of a restructuring effort designed to
restore profitability at the auto maker by 2008. Its German parent, DaimlerChrysler
said it is looking into further strategic options with partners to optimize and
accelerate the plan as it seeks the best solutions for its struggling U.S. unit. Does this
decision reflect an application of the global or partial optimization concept?
Explain.
Q2.1 ANSWER
Chrysler’s decision to scale back employment at four assembly plants is a reflection
of partial optimization because its decision alternatives were constrained by past
decisions. The complexity of a completely integrated decision analysis approach—or
Q2.2 “The personal computer is a calculating device and a communicating device.
Spreadsheets incorporate the best of both characteristics by allowing managers to
determine and communicate the optimal course of action.” Discuss this statement
and explain why computer spreadsheets are a popular means for expressing and
analyzing economic relations.
Q2.2 ANSWER
Economic Optimization 13
When tables of economic data are displayed electronically in the format of an
accounting income statement or balance sheet, such tables are often referred to as
spreadsheets. Microsoft Excel and other spreadsheet software programs are popular
Q2.3 For those 50 or older, membership in AARP, formerly known as the American
Association of Retired Persons, brings numerous discounts for health insurance,
hotels, auto rentals, shopping, travel planning, etc. Use the marginal profit concept
to explain why vendors seek out bargain-priced business with AARP members.
Q2.3 ANSWER
The rise (or fall) in total profit associated with a one-unit increase in output is
marginal profit. The marginal profit concept is critical in managerial economics
Q2.4 If a baseball player hits .285 during a given season, the player’s lifetime batting
average of .278 will rise. Use this observation to explain why the marginal cost
curve always intersects the related average cost curve at either a maximum or a
minimum point.
14 Chapter 2
Q2.4 ANSWER
The marginal observation can increase, decrease, or have no effect on the average. If
the marginal is greater than the average, the average will rise. If the marginal is less
Q2.5 Southwest Airlines is known for offering cut-rate promotional fares to build customer
awareness, grow market share, and boost revenues in new markets. Would you
expect total revenue to be maximized at an output level that is typically greater than
or less than the short-run profit-maximizing output level? Is such an approach
incompatible with long-run profit maximization?
Q2.5 ANSWER
Marginal revenue equals zero at the output level where total revenue is maximized.
On the other hand, marginal revenue equals marginal cost at the output level where
total profit is maximized. Given a typically downward sloping demand curve and
Q2.6 Intel Corp. designs, develops, manufactures and sells integrated circuit solutions for
wireless data and personal computer (PC) applications. The company is expanding
rapidly to achieve hoped-for reductions in average costs as output expands. Does
the point of minimum long-run average costs always represent the optimal activity
level?
Q2.6 ANSWER
Economic Optimization 15
Q2.7 McDonald’s restaurants do the bulk of their business at lunchtime, but have found
that promotionally-priced meals at breakfast and dinner make a significant profit
contribution. Does the success of McDonald’s restaurants in this regard reflect an
effective application of the marginal profit concept or the incremental profit
concept? Explain.
Q2.7 ANSWER
The success of McDonald’s restaurants in offering promotionally-priced breakfast
and dinner items reflects an effective application of the incremental profit concept.
Q2.8 Economists have long argued that if you want to tax away excess profits without
affecting allocative efficiency, you should use a lump-sum tax instead of an excise or
sales tax. Use the concepts developed in the chapter to support this position.
Q2.8 ANSWER
Lump-sum taxes only affect total fixed costs. They are invariant with respect to the
activity level of the firm. Thus, lump-sum taxes will not appear in the marginal
16 Chapter 2
Q2.9 “It is often impossible to obtain precise information about the pattern of future
Q2.9 ANSWER
A view of the process of economic optimization as futile, given the obvious
uncertainty regarding the future pattern of economic activity, is plainly incorrect.
Q2.10 In estimating regulatory benefits, the Environmental Protection Agency (EPA) and
other government agencies typically assign a value of approximately $6 million to
each life saved. What factors might the EPA consider in arriving at such a
valuation? How would you respond to criticism directed at the EPA that life is
precious and cannot be valued in dollar terms?
Q2.10 ANSWER
From an economic standpoint, the effectiveness of regulatory policy can and should
be measured in terms of resulting costs and benefits. When clean-air standards result
in a reduction of smog and other pollutants, important benefits are experienced in
Economic Optimization 17
SELF-TEST PROBLEMS AND SOLUTIONS
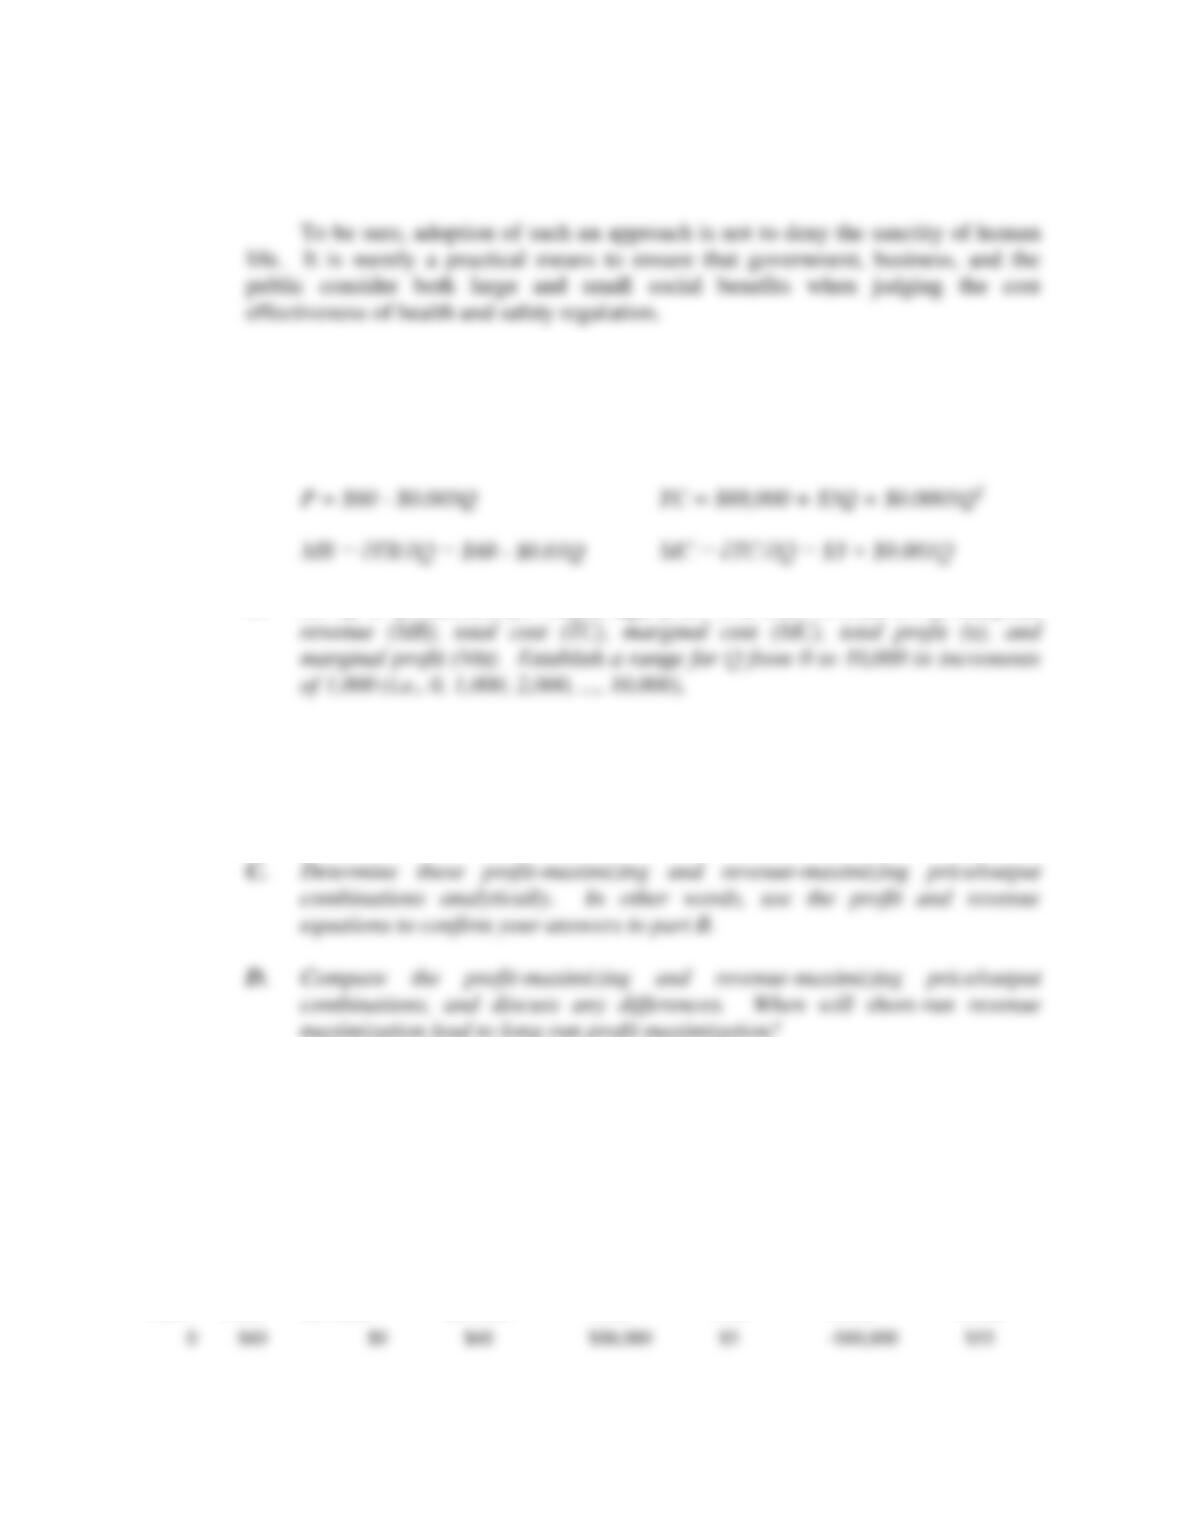
ST2.1 Profit versus Revenue Maximization. Presto Products, Inc., recently introduced an
innovative new frozen dessert maker with the following revenue and cost relations:
A. Set up a spreadsheet for output (Q), price (P), total revenue (TR), marginal
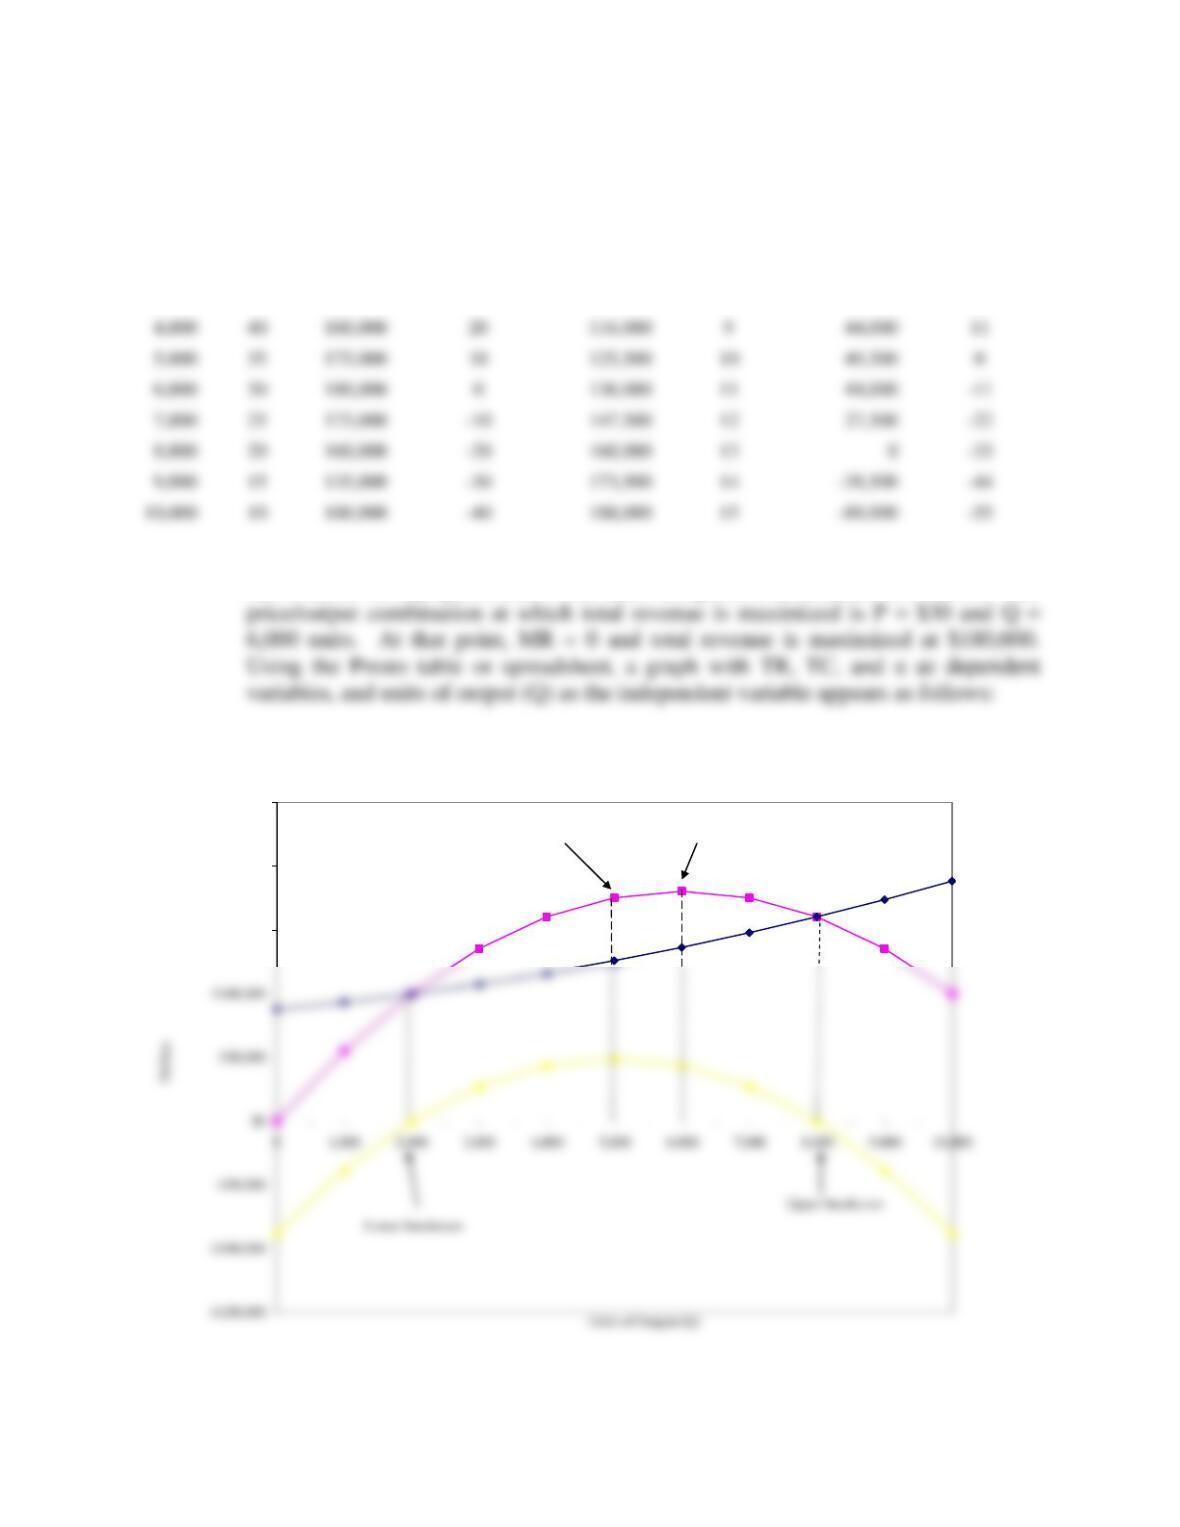
B. Use the spreadsheet to, create a graph with TR, TC, and π as dependent
variables, and units of output (Q) as the independent variable. At what
price/output combination is total profit maximized? At what price/output
combination is total revenue maximized?
ST2.1 SOLUTION
A. A table or spreadsheet for Presto output (Q), price (P), total revenue (TR), marginal
revenue (MR), total cost (TC), marginal cost (MC), total profit (π), and marginal
profit (Mπ) appears as follows:
Presto Products
Units
Price
Total
Revenue
Marginal
Revenue
Total
Cost
Marginal
Cost
Total
Profit
Marginal
Profit
18 Chapter 2
1,000
55
55,000
50
93,500
6
-38,500
44
2,000
50
100,000
40
100,000
7
0
33
3,000
45
135,000
30
107,500
8
27,500
22
B. The price/output combination at which total profit is maximized is P = $35 and Q =
5,000 units. At that point, MR = MC and total profit is maximized at $49,500. The
Presto Products, Inc.
Profit vs. Revenue Maximization
$150,000
$200,000
$250,000
Profit maximization
Revenue Maximization
4,000
40
160,000
20
116,000
9
44,000
11
5,000
35
175,000
10
125,500
49,500
6,000
30
180,000
136,000
44,000
7,000
25
175,000
147,500
27,500
8,000
20
160,000
160,000
0
9,000
15
135,000
173,500
-38,500
10
100,000
188,000
-88,000
Economic Optimization 19
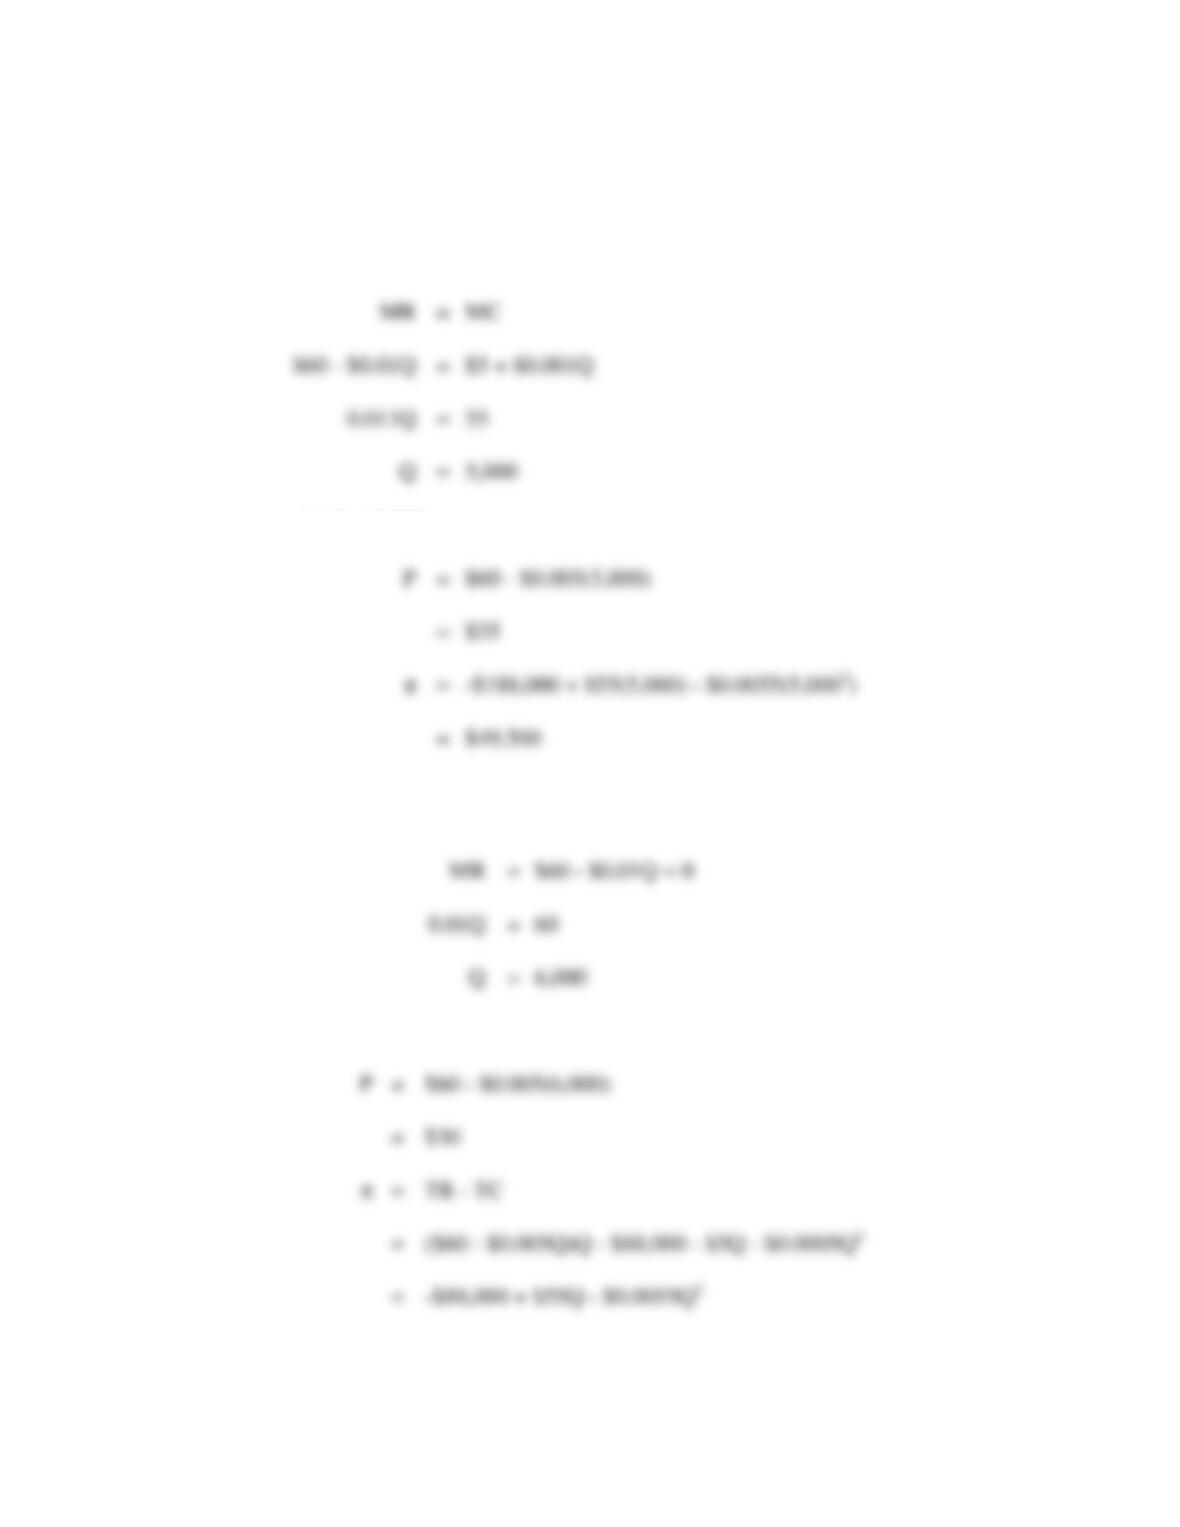
C. To find the profit–maximizing output level analytically, set Mπ = MR – MC = 0 or
MR = MC, and solve for Q. Because
At Q = 5,000,
This is a profit maximum because total profit is falling for Q > 5,000. To find the
revenue-maximizing output level, set MR = 0, and solve for Q. Thus,
At Q = 6,000,
20 Chapter 2
D. Given downward sloping demand and marginal revenue curves and positive marginal
costs, the profit-maximizing price/output combination is always at a higher price and
lower production level than the revenue-maximizing price-output combination. This
ST2.2 Average Cost-Minimization. Pharmed Caplets is an antibiotic product with monthly
revenues and costs of:
TR = $900Q – $0.1Q2 TC = $36,000 + $200Q + $0.4Q2
MR = ∂TR/∂Q = $900 – $0.2Q MC = ∂TC/∂Q = $200 + $0.8Q
A. Set up a spreadsheet for output (Q), price (P), total revenue (TR), marginal
revenue (MR), total cost (TC), marginal cost (MC), average cost (AC), total
profit (π), and marginal profit (Mπ). Establish a range for Q from 0 to 1,000 in
increments of 100 (i.e., 0, 100, 200, …, 1,000).
B. Using the spreadsheet to, create a graph with MR, MC, and AC as dependent
Economic Optimization 21
D. Compare the profit-maximizing and average-cost minimizing price/output
ST2.2 SOLUTION
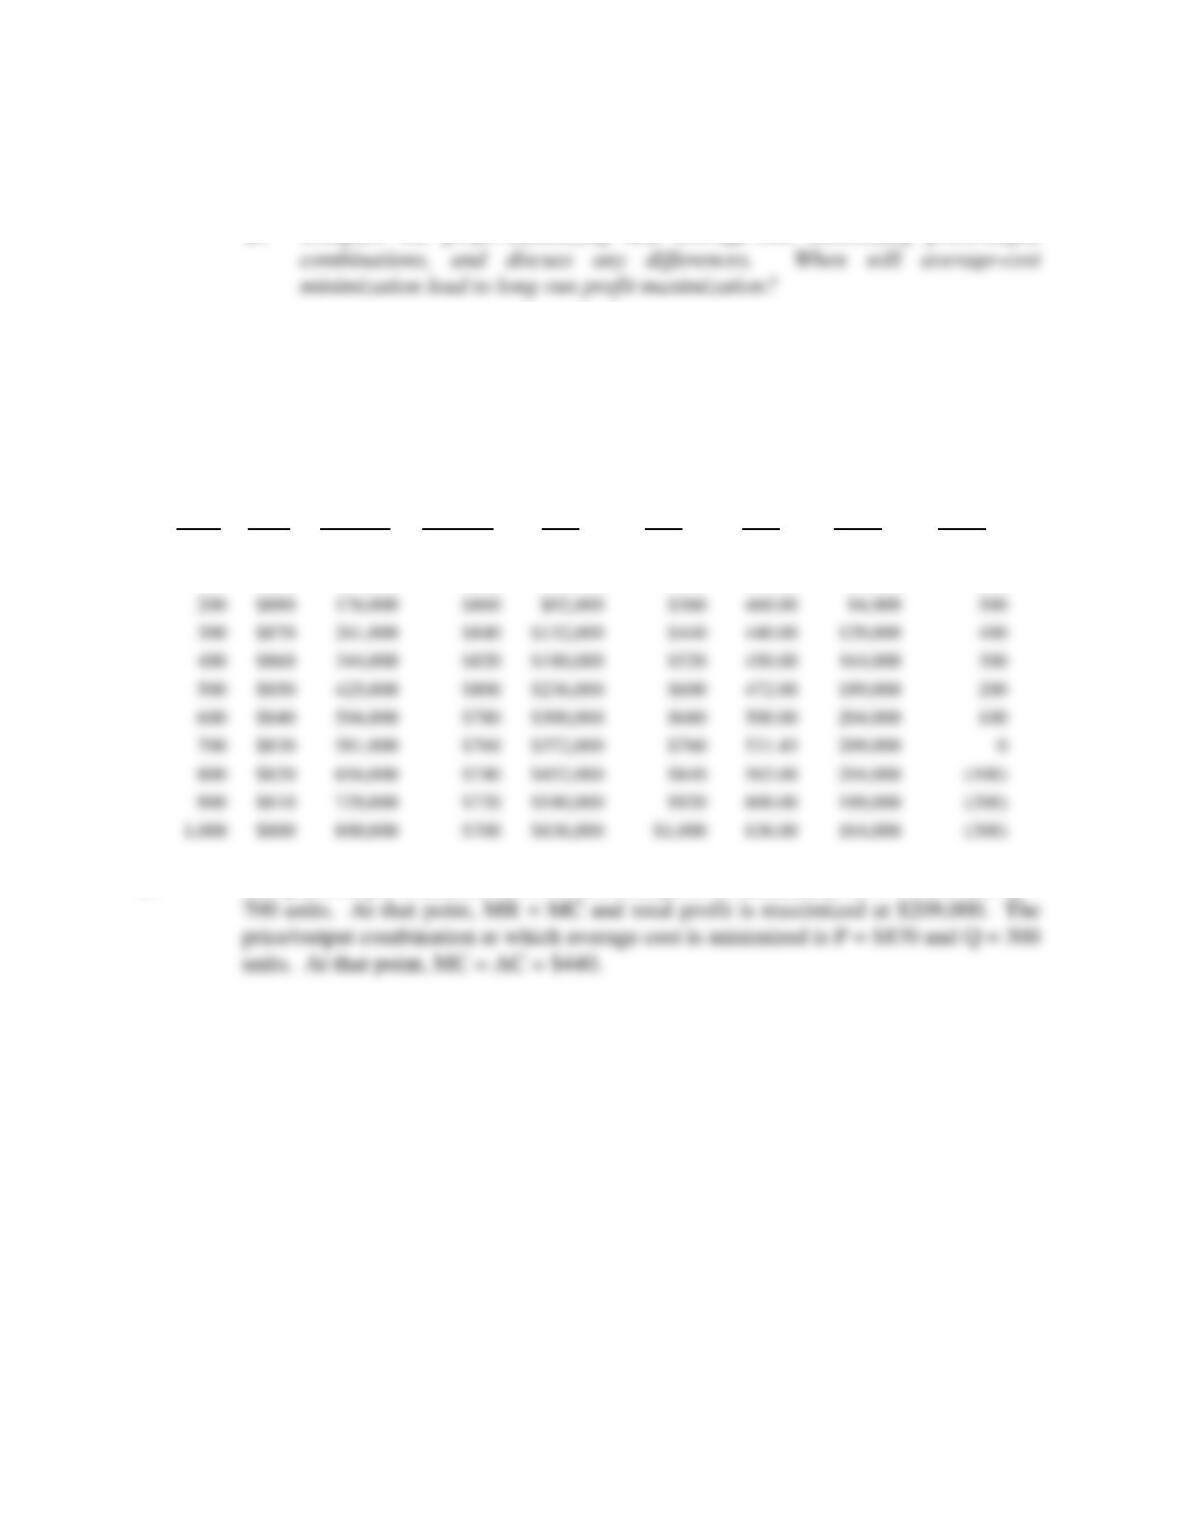
A. A table or spreadsheet for output (Q), price (P), total revenue (TR), marginal
revenue (MR), total cost (TC), marginal cost (MC), average cost (AC), total
profit (π), and marginal profit (Mπ) appears as follows:
Units
Price
Total
Revenue
Marginal
Revenue
Total
Cost
Marginal
Cost
Average
Cost
Total
Profit
Marginal
Profit
0
$900
$0
$900
$36,000
$200
—
($36,000)
$700
100
$890
89,000
$880
$60,000
$280
600.00
29,000
600
300
$870
261,000
$840
$440
440.00
400
500
$850
425,000
$800
$600
472.00
200
800
$820
656,000
$740
$840
565.00
B. The price/output combination at which total profit is maximized is P = $830 and Q =
22 Chapter 2
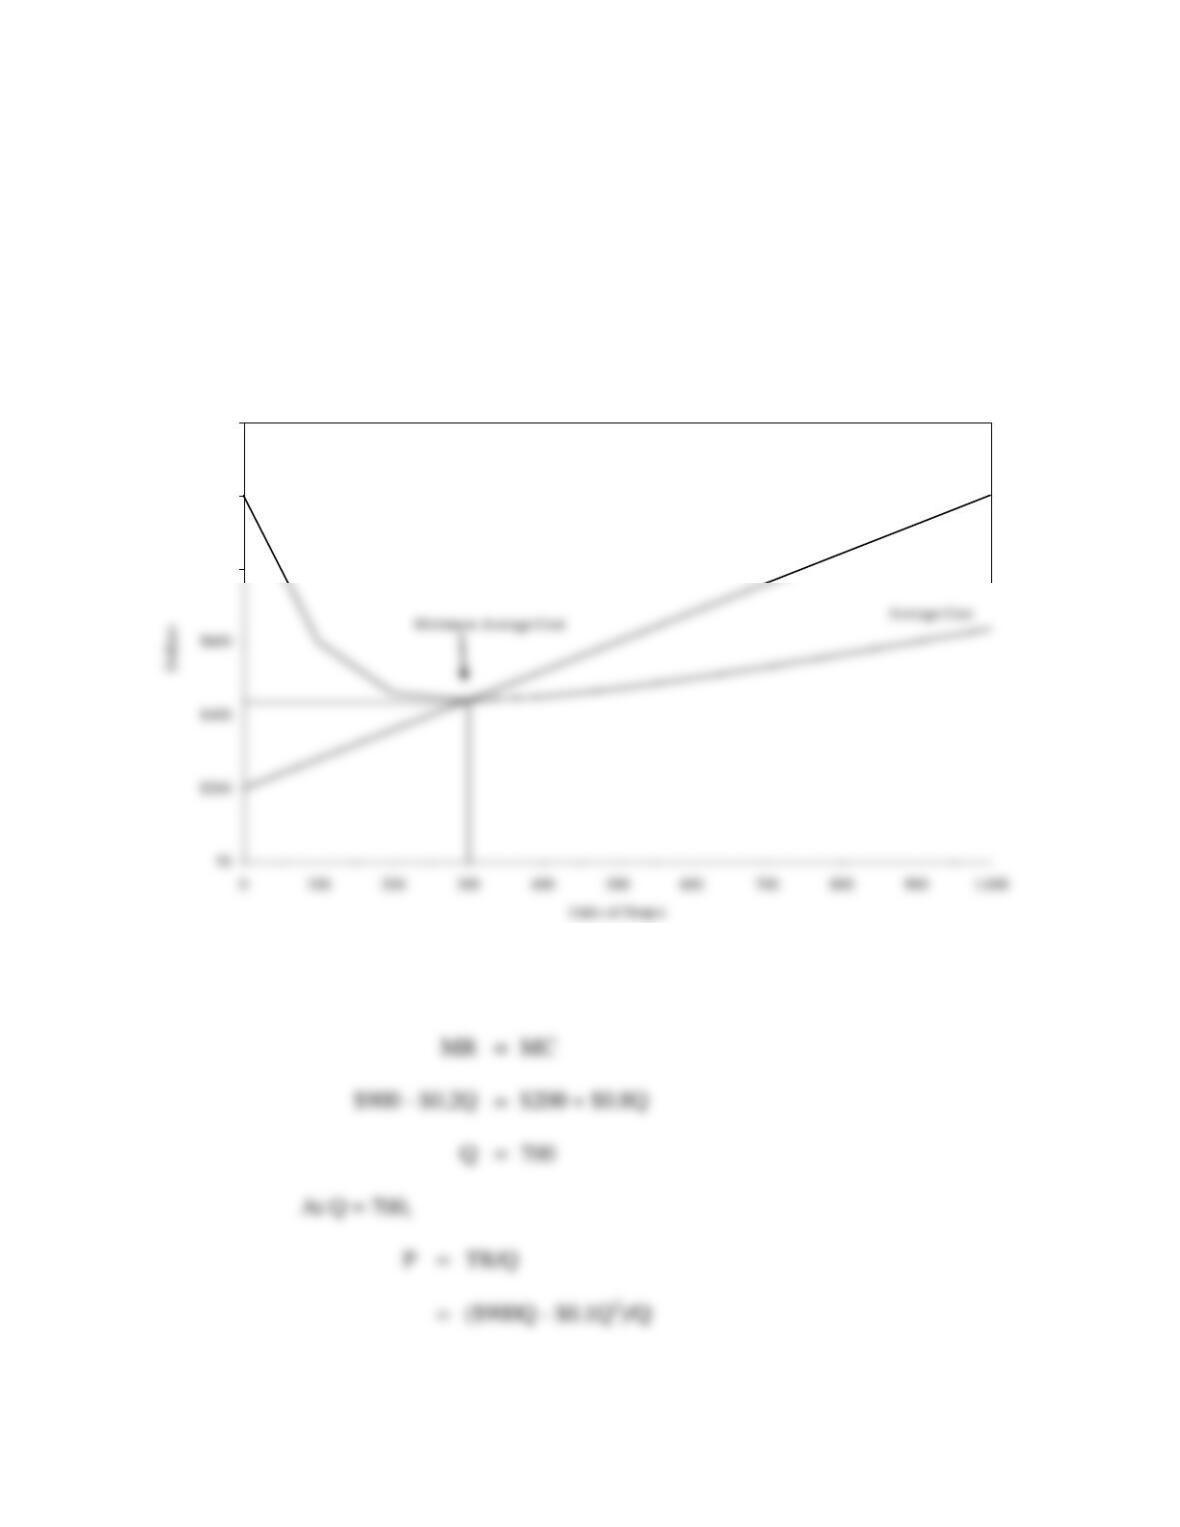
Using the spreadsheet, a graph with AC, and MC as dependent variables and
units of output (Q) as the independent variable appears as follows:
C. To find the profit-maximizing output level analytically, set Mπ = MR – MC = 0 or
MR = MC, and solve for Q:
Pharmed Caplets
Average Cost Minimization
Average Cost
$800
$1,000
$1,200
Marginal Cost
Economic Optimization 23
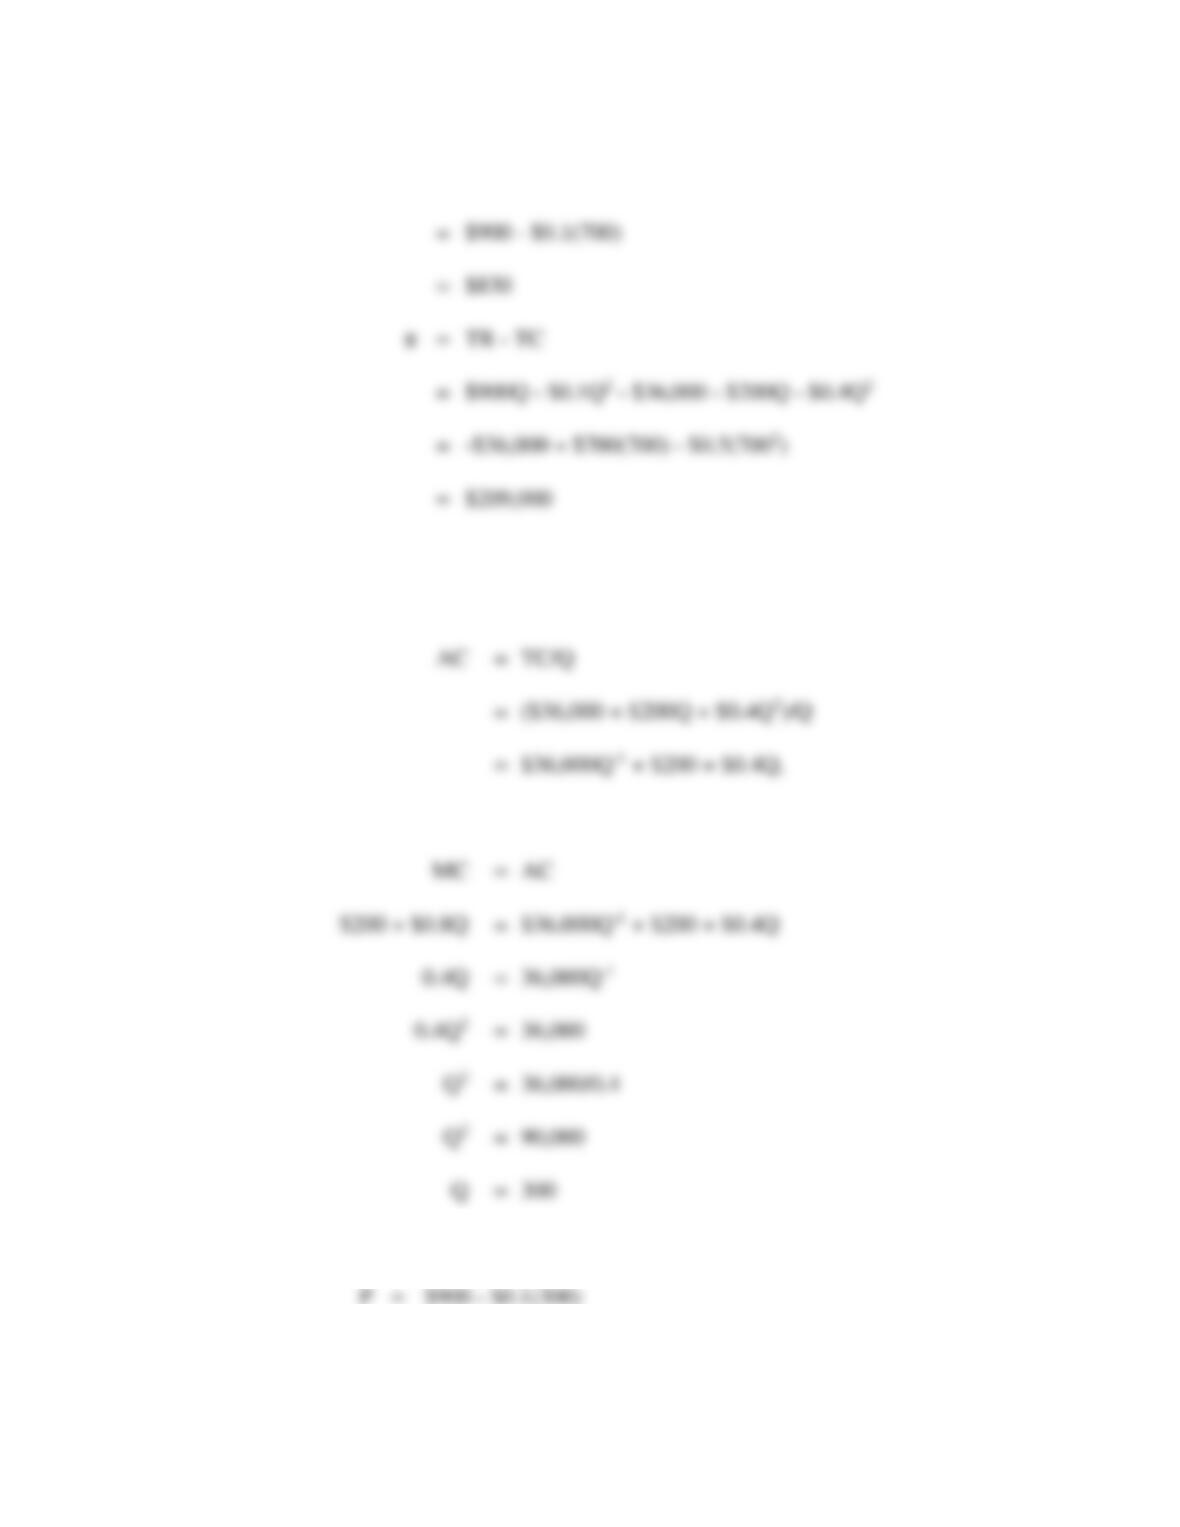
This is a profit maximum because profits are falling for Q > 700.
To find the average-cost minimizing output level, set MC = AC, and solve for
Q:
It follows that:
At Q = 300,
24 Chapter 2
2
8
3
7
4
6
5
5
6
4
D. Given downward sloping demand and marginal revenue curves and a U-shaped (or
quadratic) AC function, the profit-maximizing price/output combination will often be
at a different price and production level than the average-cost minimizing price-
output combination. This stems from the fact that profit is maximized when MR =
PROBLEMS & SOLUTIONS
P2.1 Graphic Analysis
A. Given the output (Q) and price (P) data in the following table, calculate total
revenue (TR) and marginal revenue (MR):
Total
Revenue
Marginal
Revenue
Quantity
Price
TR=P×Q
MR=∂TR/∂Q
0
$10
1
9
Economic Optimization 25
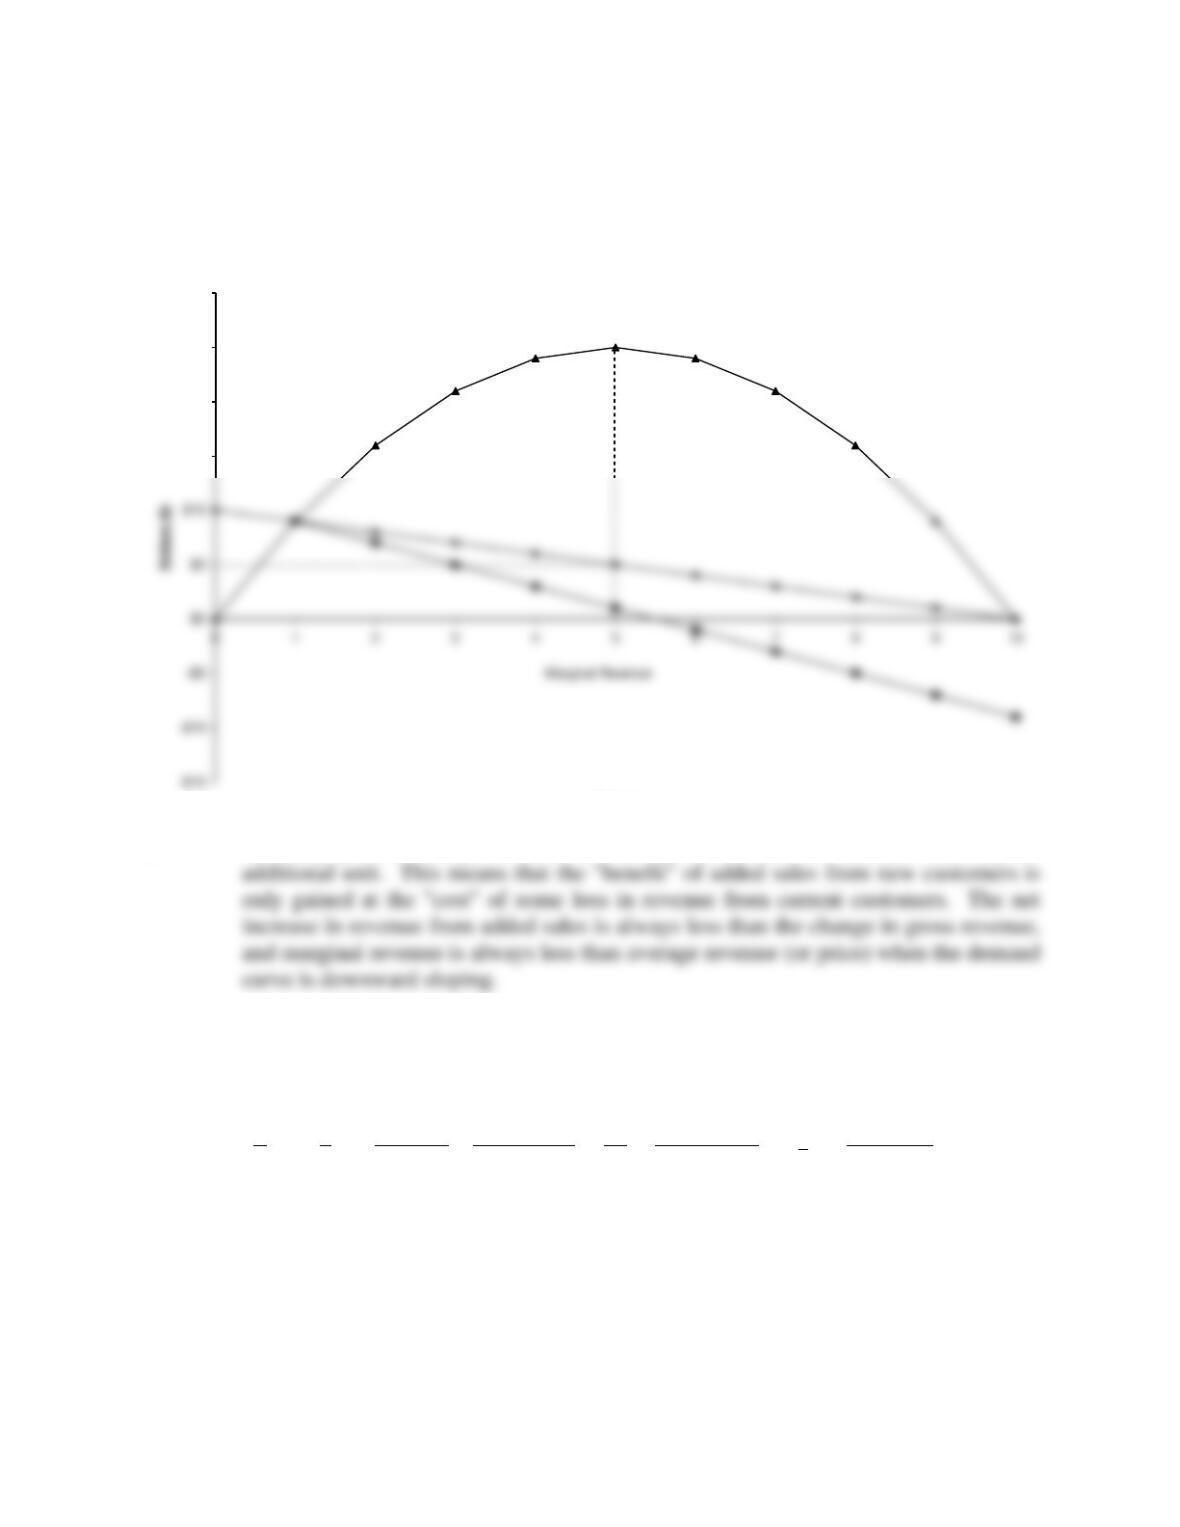
B. Graph these data using “dollars” on the vertical axis and “quantity” on the
horizontal axis. At what output level is revenue maximized?
C. Why is marginal revenue less than average revenue at each price level?
P2.1 SOLUTION
A.
Total
Revenue
Marginal
Revenue
Quantity
Price
TR=P×Q
MR=∂TR/∂Q
0
$10
0
—
1
2
3
4
5
6
7
8
9
9
0
26 Chapter 2
Price, Total Revenue and Marginal Revenue
$15
$20
$25
$30
Output
Total Revenue
Maximum Revenue
C. At every price level, price must be cut by $1 in order to increase sales by an
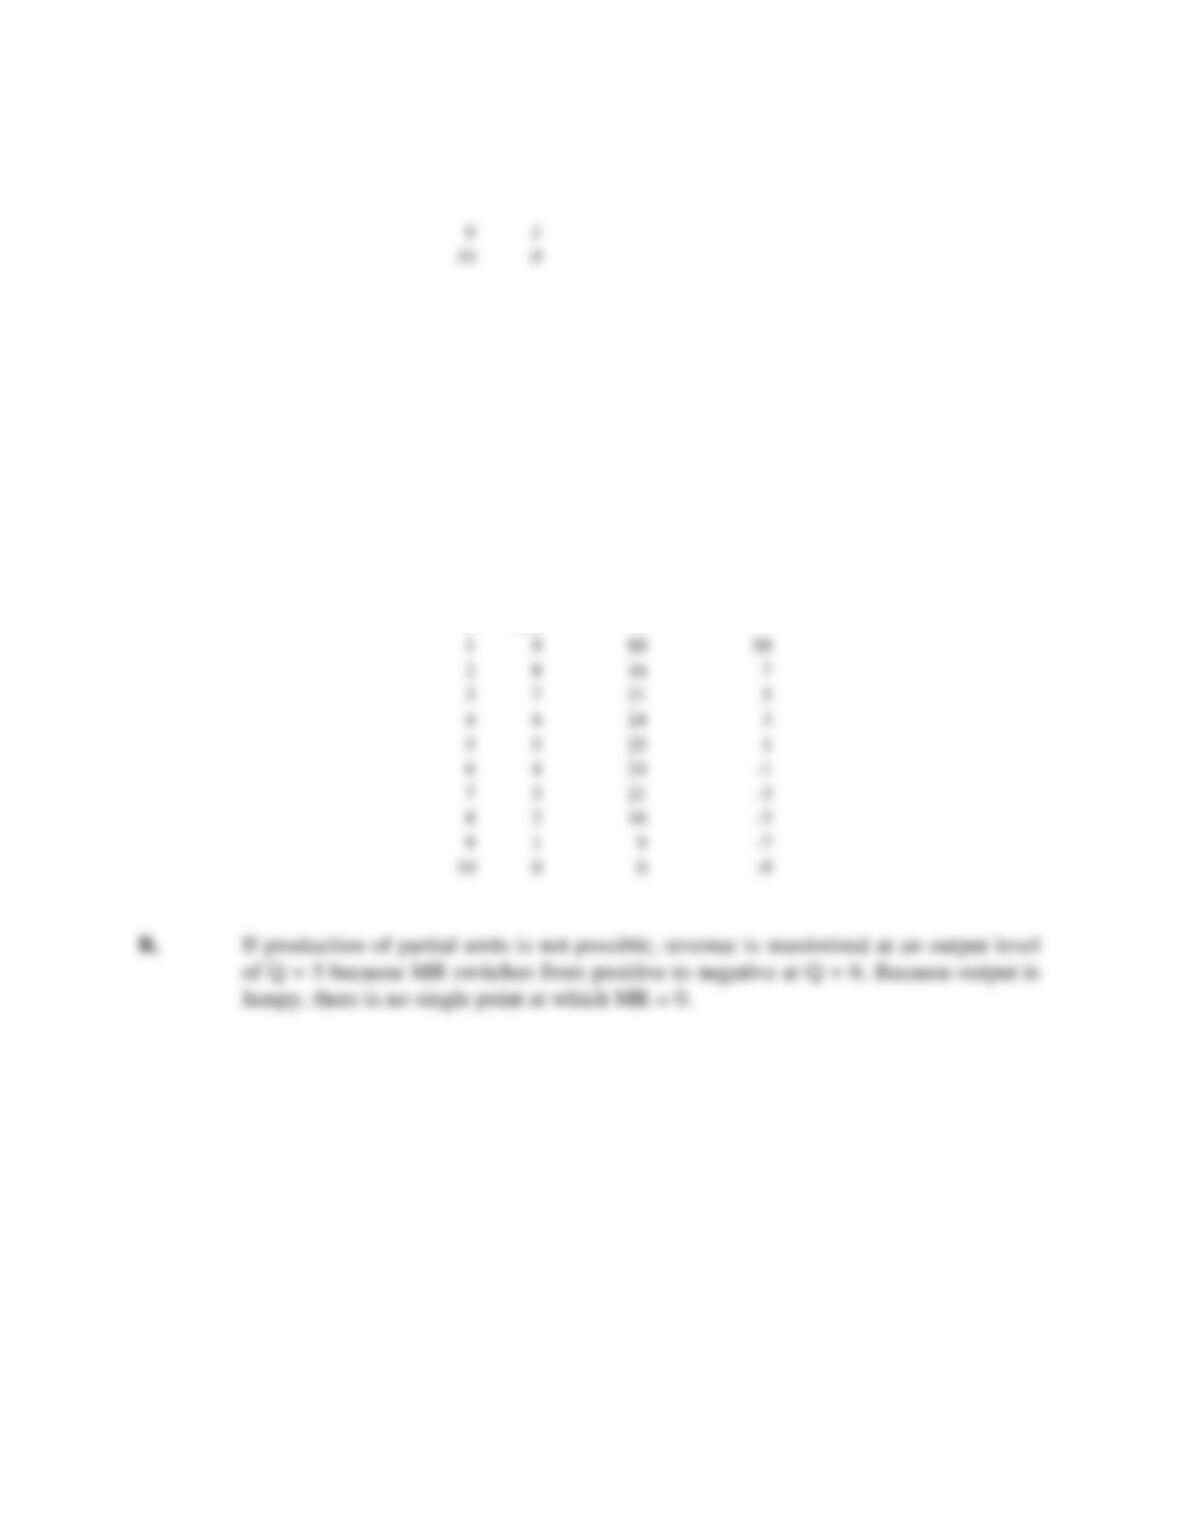
P2.2 A. Fill in the missing data for price (P), total revenue (TR), marginal revenue
(MR), total cost (TC), marginal cost (MC), profit (π), and marginal profit (Mπ)
in the following table:
Q
P
TR=P×Q
MR=∂TR/∂Q
TC
MC=∂TC/∂Q
π
Mπ=∂π/∂Q
0
$160
$0
—
$0
0
$0
—
1
150
150
150
25
25
125
125
2
140
55
30
100
3
390
35
300
75
4
90
130
350
5
110
550
175
6
600
50
55
370
7
630
290
60
–30
Economic Optimization 27
8
80
640
355
285
9
75
–85
10
600
525
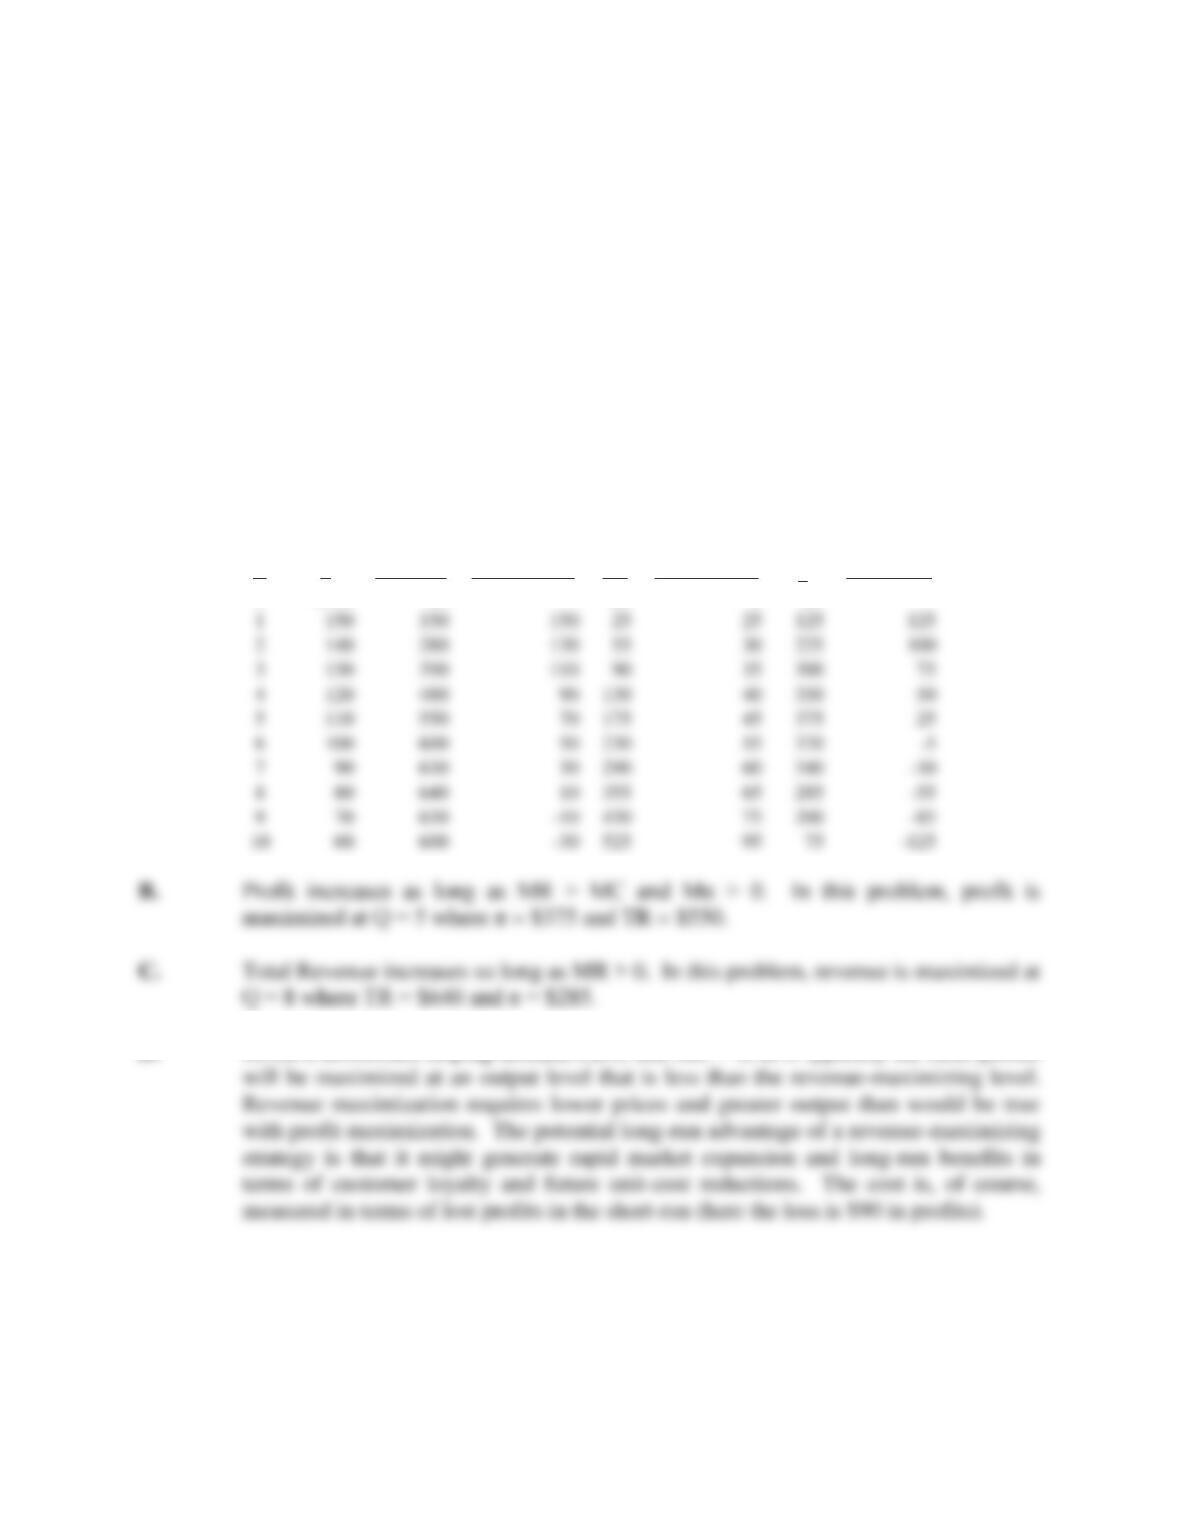
B. At what output level is profit maximized?
C. At what output level is revenue maximized?
D. Discuss any differences in your answers to parts B and C.
P2.2 SOLUTION
A.
Q
P
TR=P×Q
MR=∂TR/∂Q
TC
MC=∂TC/∂Q
π
Mπ=∂π/∂Q
0
$160
$0
—
$0
0
$0
—
D. Given a downward sloping demand curve and MC > 0, as is typically the case, profits
P2.3 Marginal Analysis. Characterize each of the following statements as true or false,
and explain your answer.
3
4
7
8
28 Chapter 2
A. If marginal revenue is less than average revenue, the demand curve will be
downward sloping.
B. Profits will be maximized when total revenue equals total cost.
C. Given a downward-sloping demand curve and positive marginal costs, profit-
maximizing firms will always sell less output at higher prices than will
revenue-maximizing firms.
D. Marginal cost must be falling for average cost to decline as output expands.
E. Marginal profit is the difference between marginal revenue and marginal cost
and will always equal zero at the profit-maximizing activity level.
P2.3 SOLUTION

Economic Optimization 29
P2.4 Marginal Analysis: Tables. Meredith Grey is a regional sales representative for
Dental Laboratories, Inc., a company that sells alloys created from gold, silver,
platinum, and other precious metals to several dental laboratories in Washington,
Oregon, and Idaho. Grey’s goal is to maximize total monthly commission income,
which is figured at 8 percent of gross sales. In reviewing monthly experience over the
past year, Grey found the following relations between days spent in each state and
monthly sales generated:
Washington
Oregon
Idaho
Days
Gross
Sales
Days
Gross
Sales
Days
Gross
Sales
0
$10,000
0
$0
0
$6,250
1
25,000
1
8,750
1
12,500
2
37,500
2
16,250
2
17,500
3
47,500
3
22,500
3
21,250
4
55,000
4
26,250
4
23,750
5
60,000
5
28,750
5
25,000
6
62,500
6
30,000
6
25,000
7
62,500
7
31,250
7
25,000
A. Construct a table showing Grey’s marginal sales per day in each state.
B. If administrative duties limit Grey to only ten selling days per month, how
should they be spent to maximize commission income?
C. Calculate Grey’s maximum monthly commission income.
P2.4 SOLUTION
A.
Washington
Oregon
Idaho
Days
Marginal
Sales
Days
Marginal
Sales
Days
Marginal
Sales