
interactive activity
Appendix
19
Indifference Curve
Analysis of Labor Supply
1. Leandro has 16 hours per day that he can allocate to work or leisure. His job
pays a wage rate of $20. Leandro decides to consume 8 hours of leisure. His
indifference curves have the usual shape: they slope downward, they do not
cross, and they have the characteristic convex shape.
a. Draw Leandro’s time allocation budget line for a typical day. Then illustrate
the indifference curve at his optimal choice.
Now Leandro’s wage rate falls to $10.
b. Draw Leandro’s new budget line.
1. a. If Leandro spends all his time—all 16 hours—in leisure activities, he has no
$320. This gives him the time allocation budget line labeled BL1 in the accom–
panying diagram. The opportunity cost of leisure—minus the slope of his
budget line—is 20: for each additional hour of leisure, Leandro gives up $20
of income. Since he consumes 8 hours of leisure (and works the remaining
8 hours), his indifference curve, I2, has to be tangent to his time allocation
$160. This gives him the time allocation budget line labeled BL2 in the
diagram. The opportunity cost of leisure—minus the slope of his budget line—
Solution
S-280 19 APPENDIX INDIFFERENCE CURVE ANALYSIS OF LABOR SUPPLY
d. The substitution effect is Leandro’s change in leisure consumption from
point A to point S in the diagram: we constructed it by holding Leandro’s
2. Florence is a highly paid fashion consultant who earns $100 per hour. She has
16 hours per day that she can allocate to work or leisure, and she decides to
work for 12 hours.
a. Draw Florence’s time allocation budget line for a typical day, and illustrate the
indifference curve at her optimal choice.
One of Florence’s clients is featured on the front page of Vague, an influential
fashion magazine. As a result, Florence’s consulting fee now rises to $500 per
hour. Florence decides to work only 10 hours per day.
b. Draw Florence’s new time allocation budget line, and illustrate the indifference
curve at her optimal choice.
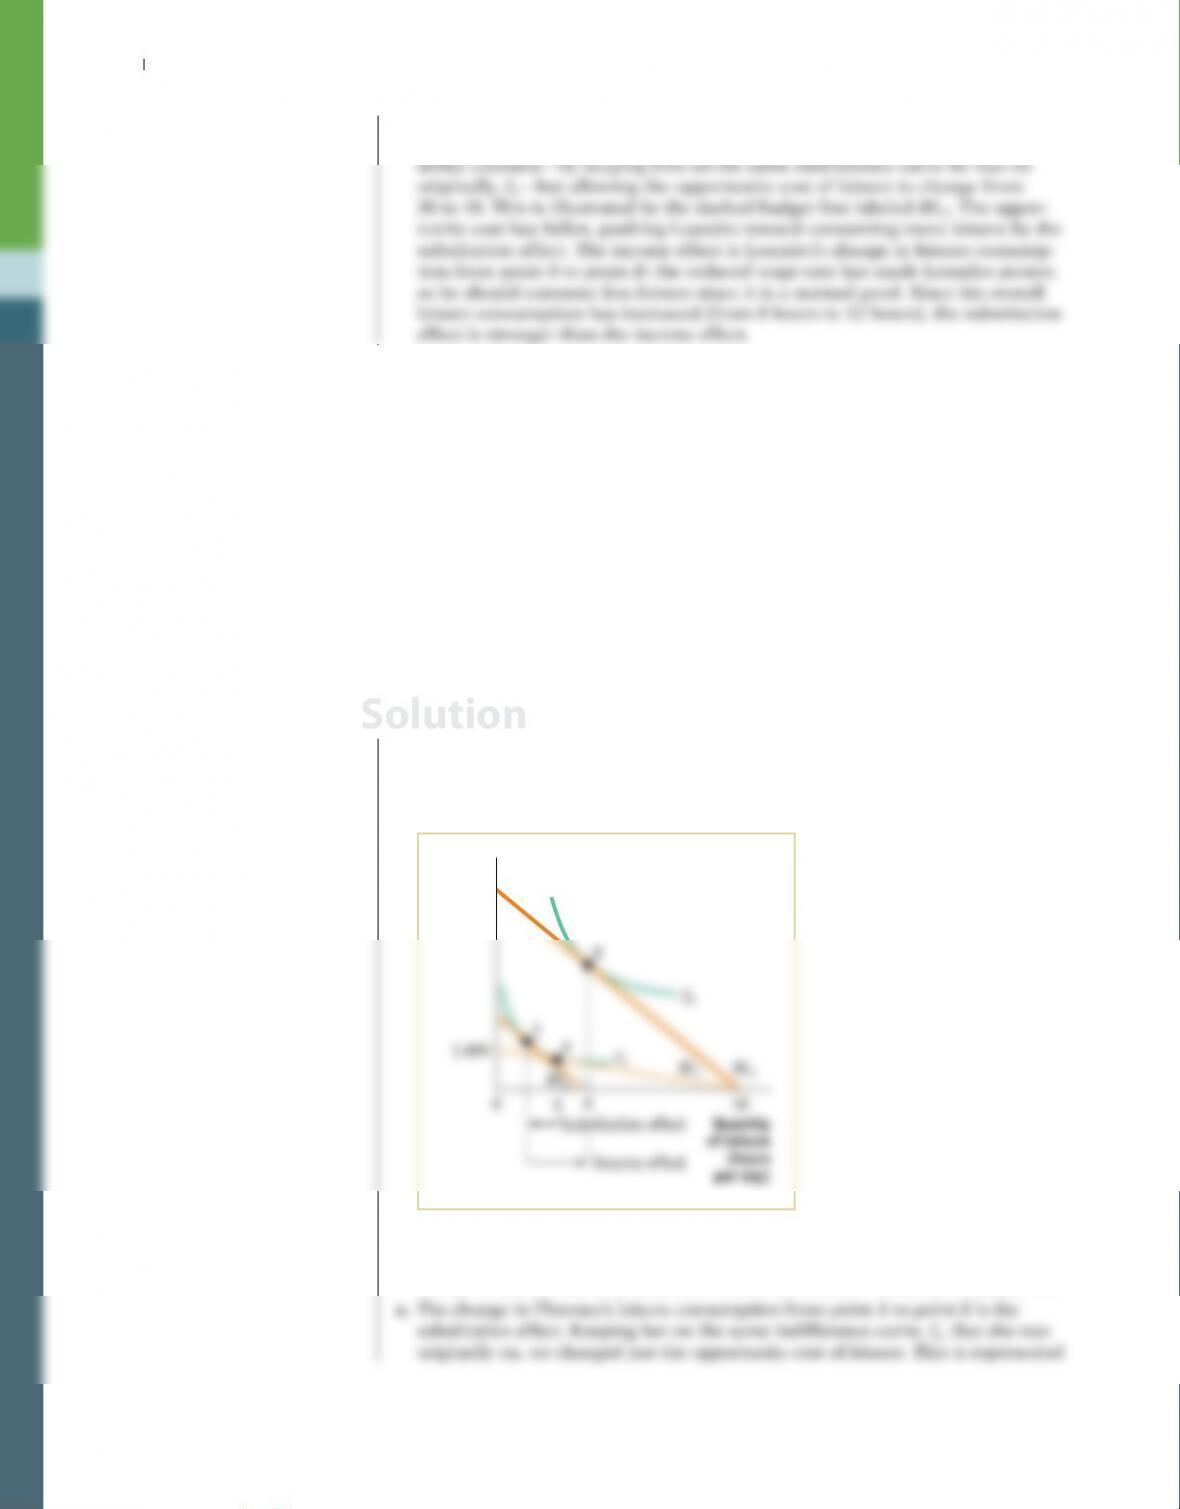
c. In your diagram, show the income effect and the substitution effect from this
increase in the wage rate. Which effect is stronger?
2. a. If Florence spends all 16 hours in leisure activities, she earns no income. If she
spends all 16 hours working, her income is $1,600. This gives her the time allo–
cation budget line labeled BL1 in the accompanying diagram. Since she works
for 12 hours, she consumes 4 hours of leisure. That is, her indifference curve,
I1, is tangent to her budget line at point A.
$8,000
Income
Quantity
of leisur
e
(hour
s
per day)
1,600
A
B
S
Substitution effect
Income effect
I1
I2
BL1BL2
BLS
b. If Florence were to work all 16 hours now, her income would be $8,000. This
gives her the time allocation budget line labeled BL2 in the diagram. Since she
works 10 hours now, she consumes 6 hours of leisure. That is, she is at point B.
Solution
3. Wendy works at a fast-food restaurant. When her wage rate was $5 per hour, she
worked 30 hours per week. When her wage rate rose to $6 per hour, she decided
to work 40 hours. But when her wage rate rose further to $7, she decided to work
only 35 hours.
a. Draw Wendy’s individual labor supply curve.
b. Is Wendy’s behavior irrational, or can you find a rational explanation? Explain
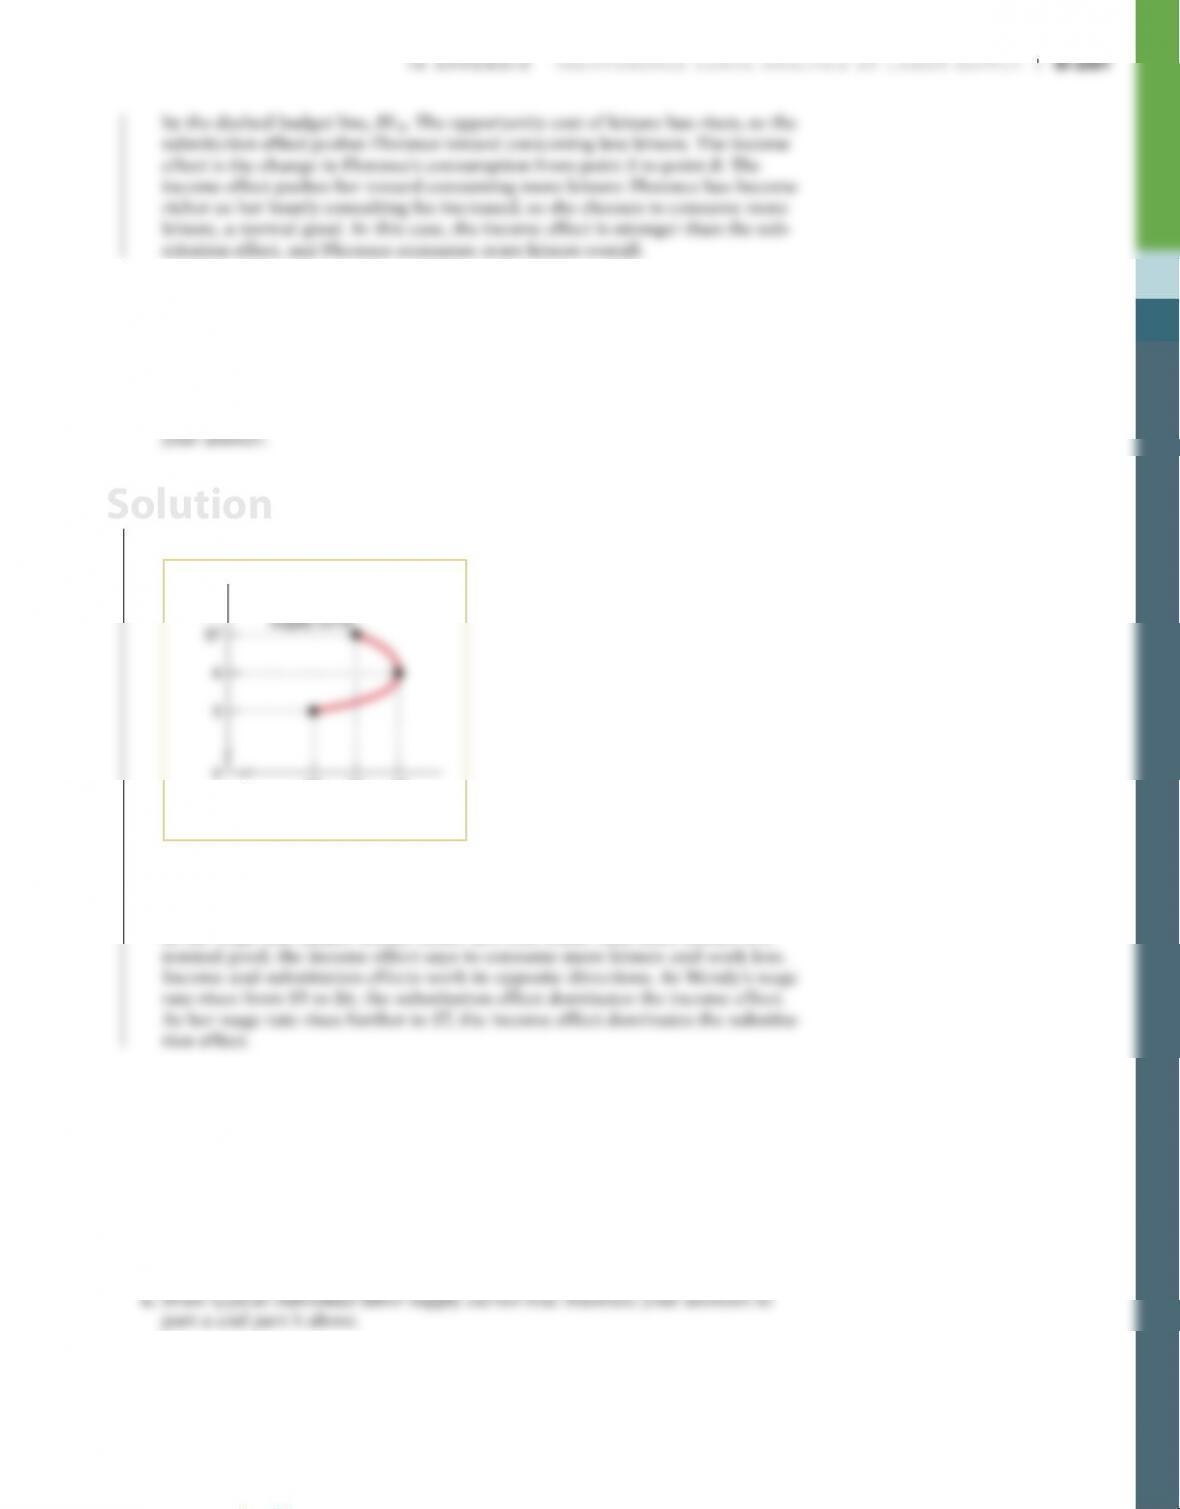
3. a. Wendy’s individual labor supply curve has the backward-bending shape shown
in the accompanying diagram.
Individual labor
403530
0
$7
6
5
Wage
rate
Quantity of labor (hours)
b. Wendy’s behavior has a perfectly rational explanation. As the wage rate
increases, the opportunity cost of leisure increases. So the substitution effect
says to consume less leisure and work more. At the same time, an increase
in the wage rate makes Wendy richer in a real sense. And since leisure is a
4. Over the past fifty years the average American’s leisure time has increased by
between 4 and 8 hours a week. Some economists think that this increase is
primarily driven by a rise in wage rates.
a. Use the income and substitution effects to describe the labor supply for the
average American. Which effect dominates?
b. In addition to increasing wages, a study by the Bureau of Labor Statistics
finds labor force participation for women is projected to steadily increase
through 2024. For the average woman who has entered the labor force, which
effect dominates?
Solution

4. a. As wage rates rise, the substitution effect says to consume less leisure, because
leisure has just become relatively more expensive. However, the income effect
says to consume more leisure, because a wage rate increase makes consumers
richer and leisure is a normal good. Since the overall effect has been for leisure
time to increase as a result of the wage rate increase, the income effect must
have been stronger than the substitution effect.
b. As wage rates rise, income and substitution effects work in the same ways as in
part a. However, since female labor force participation has increased, the sub–
c. The accompanying diagram shows a typical labor supply curve for all workers
in panel (a) and for new female workers in panel (b).
(a) All Workers (b) New Female Workers
W
age
rate
Wage
rate
Quantity of labor Quantity of labor
WORK IT OUT Interactive step-by-step help with solving this
problem can be found online.
5. Tamara has 80 hours per week that she can allocate to work or leisure.
Her job pays a wage rate of $20 per hour, but Tamara is being taxed on her
income in the following way. On the first $400 that Tamara makes, she pays
a. Draw Tamara’s time allocation budget line for a typical week. Also illus–
trate the indifference curve at her optimal choice.
The government changes the tax scheme. Now only the first $100 of income
is tax–exempt. That is, for the first 5 hours she works, Tamara’s net wage rate
b. Draw Tamara’s new time allocation budget line on the same diagram. Also
illustrate her optimal choice. Bear in mind that she is equally as well off
(on the same indifference curve) as before the tax changes occurred.
c. Will Tamara work more or less than before the changes to the tax scheme?
Why?
Solution
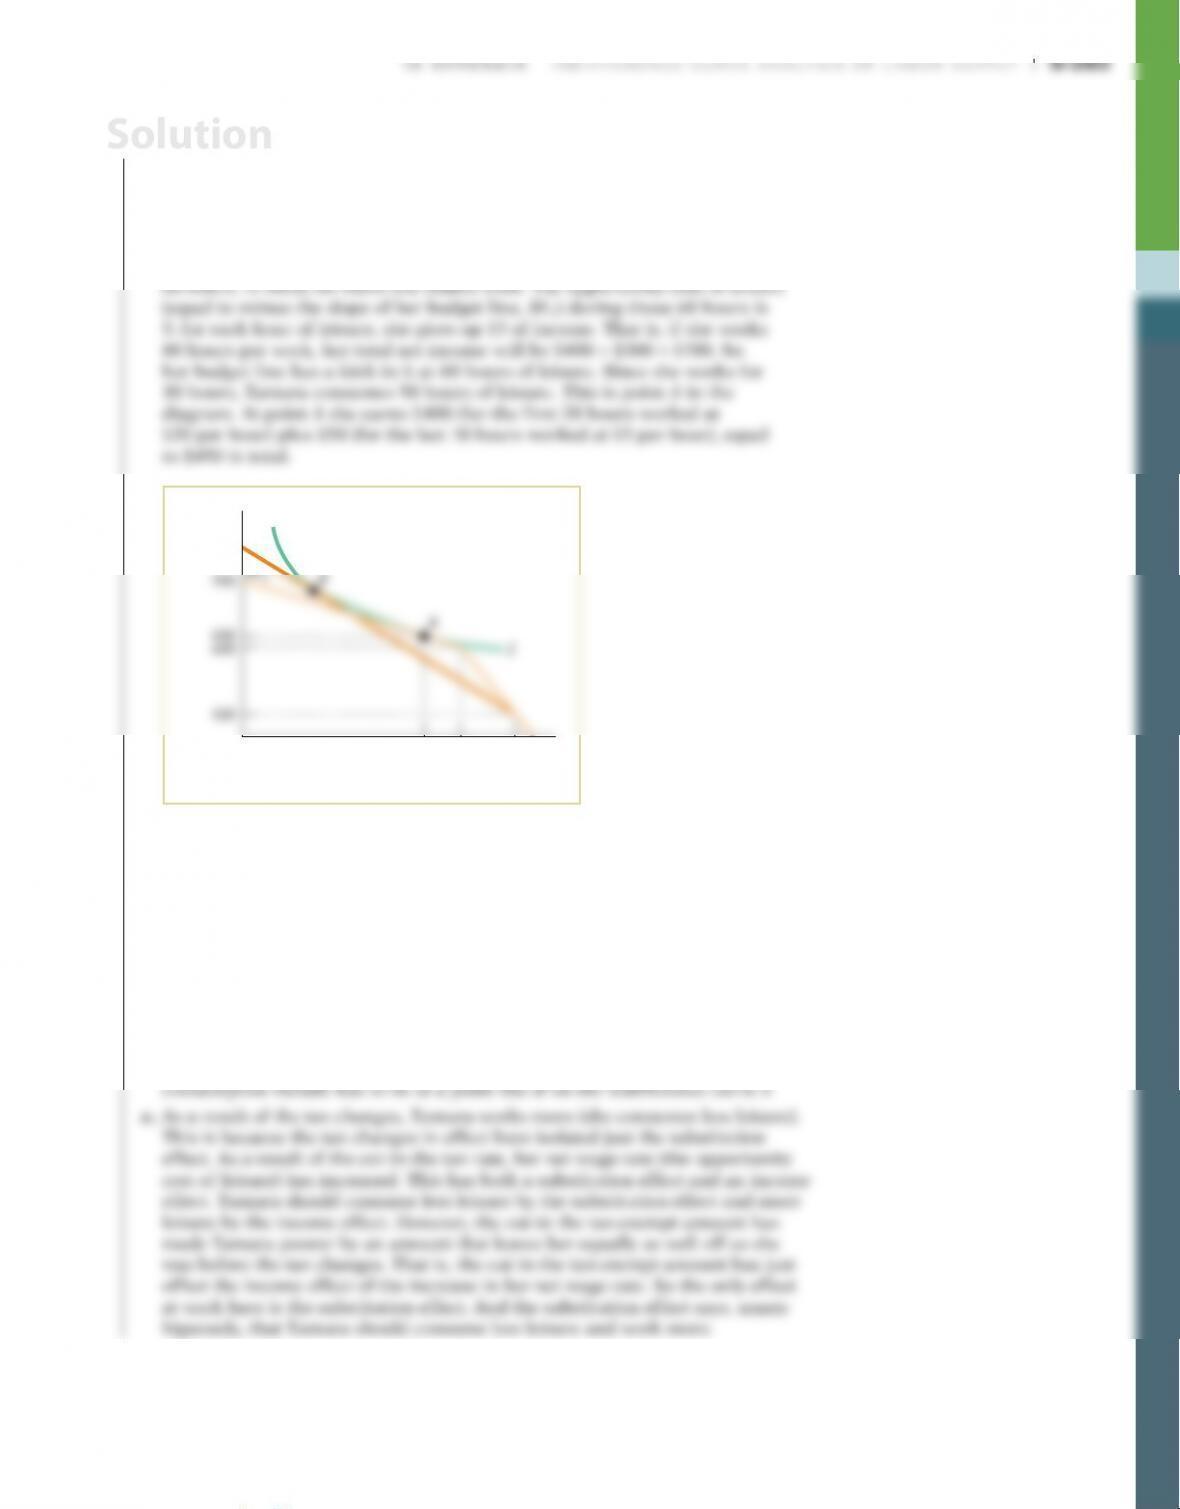
5. a. If Tamara consumes 80 hours of leisure, she has no income. For every hour
she works up to 20 hours, she earns a net $20 per hour. That is, if she works
20 hours—she consumes 60 hours of leisure—her income is $400. In the
accompanying diagram, the opportunity cost of leisure (equal to minus the
slope of her budget line, BL1) during the first 20 hours of work is 20: for each
hour of leisure, she gives up $20 of income. For any hours she works beyond
the first 20 hours, she earns a net $5 per hour. If she works for all remaining
Quantity of leisure (hours per week)
80756050
0
b. If Tamara consumes 80 hours of leisure, she has no income. For every hour
she works up to 5 hours, she earns a net $20 per hour. That is, if she works
5 hours—she consumes 75 hours of leisure—her income is $100. The oppor-
tunity cost of leisure (equal to minus the slope of her budget line, BL2) dur–
ing the first 5 hours of work is 20: for each hour of leisure, she gives up $20
of income. For any hours she works beyond the first 5 hours, she earns a net
$10 per hour. If she works for all the remaining 75 hours, she makes $750.
The opportunity cost of leisure (equal to minus the slope of her budget line,
BL2) during those 75 hours is 10: for each hour of leisure, she gives up $10
of income. That is, if she works 80 hours per week, her total net income will
be $100 + $750 = $850. Since after these changes she is equally as well off as
before (she is on the same indifference curve as at point A), her new optimal
Solution