Unlock document.
This document is partially blurred.
Unlock all pages and 1 million more documents.
Get Access
Questions for Review
1. In a system of fractional-reserve banking, banks create money because they ordinarily
keep only a fraction of their deposits in reserve. They use the rest of their deposits to
make loans. The easiest way to see how this creates money is to consider the bank bal-
ance sheets shown in Figure 19–1.
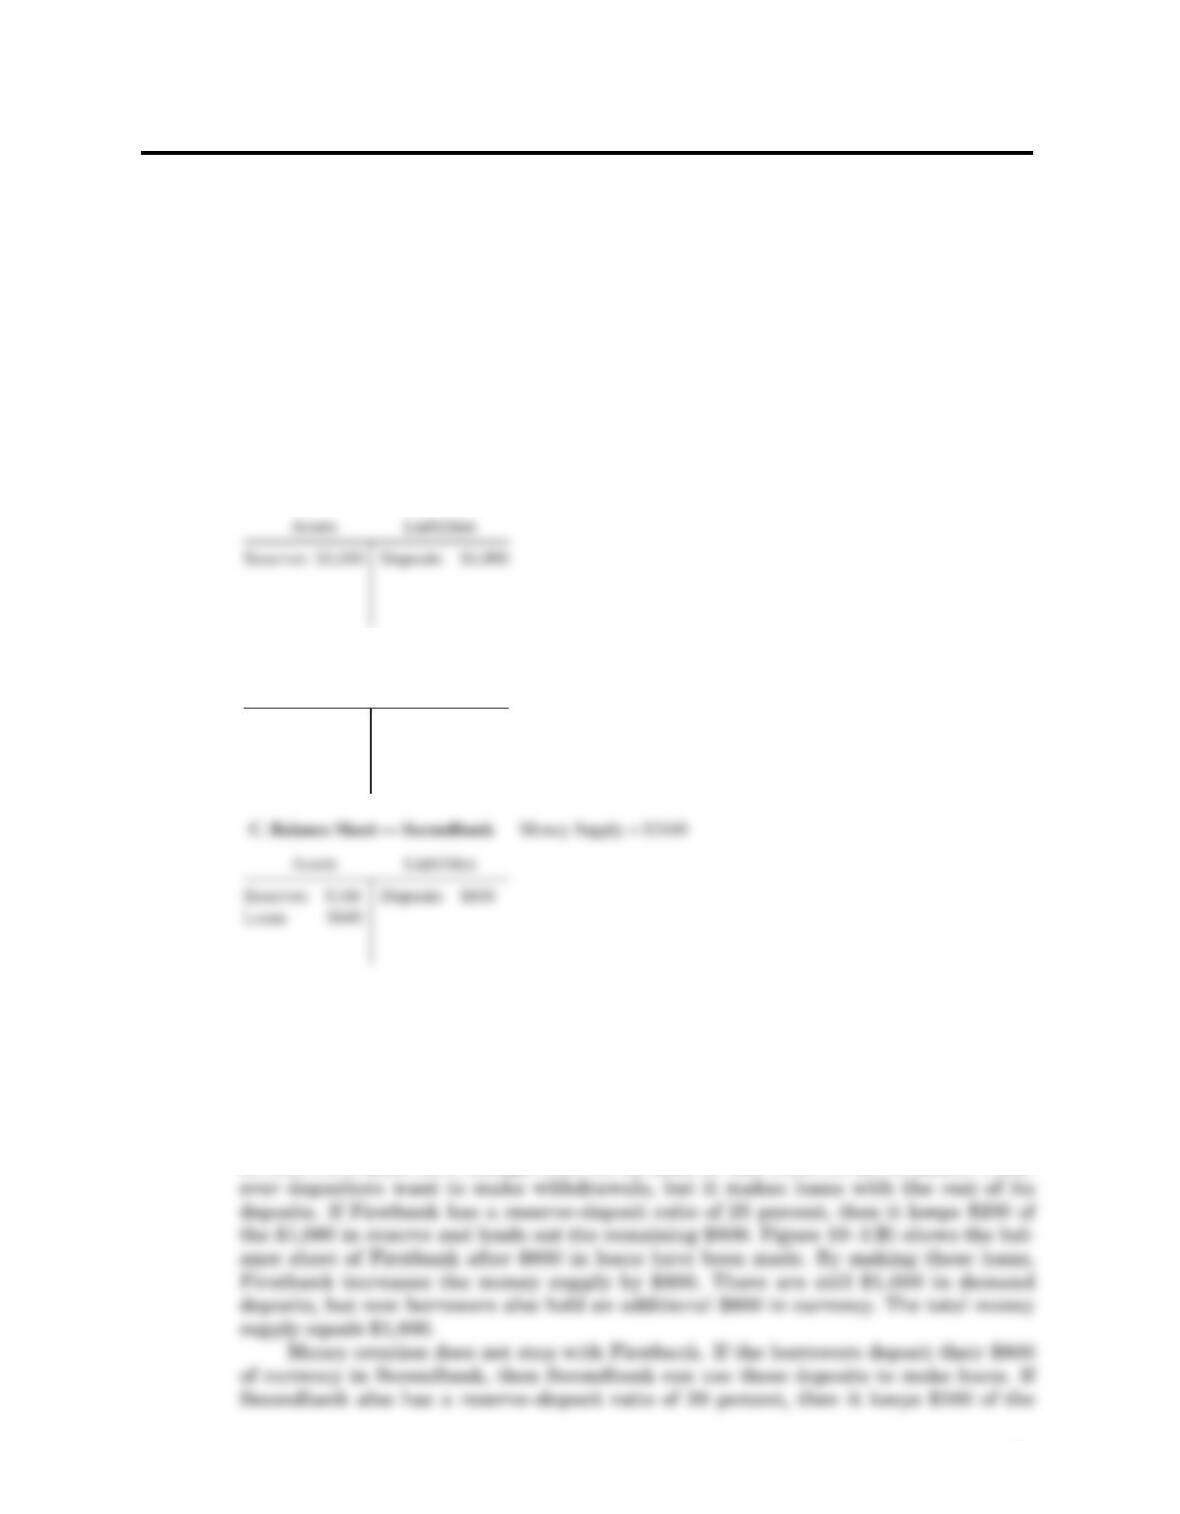
Suppose that people deposit the economy’s supply of currency of $1,000 into
Firstbank, as in Figure 19–1(A). Although the money supply is still $1,000, it is now in
the form of demand deposits rather than currency. If the bank holds 100 percent of
these deposits in reserve, then the bank has no influence on the money supply. Yet
under a system of fractional-reserve banking, the bank need not keep all of its deposits
in reserve; it must have enough reserves on hand so that reserves are available when-
193
A. Balance Sheet — Firstbank
B. Balance Sheet — Firstbank
Assets
Reserves $200
Loans $800
Deposits $1,000
Liabilities
Money Supply = $1,000
Money Supply = $1,800
Figure 19–1
CHAPTER 19 Money Supply, Money Demand,
and the Banking System
$800 in reserves and lends out the remaining $640. By lending out this money, Second-
bank increases the money supply by $640, as in Figure 19–1(C). The total money sup-
2. The Fed influences the money supply through open-market operations, reserve require-
ments, and the discount rate. Open-market operations are the purchases and sales of
government bonds by the Fed. If the Fed buys government bonds, the dollars it pays for
the bonds increase the monetary base and, therefore, the money supply. If the Fed sells
3. To understand why a banking crisis might lead to a decrease in the money supply, first
consider what determines the money supply. The model of the money supply we devel-
oped shows that
M= m×B.
The money supply Mdepends on the money multiplier mand the monetary base B. The
money multiplier can also be expressed in terms of the reserve–deposit ratio rr and the
currency–deposit ratio cr. This expression becomes
M = B.
This equation shows that the money supply depends on the currency–deposit ratio, the
reserve–deposit ratio, and the monetary base.
4. Portfolio theories of money demand emphasize the role of money as a store of value.
These theories stress that people hold money in their portfolio because it offers a safe
nominal return. Therefore, portfolio theories suggest that the demand for money
depends on the risk and return of money as well as all the other assets that people hold
in their portfolios. In addition, the demand for money depends on total wealth because
194 Answers to Textbook Questions and Problems
(cr + 1)
(cr + rr)
rate) and the benefit (the ease of making transactions). Money demand, therefore,
depends negatively on the interest rate and positively on income.
5. The Baumol–Tobin model analyzes how people trade off the costs and benefits of hold-
ing money. The benefit of holding money is convenience: people hold money to avoid
making a trip to the bank every time they wish to purchase something. The cost of this
convenience is the forgone interest they would have received had they left the money
Average Money Holding =
Thus, the Baumol–Tobin model tells us that money demand depends positively on
expenditure and negatively on the interest rate.
6. “Near money” refers to nonmonetary assets that have acquired some of the liquidity of
money. For example, it used to be that assets held primarily as a store of value, such as
mutual funds, were inconvenient to buy and sell. Today, mutual funds allow depositors
Problems and Applications
1. The model of the money supply developed in Chapter 19 shows that
M= mB.
The money supply Mdepends on the money multiplier mand the monetary base B. The
money multiplier can also be expressed in terms of the reserve–deposit ratio rr and the
currency–deposit ratio cr. Rewriting the money supply equation:
Chapter 19 Money Supply , Money Demand, and the Banking System 195
YF
i2
August 1929 March 1933
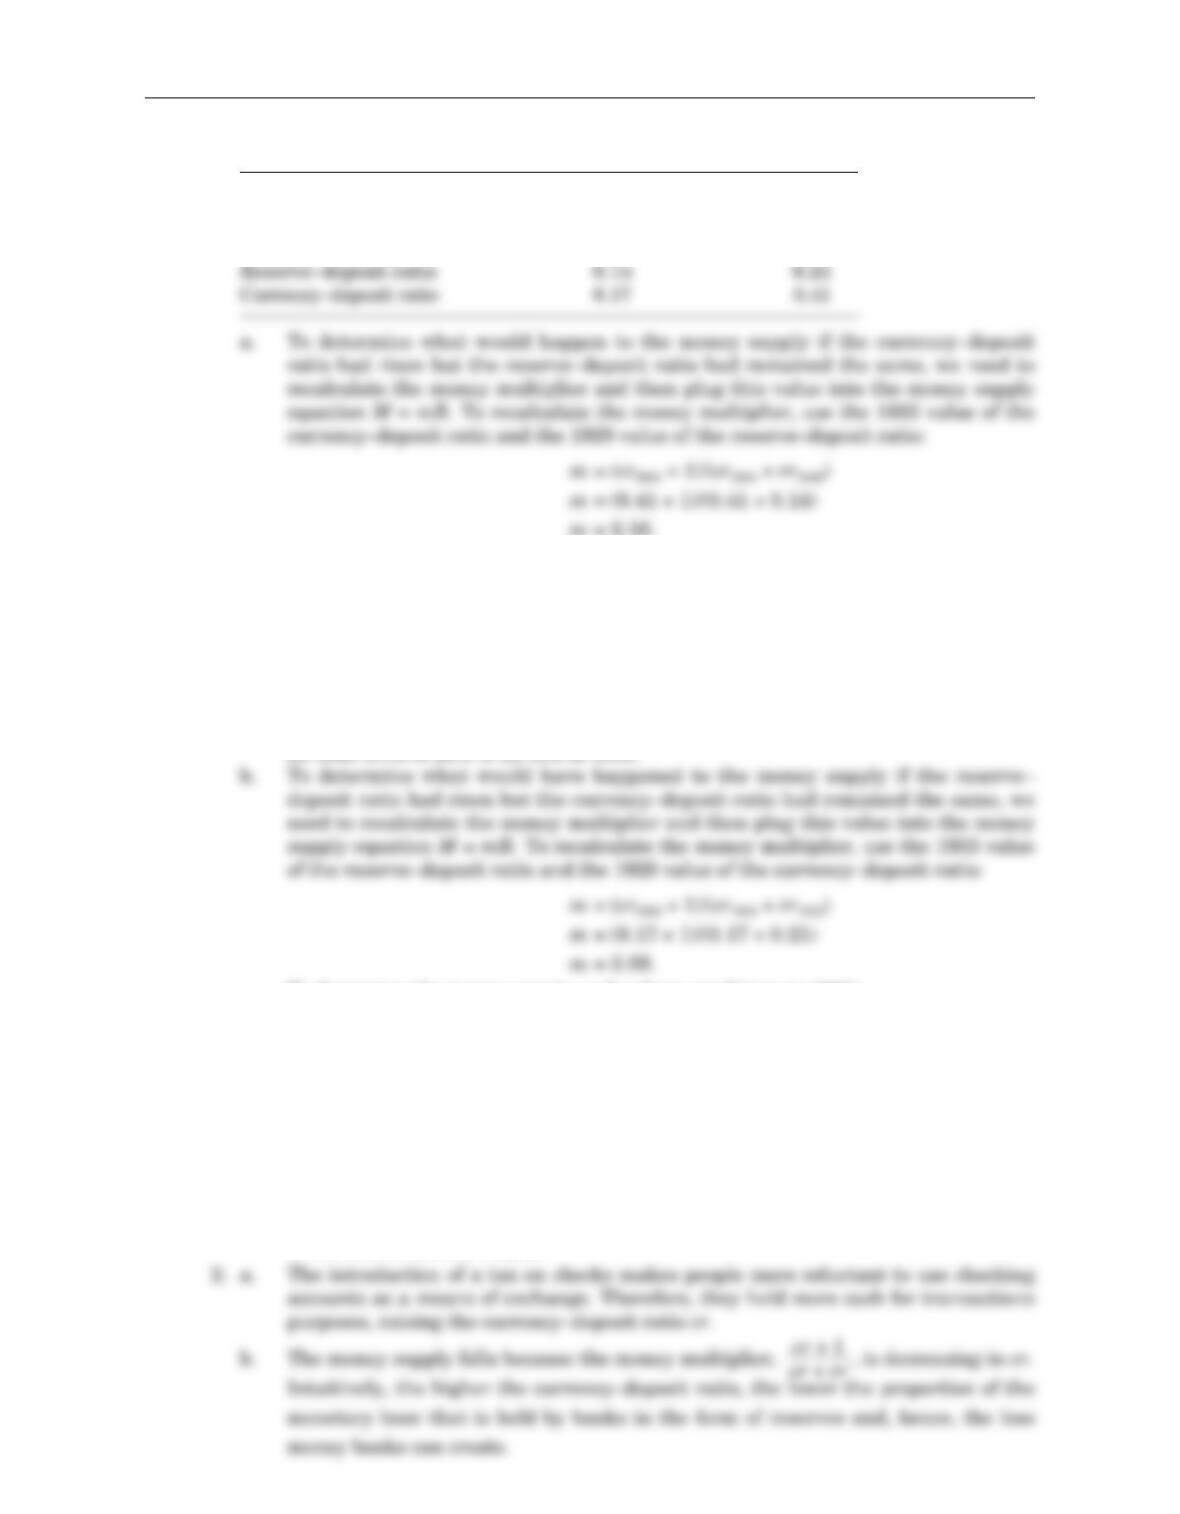
Money supply 26.5 19.0
Monetary base 7.1 8.4
Money multiplier 3.7 2.3
m= 2.56.
To determine the money supply under these conditions in 1933:
M1933 = mB1933.
Plugging in the value for mjust calculated and the 1933 value for B:
M1933 = 2.56 ×8.4
M1933 = 21.504.
Therefore, under these circumstances, the money supply would have fallen from
its 1929 level of 26.5 to 21.504 in 1933.
To determine the money supply under these conditions in 1933:
M1933 = mB1933.
Plugging in the value for mjust calculated and the 1933 value for B:
M1933 = 3.09 ×8.4
M1933 = 25.96.
Therefore, under these circumstances, the money supply would have fallen from
its 1929 level of 26.5 to 25.96 in 1933.
c. From the calculations in parts (a) and (b), it is clear that the decline in the curren-
cy–deposit ratio was most responsible for the drop in the money multiplier and,
therefore, the money supply.
196 Answers to Textbook Questions and Problems
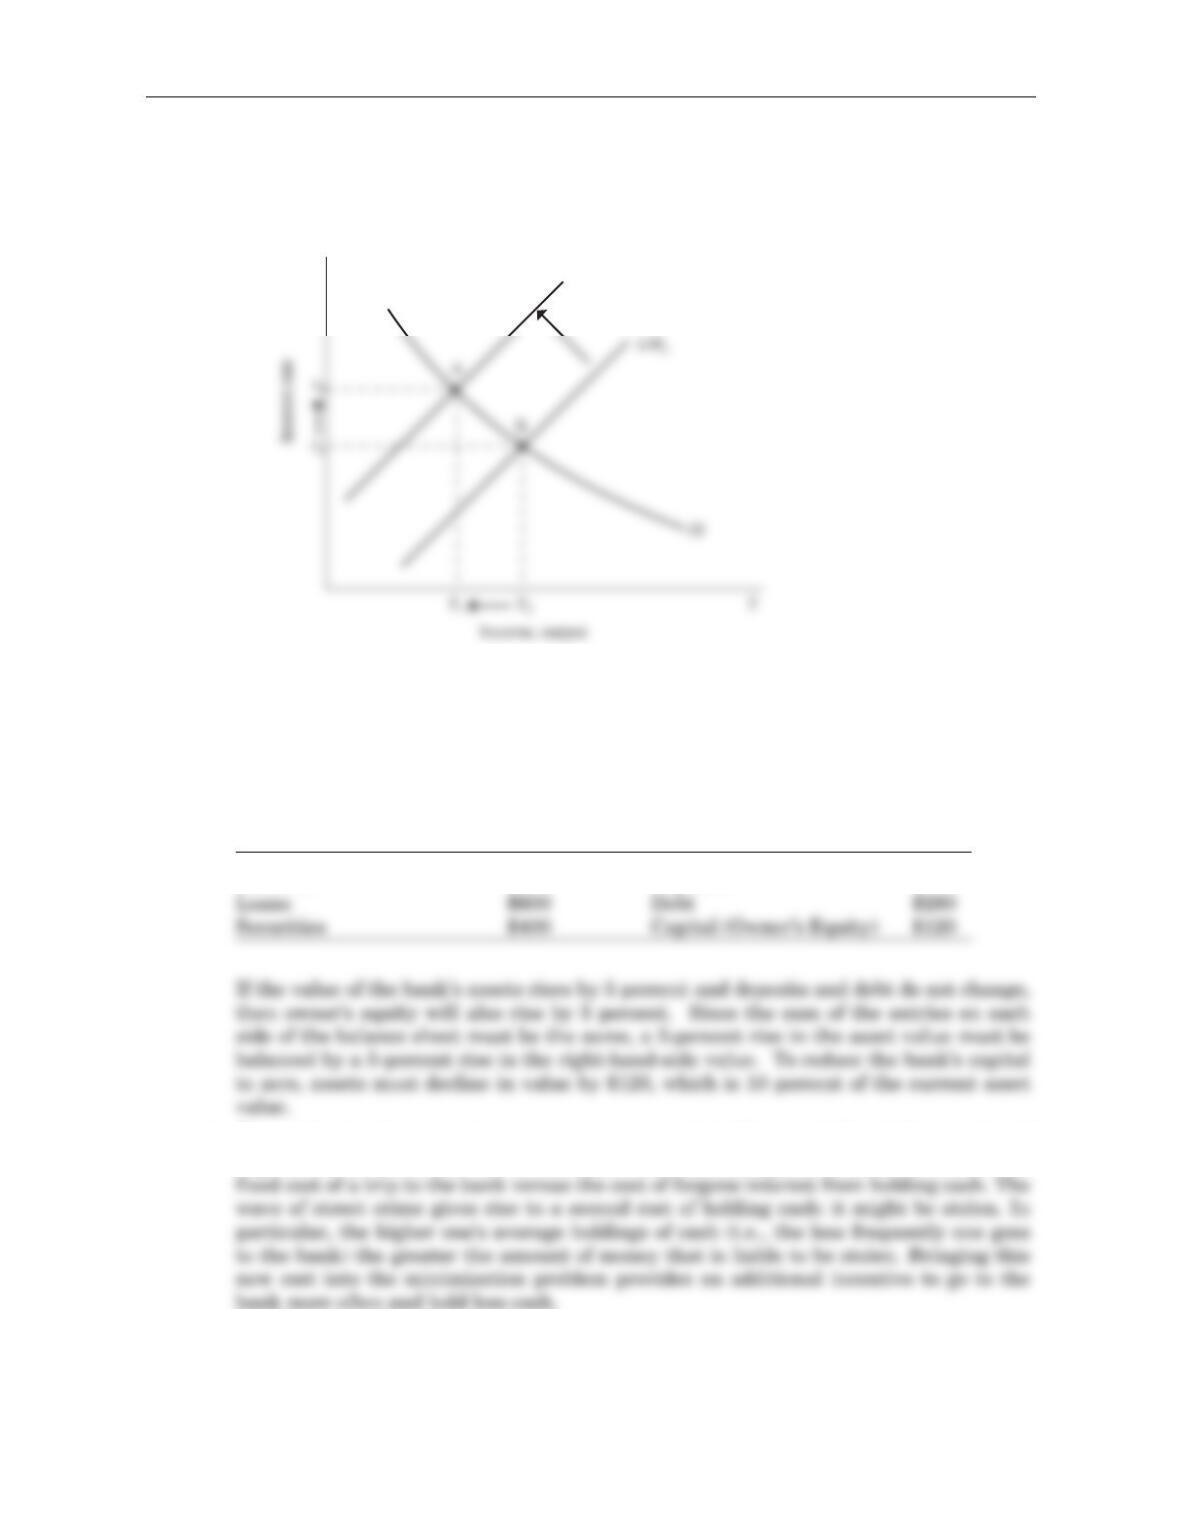
c. The contraction of the money supply shifts the LM curve upward, raising interest
rates and lowering output, as in Figure 19–2. This was not a very sensible action
to take in 1932.
3. The leverage ratio is the ratio of a bank’s total assets to its bank capital. If the lever-
age ratio is 10, this means that for each dollar of capital contributed by the bank own-
ers, the bank has $10 of assets, and therefore $9 of deposits and debts. The balance
sheet below has a leverage ratio of 10: total assets are $1,200 and capital is $120.
Assets Liabilities and Owner’s Equity
Reserves $200 Deposits $800
4. The epidemic of street crimes causes average cash holdings to fall and the number of
trips to the bank to rise. In the Baumol–Tobin model, agents balance two costs: the
5. a. Suppose you spend $1,500 per year in cash. Y= $1,500.
b. Suppose a trip to the bank takes 0.5 hour, and you earn $10 per hour. Then each
trip to the bank costs you (0.5 ×$10) = $5. F= $5.
c. Assume that the interest rate on your checking account is 6 percent. i= 0.06.
r
LM1
Figure 19–2
Chapter 19 Money Supply , Money Demand, and the Banking System 197
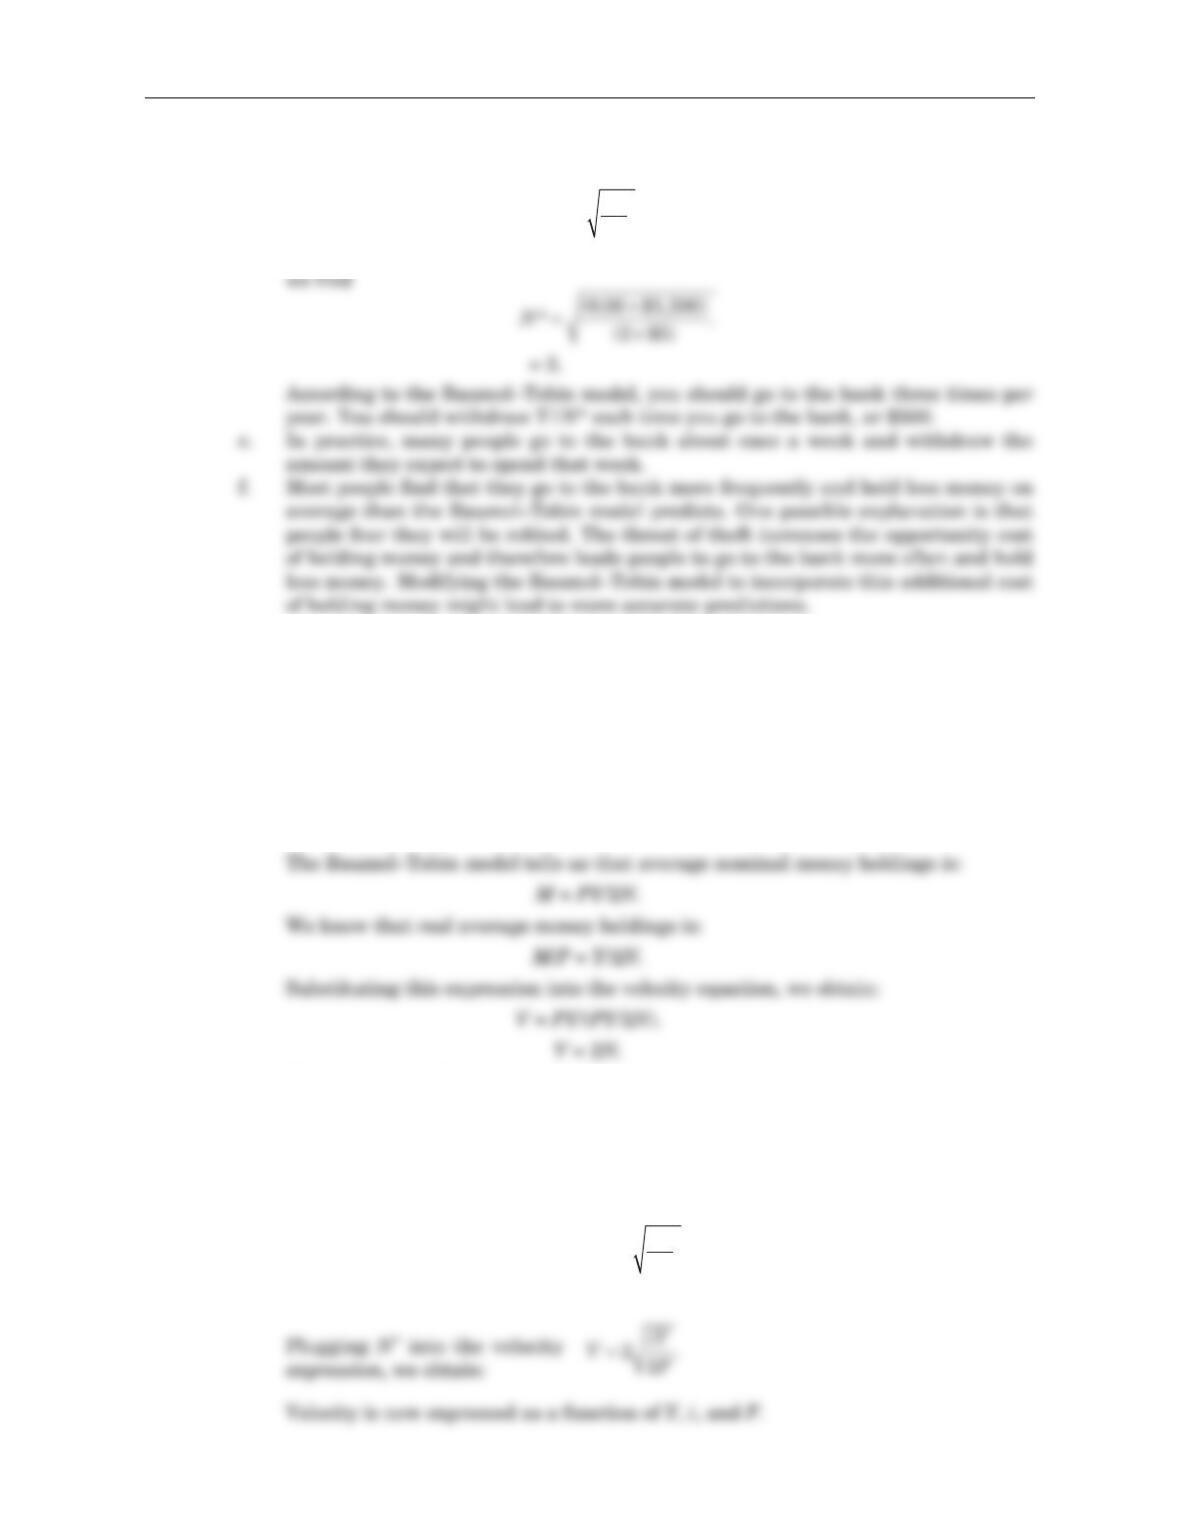
d. According to the Baumol–Tobin model, the optimal number of times to go to the
bank is
Plugging in the values of i, Y, and Fthat we established in parts (a), (b), and (c),
6. a. To write velocity as a function of trips to the bank, note that for simplicity, the
presentation of the Baumol–Tobin model in the text ignored prices (implicitly
holding them fixed). But conceptually, the model relates nominal expenditure PY
to nominal money holdings.
From the quantity equation:
MV = PY.
Rewriting this equation in terms of velocity:
V = (PY)/M.
This equation tells us that velocity increases as the number of trips to the bank
increase. More trips to the bank means that fewer dollars are held on hand to
finance the same amount of expenditure. Therefore, dollars must change hands
more quickly. In other words, velocity increases.
b. To express velocity as a function of Y, i, and F, begin with the velocity expression
from part (a), V= 2N. The for-
mula for the optimal number
of trips to the bank tells us
that
N
iY
F
*.=2
NiY
F
*.=2
198 Answers to Textbook Questions and Problems
Chapter 19 Money Supply , Money Demand, and the Banking System 199
c. As the expression for velocity derived in part (b) indicates, an increase in the
interest rate leads to an increase in velocity. Because the opportunity cost of hold-
ing money increases, people make more trips to the bank, and on average hold less
money. The increase in velocity reflects the fact that fewer dollars are held to
finance the same expenditure. Dollars must therefore change hands more quickly.


