Chapter 19 – Agriculture: Economics and Policy
19-1
Chapter 19 Agriculture: Economics and Policy
QUESTIONS
1. Carefully evaluate: “The supply and demand for agricultural products are such that small
changes in agricultural supply result in drastic changes in prices. However, large changes in
agricultural prices have modest effects on agricultural output.” (Hint: A brief review of the
distinction between supply and quantity supplied may be helpful.) Do exports increase or reduce
the instability of demand for farm products? Explain. LO1
Answer: First sentence: Shifts in the supply curve of agricultural goods (changes in
supply) relative to fixed inelastic demand curves produce large changes in equilibrium
2. What relationship, if any, can you detect between the facts that farmers’ fixed costs of
production are large and the supply of most agricultural products is generally inelastic? Be
specific in your answer. LO1
Answer: Because fixed costs are a significant portion of total costs, average variable
3. Explain how each of the following contributes to the farm problem: LO1, LO2
a. The inelasticity of demand for farm products.
b. The rapid technological progress in farming.
c. The modest long‐run growth in demand for farm commodities.
d. The volatility of export demand.
Answer: (a) Because the demand for most farm products is inelastic, the frequent
fluctuations in supply brought about by weather and other factors have relatively small
effects on quantity demanded, but large effects on equilibrium prices of farm products.
4. The key to efficient resource allocation is shifting resources from low-productivity to
high‐productivity uses. In view of the high and expanding physical productivity of agricultural
resources, explain why many economists want to divert additional resources away from farming
in order to achieve allocative efficiency. LO2
Chapter 19 – Agriculture: Economics and Policy
19-2
Answer: Economic efficiency is only partly a matter of high productivity or low
marginal costs. Allocative efficiency depends on the requirement that the marginal
5. Explain and evaluate: “Industry complains of the higher taxes it must pay to finance subsidies
to agriculture. Yet the trend of agricultural prices has been downward while industrial prices have
been moving upward, suggesting that on balance agriculture is actually subsidizing industry.”
LO3
Answer: According to this statement, one can distinguish transfers of income by using
the concept of price parity. Since the parity ratio for farmers has declined they have
6. “Because consumers as a group must ultimately pay the total income received by farmers, it
makes no real difference whether the income is paid through free farm markets or through price
supports supplemented by subsidies financed out of tax revenue.” Do you agree? LO3
Answer: This argument is fallacious for two reasons. First, not all consumers of a
particular good are taxpayers or vice versa. Taxpayers are forced to fund price-support
7. If in a given year the indexes of prices received and paid by farmers were 120 and 165,
respectively, what would the parity ratio be? Explain the meaning of that ratio. LO3
Answer: Prices received by farmers would have increased by 20 percent since the base
year (1910) whereas price paid by farmers would have increased by 65 percent during the
Chapter 19 – Agriculture: Economics and Policy
19-3
8. Explain the economic effects of price supports. Explicitly include environmental and global
impacts in your answer. On what grounds do economists contend that price supports cause a
misallocation of resources? LO3
Answer: Price supports benefit farmers, harm consumers, impose costs on society, and
contribute to problems in world agriculture. Farmers benefit because the prices they
receive and the output they produce both increase, expanding their gross incomes.
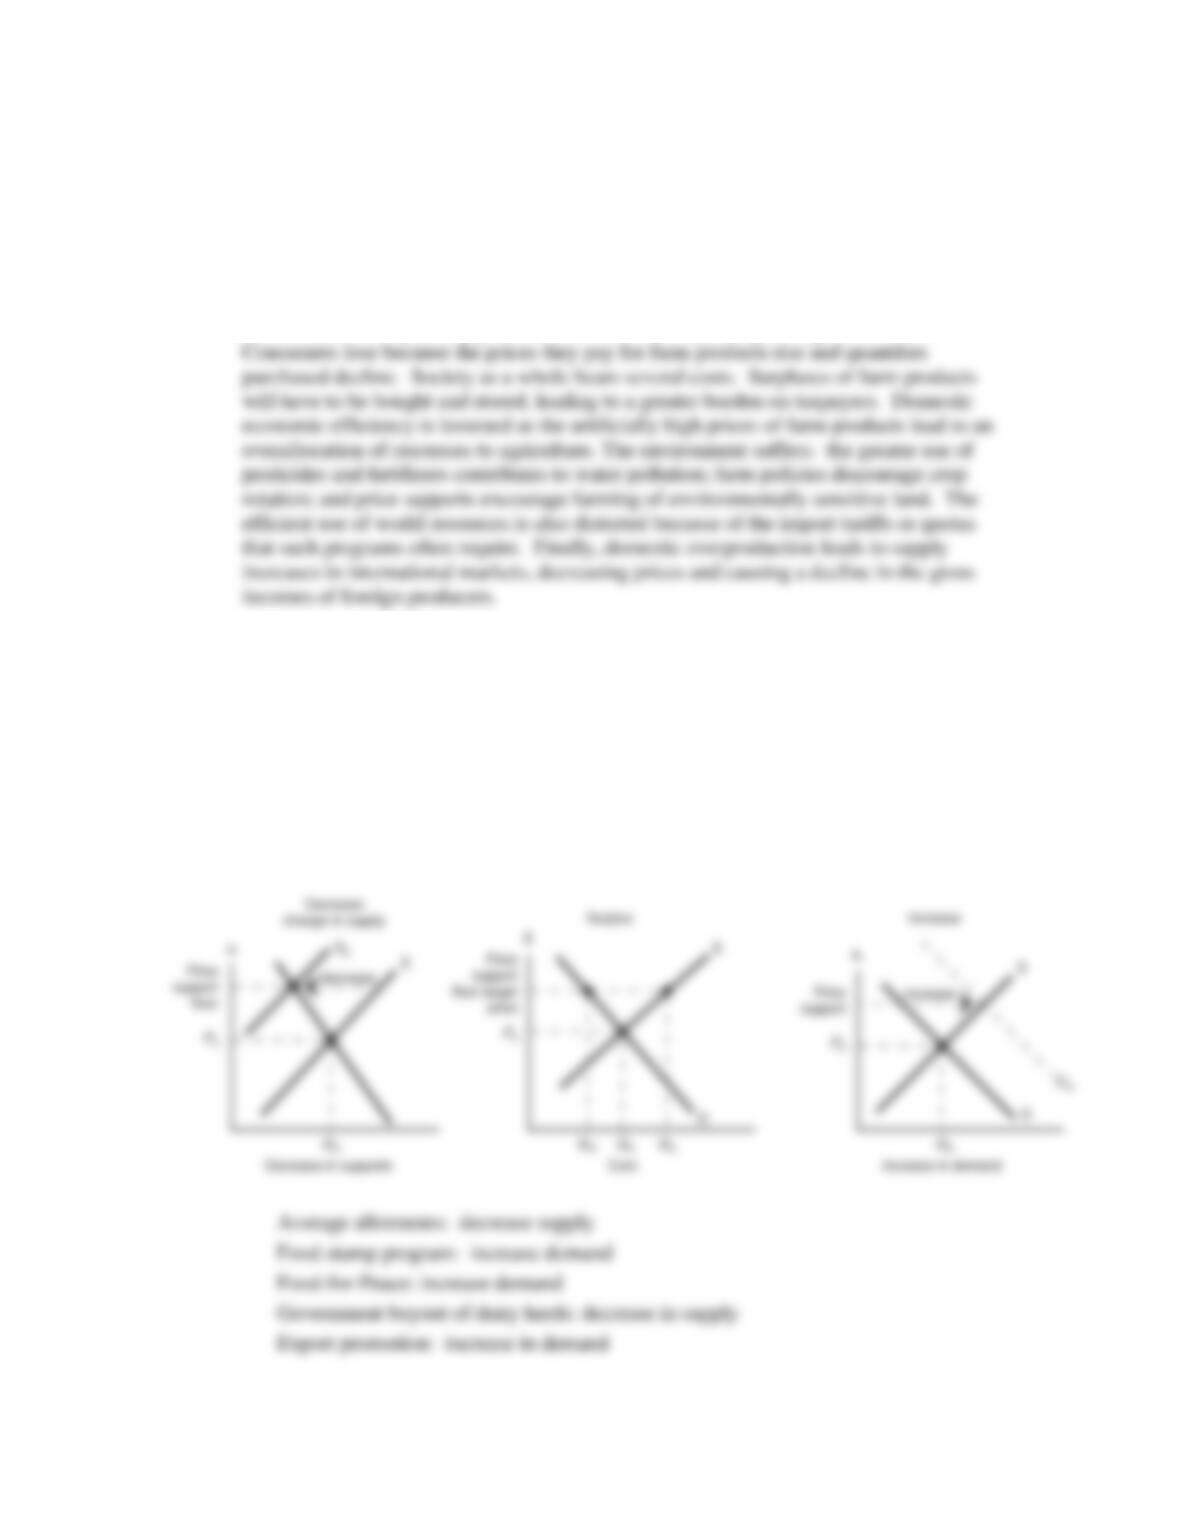
9. Use supply and demand curves to depict equilibrium price and output in a competitive market
for some farm product. Then show how an above‐equilibrium price floor (price support) would
cause a surplus in this market. Demonstrate in your graph how government could reduce the
surplus through a policy that (a) changes supply or (b) changes demand. Identify each of the
following actual government policies as primarily affecting the supply of or the demand for a
particular farm product: acreage allotments; the food‐stamp program; the Food for Peace
program; a government buyout of dairy herds; export promotion. LO3
Answer:
Chapter 19 – Agriculture: Economics and Policy
19-4
10. Do you agree with each of the following statements? Explain why or why not. LO3, LO4
a. The problem with U.S. agriculture is that there are too many farmers. That is not the fault of
farmers but the fault of government programs.
b. The Federal government ought to buy up all U.S. farm surpluses and give them away to
developing nations.
c. All industries would like government price supports if they could get them; agriculture has
obtained price supports only because of its strong political clout.
Answer:
(a) Yes, historically the problem has been one of too many farmers, and public policy
has been oriented toward supporting farm prices and incomes rather than fixing the
11. What are the effects of farm subsidies such as those of the United States and the
European Union on (a) domestic ‐agricultural prices, (b) world agricultural prices, and (c) the
international allocation of agricultural resources? LO3
Answer: Domestic agricultural prices are obviously higher than they would be in the
absence of subsidies. The reason for the subsidies in the first place is that market
Chapter 19 – Agriculture: Economics and Policy
19-5
12. Use public choice theory to explain the persistence of farm subsidies in the face of major
criticisms of those subsidies. If the special‐interest effect is so strong, what factors made it
possible in 1996 for the government to end price supports and acreage allotments for several
crops? LO4
Answer: Rent-seeking behavior occurs when a group (a labor union, a firm in a specific
industry or farmers producing a particular crop) uses political means to transfer income
13. What was the major intent of the Freedom to Farm Act of 1996? Do you agree with the
intent? Why or why not? Did the law succeed in reducing overall farm subsidies? Why or why
not? LO5
Answer: The intent of the Freedom to Farm Act of 1996 was to allow markets, not
government programs, to determine what products farmers grow, where they are grown,
Chapter 19 – Agriculture: Economics and Policy
19-6
14. Distinguish the major features of direct subsidies, countercyclical payments, and marketing
loan subsidies under the Food, Conservation, and Energy Act of 2008. In what way do
countercyclical payments and marketing loans help reduce the volatility of farm income? In what
way do direct subsidies perpetuate the long‐run farm problem of too many resources in
agriculture? LO5
Answer: Direct subsidies guarantee a specific cash payment regardless of current prices
or production levels. Countercyclical payments are provided only when crop prices fall
15. LAST WORD What groups benefit and what groups lose from the U.S. sugar subsidy
program?
Answer: The benefits accrue to the sugar producers in the United States, but the costs are
heavy on U.S. consumers and foreign producers. The estimated cost to U.S. consumers is
about $1 billion per year in terms of higher sugar prices. As a result of import quotas,
PROBLEMS
1. Suppose that corn currently costs $4 per bushel and that wheat currently costs $3 per bushel.
Also assume that the price elasticity of corn is .10 while the price elasticity of wheat is .15. For
the following questions about elasticities, simply use the percentage changes that are provided
rather than attempting to calculate those percentage changes yourself using the midpoint formula
given in Chapter 4. LO1
a. If the price of corn fell by 25 percent to $3 per bushel, by what percentage would the quantity
demanded of corn increase? What if the price of corn fell by 50 percent to $2 per bushel?
b. To what value would the price of wheat have to fall in order to induce consumers to increase
their purchases of wheat by 5 percent?
Chapter 19 – Agriculture: Economics and Policy
19-7
c. If the government imposes a $.40 per bushel tax on corn so that the price of corn rises by ten
percent to $4.40 per bushel, by what percentage would the quantity demanded of corn decrease?
If the initial quantity demanded is 10 billion bushels per year, by how many bushels would the
quantity demanded decrease in response to this tax?
Feedback: Consider the following example. Suppose that corn currently costs $4 per
bushel and that wheat currently costs $3 per bushel. Also assume that the price elasticity
of corn is .10 while the price elasticity of wheat is .15.
Part a:
If the price of corn fell by 25 percent to $3 per bushel, by what percentage would the
quantity demanded of corn increase? What if the price of corn fell by 50 percent to $2 per
bushel?
To find the percentage change in the quantity of corn demanded multiply the percentage
change in price by the elasticity. Note that the quantity direction is opposite of the price
movement.
Chapter 19 – Agriculture: Economics and Policy
19-8
Part c:
If the government imposes a $.40 per bushel tax on corn so that the price of corn rises by
ten percent to $4.40 per bushel, by what percentage would the quantity demanded of corn
decrease? If the initial quantity demanded is 10 billion bushels per year, by how many
bushels would the quantity demanded decrease in response to this tax?
Using the formula discussed in part a, an increase in the price of corn via the tax results
2. Suppose that both wheat and corn have an income elasticity of .1. LO1
a. If the average income in the economy increases by 2 percent each year, by how many
percentage points does the quantity demanded of wheat increase each year, holding all other
factors constant? Holding all other factors constant, if 10 billion bushels are demanded this year,
by how many bushels will the quantity demanded increase next year if incomes rise by 2 percent?
b. Given that average personal income doubles in the United States about every 30 years, by
about how many percentage points does the quantity demanded of corn increase every 30 years,
holding all other factors constant?
Feedback: Consider the following example. Suppose that both wheat and corn have an
income elasticity of .1.
Part a:
If the average income in the economy increases by 2 percent each year, by how many
percentage points does the quantity demanded of wheat increase each year, holding all
other factors constant? Holding all other factors constant, if 10 billion bushels are
demanded this year, by how many bushels will the quantity demanded increase next year
if incomes rise by 2 percent?
To calculate the percentage change in quantity demanded multiply the percentage change
in income by the income elasticity.
Chapter 19 – Agriculture: Economics and Policy
19-9
3. Suppose that 10 workers were required in 2010 to produce 40,000 bushels of wheat on a
1000‐acre farm. LO2
a. What is the average output per acre? Per worker?
b. If in 2020 only 8 workers produce 44,000 bushels of wheat on that same 1000‐ acre farm, what
will be the average output per acre? Per worker?
c. By how many percentage points does productivity (output per worker) increase over those ten
years? Over those ten years, what is the average annual percentage increase in productivity?
Feedback: Consider the following example. Suppose that 10 workers were required in
2010 to produce 40,000 bushels of wheat on a 1000‐acre farm.
Part a:
What is the average output per acre? Per worker?
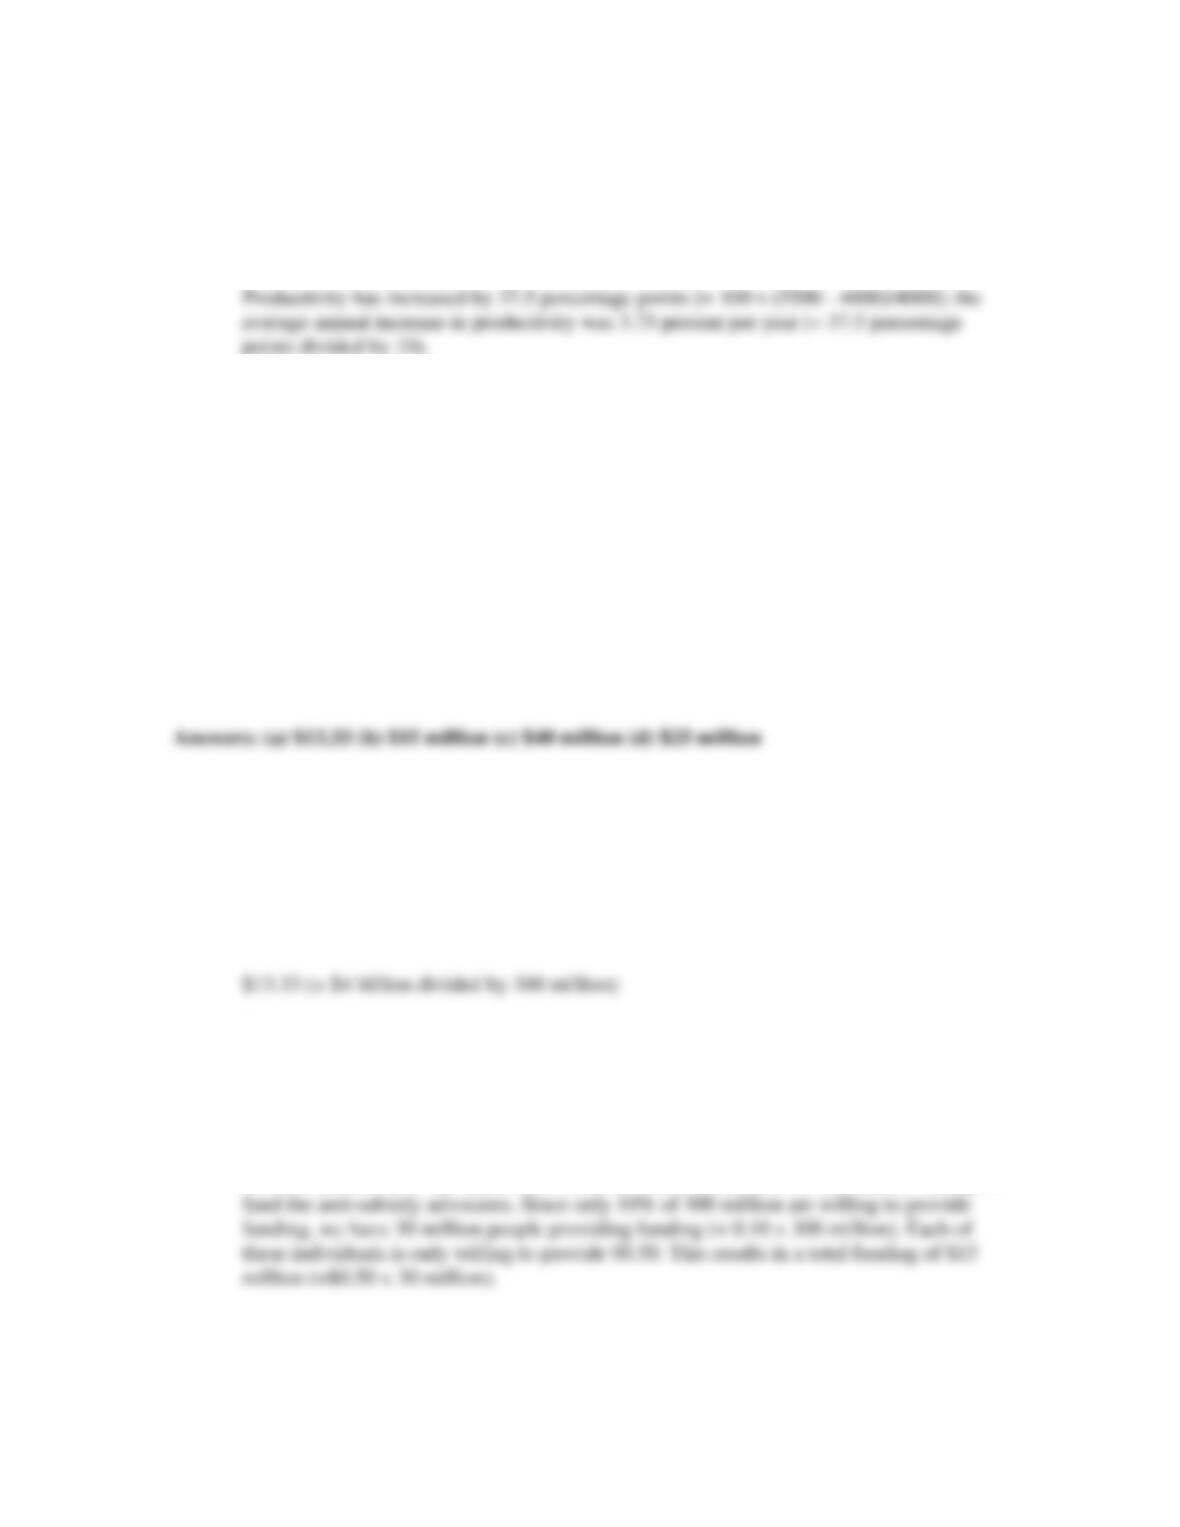
Average output per acre will be 40 bushels per acre (= 40,000 bushels divided by 1000
Part b:
If in 2020 only 8 workers produce 44,000 bushels of wheat on that same 1000‐ acre farm,
what will be the average output per acre? Per worker?
Chapter 19 – Agriculture: Economics and Policy
19–10
Part c:
By how many percentage points does productivity (output per worker) increase over
those ten years? Over those ten years, what is the average annual percentage increase in
productivity?
4. In 2009, it was estimated that the total value of all corn‐production subsidies in the United
States totaled about $4 billion. The population of the United States was approximately 300
million people that year. LO3
a. On average, how much did corn subsides cost per person in the United States in
2009? (Hint: A billion is a 1 followed by nine zeros. A million is a 1 followed by six zeros.)
b. If each person in the United States is only willing to spend $.50 to support efforts to overturn
the corn subsidy, and if anti‐subsidy advocates can only raise funds from 10 percent of the
population, how much money will they be able to raise for their lobbying efforts?
c. If the recipients of corn subsidies donate just one percent of the total amount that they receive
in subsidies, how much could they raise to support lobbying efforts to continue the corn subsidy?
d. By how many dollars does the amount raised by the recipients of the corn subsidy exceed the
amount raised by the opponents of the corn subsidy?
Feedback: Consider the following example: In 2009, it was estimated that the total
value of all corn‐production subsidies in the United States totaled about $4 billion. The
population of the United States was approximately 300 million people that year.
Part a:
On average, how much did corn subsides cost per person in the United States in
2009?
Part b:
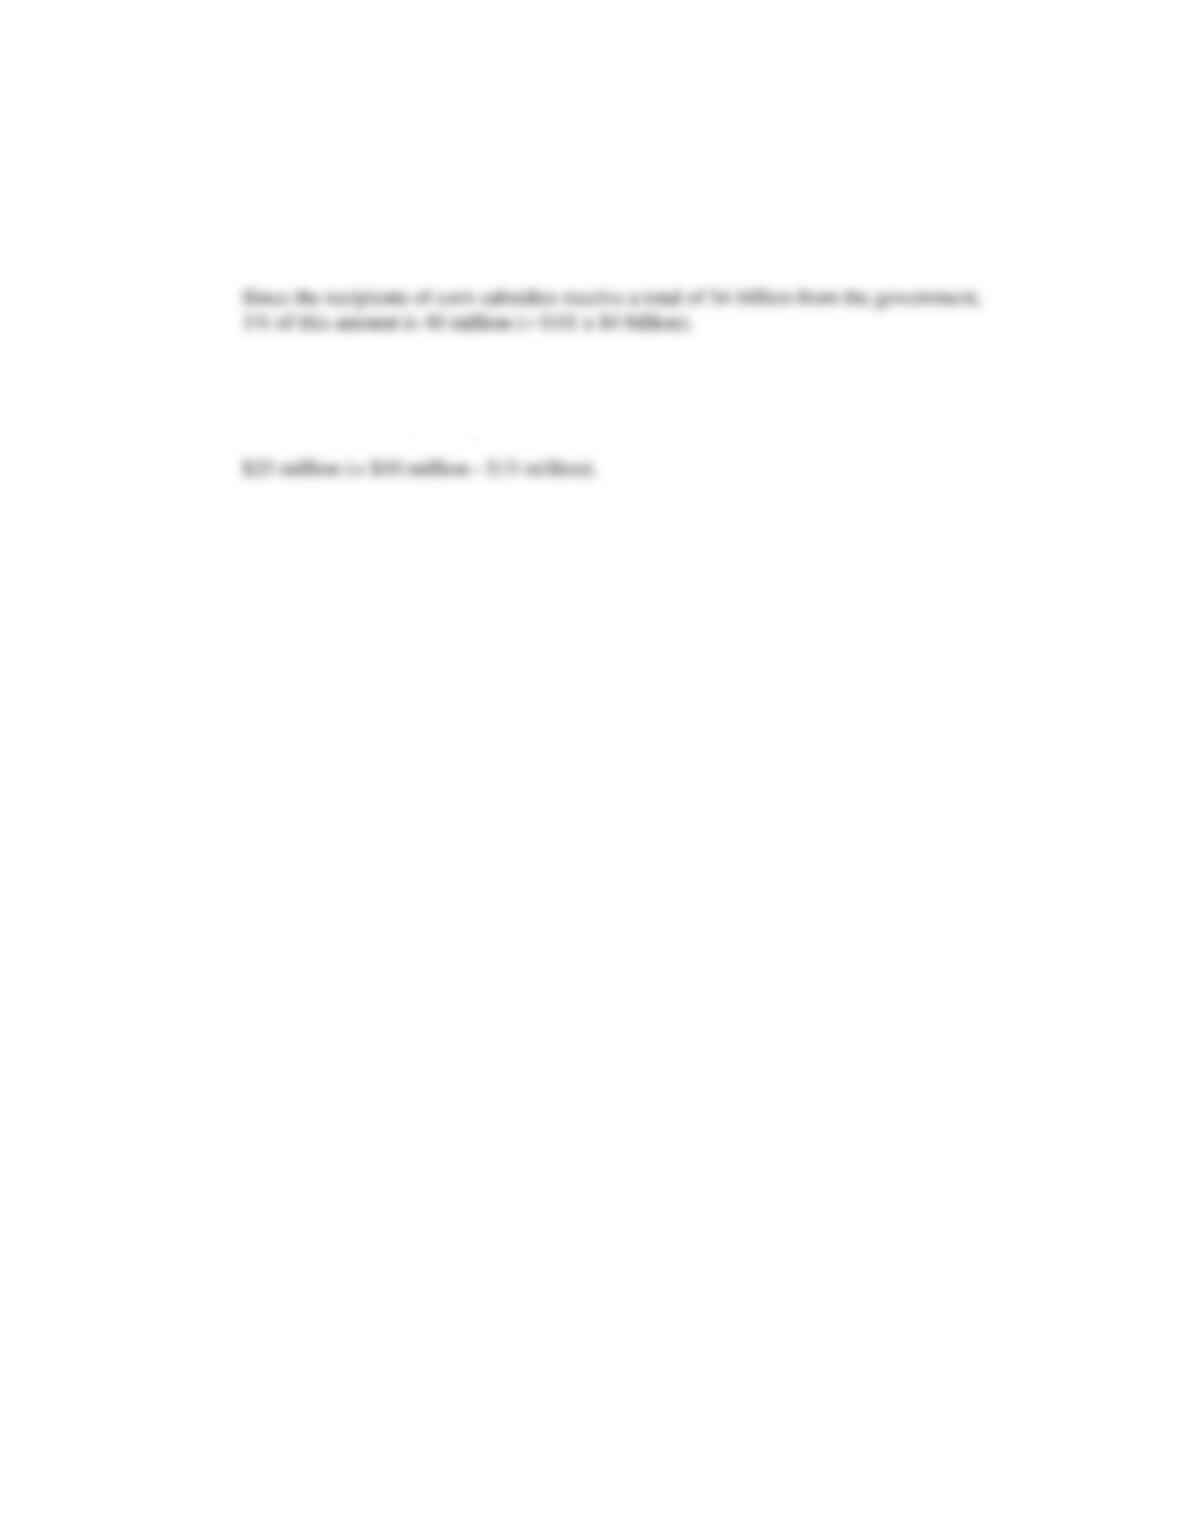
If each person in the United States is only willing to spend $.50 to support efforts to
overturn the corn subsidy, and if anti‐subsidy advocates can only raise funds from 10
percent of the population, how much money will they be able to raise for their lobbying
efforts?
To find the answer to this question we first calculate the number of individuals willing to
Chapter 19 – Agriculture: Economics and Policy
19–11
Part c:
If the recipients of corn subsidies donate just one percent of the total amount that they
receive in subsidies, how much could they raise to support lobbying efforts to continue
the corn subsidy?
Part d:
By how many dollars does the amount raised by the recipients of the corn subsidy exceed
the amount raised by the opponents of the corn subsidy?