Mishkin • Instructor’s Manual for The Economics of Money, Banking, and Financial Markets, Twelfth Edition 210
Chapter 19
ANSWERS TO QUESTIONS
1. How would you expect velocity to typically behave over the course of the business cycle?
Since nominal GDP falls during recessions, and as a result expansionary monetary policy,
2. If velocity and aggregate output are reasonably constant (as the classical economists
believed), what will happen to the price level when the money supply increases from $1
trillion to $4 trillion?
3. If credit cards were made illegal by congressional legislation, what would happen to
velocity? Explain your answer.
4. “If nominal GDP rises, velocity must rise.” Is this statement true, false, or uncertain?
Explain your answer.
5. Why would a central bank be concerned about persistent, long-term budget deficits?
Persistent long-term budget deficits can lead to the perception or worry that policymakers
will satisfy the government budget constraint by monetizing the debt in the future, leading to
6. “Persistent budget deficits always lead to higher inflation.” Is this statement true, false, or
uncertain? Explain your answer.
Uncertain. As long as a country (such as the United States) has reliable access to bond
7. Why might a central bank choose to monetize the debt, knowing that it could lead to higher
inflation?
If the government is running large deficits, this could lead to higher interest rates, which
could be contractionary to the economy or be misaligned from the central bank’s optimal
8. Consider two central banks: one with a history of maintaining price stability and low
inflation, and the other with a history of high inflation and poor inflation management. All
else equal, if the same level of government budget deficit is monetized in both countries, how
is inflation likely to behave in each country?
Central banks with a poor history of inflation management can easily experience an
unanchoring of (or sharp increase in) inflation expectations. So if the monetary base
9. Some payment technologies require infrastructure (e.g., merchants need to have access to
credit card swiping machines). In most developing countries historically this infrastructure
has either been nonexistent or very costly however recent mobile payment systems have
expanded rapidly in developing countries as they have become cheaper. Everything else
being equal, would you expect the transaction component of the demand for money to be
increasing or decreasing in a developing country relative to a rich country?
In general the need for costly infrastructure to support new payment technologies would
10. What three motives for holding money did Keynes consider in his liquidity preference theory
of the demand for real money balances? On the basis of these motives, what variables did he
think determined the demand for money?
11. In many countries, people hold money as a cushion against unexpected needs arising from a
variety of potential scenarios (e.g., banking crises, natural disasters, health problems,
unemployment, etc.) that are not usually covered by insurance markets. Explain the effect of
such behavior on the precautionary component of the demand for money.
12. Why is Keynes’s analysis of the speculative demand for money important to his view that
velocity will undergo substantial fluctuations and thus cannot be treated as constant?
Because it indicates that money demand and hence velocity is affected by interest rates, and
since interest rates fluctuate a lot, velocity will as well. Furthermore, as the answer to
13. According to the portfolio theories of money demand, what are the four factors that
determine money demand? What changes in these factors can increase the demand for
money?
The four factors determining money demand under portfolio theory are: interest rates
14. Explain how the following events will affect the demand for money according to the portfolio
theories of money demand:
a. The economy experiences a business cycle contraction.
Since risk of alternative assets increases, liquidity of alternative assets likely decreases, and
b. Brokerage fees decline, making bond transactions cheaper.
Cheaper bond transactions make the bond market more liquid, leading to an increase in
c. The stock market crashes. (Hint: Consider both the increase in stock price volatility
following a market crash and the decrease in wealth of stockholders.)
The stock market crash would lead to higher volatility, and hence risk in stocks, which
15. Suppose a given country experienced low and stable inflation rates for quite some time, but
then inflation picked up and over the past decade has been relatively high and quite
unpredictable. Explain how this new inflationary environment would affect the demand for
money according to portfolio theories of money demand. What would happen if the
government decided to issue inflation-protected securities?
The demand for money would likely fall. Compared to other assets, money would be more
16. Consider the portfolio choice theory of money demand. How do you think the demand for
money would be affected during a hyperinflation (i.e., monthly inflation rates in excess of
50%)?
17. Both the portfolio choice and Keynes’s theories of the demand for money suggest that as the
relative expected return on money falls, demand for it will fall. Why does the portfolio choice
approach predict that money demand is affected by changes in interest rates? Why did
Keynes think that money demand is affected by changes in interest rates?
In Keynes’s view, a rise in interest rates leads to a lower relative expected return of money
18. Why does the Keynesian view of the demand for money suggest that velocity is unpredictable?
In Keynes’s view, velocity is unpredictable because interest rates, which have large
fluctuations, affect the demand for money and hence velocity. In addition, Keynes’s analysis
19. What evidence is used to assess the stability of the money demand function? What does the
evidence suggest about the stability of money demand, and how has this conclusion affected
monetary policymaking?
Velocity is used to indicate if the money demand function is stable. If velocity is predictable
and stable, then the money demand function is also stable, and vice versa. Up until the early
20. Suppose that a plot of the values of M2 and nominal GDP for a given country over 40 years
shows that these two variables are very closely related. In particular, a plot of their ratio
(nominal GDP/M2) yields very stable and easy-to-predict values. On the basis of this
evidence, would you recommend that the monetary authorities of this country conduct
monetary policy by focusing mostly on the money supply rather than on setting interest
rates? Explain.
This stable relationship implies that the velocity of the M2 money supply is very stable, and
ANSWERS TO APPLIED PROBLEMS
21. Suppose the money supply M has been growing at 10% per year, and nominal GDP, PY, has
been growing at 20% per year. The data are as follows (in billions of dollars):
2018 2019 2020
M 100 110 121
PY 1,000 1,200 1,440
Calculate the velocity for each year. At what rate is the velocity growing?
22. Calculate what happens to nominal GDP if velocity remains constant at 5 and the money
supply increases from $200 billion to $300 billion.
23.
Wha
t
30%
?
24.
I
f ve
l
happ
25.
Supp
Use
t
velo
c
Y (in
b
Intere
s
1
1
4
4
0
3
5
0
ANSW
E
1.
Go t
o
(M1
S
to “
q
f
rom
a.
C
s
i
t
happens to
?
l
ocity and a
g
ens to the p
r
o
se the liqu
i
t
he money d
e
c
ity for each
P
P
e
b
illions) 1
2
s
t Rate
0
E
RS TO D
A
o
the St. Lou
S
L), M1 Mo
n
q
uarterly” u
s
Year Ago”
s
C
alculate th
e
i
nce 2000:
Q
nominal G
D
g
gregate ou
tp
r
ice level if
t
i
dity prefere
n
e
mand equa
t
p
eriod.
eriod
1
Pe
e
riod 1 Pe
r
2
,000 1
2
0
.05
0
A
TA ANAL
Y
is Federal
R
n
ey Velocity
s
ing the fre
q
s
etting for u
n
e
average pe
r
Q
1.
D
P if the mo
n
p
ut remain
c
t
he money s
u
n
ce functio
n
t
ion, along
w
riod
2
Per
i
r
iod 2 Per
i
2
,500 12
,
0
.07 0
.
Y
SIS PRO
B
R
eserve FR
E
(M1V), and
q
uency settin
g
n
its.
r
centage ch
a
n
ey supply
g
c
onstant at
5
u
pply declin
e
n
is given by
w
ith the foll
o
i
od
3
Perio
d
i
od 3 Peri
o
,
250 12,
5
.
03 0.
0
B
LEMS
E
D database,
Real GDP
(
g
, and for a
l
a
nge in real
g
rows by 20
%
5
and $1,00
0
e
s from $40
0
o
wing table
o
d
4
Period
od 4 Peri
o
5
00 12,
8
0
5 0.
0
,
and find d
a
(
GDPC1).
C
l
l three seri
e
GDP, the
M
%
but veloc
i
0
billion, re
sp
0
billion to
$
of values, t
o
5
Period
6
o
d 5 Perio
d
8
00 13,0
0
0
7 0.0
4
a
ta on the
M
C
onvert the
M
e
s, use the “
P
M
1 money st
o
i
ty declines
b
sp
ectively,
w
$
300 billion
?
o
calculate t
h
6
Period
7
d
6 Perio
d
0
0 13,2
0
4
0.0
6
M
1 Money St
o
M
1SL data s
e
P
ercent Ch
a
o
ck, and vel
o
b
y
w
hat
?
h
e
d
7
0
0
6
o
ck
e
ries
a
nge
o
city
Mishkin • Instructor’s Manual for The Economics of Money, Banking, and Financial Markets, Twelfth Edition 216
b. Based on your answer to part (a), calculate the average inflation rate since 2000 as
predicted by the quantity theory of money.
Based on part (a), the average inflation rate should be about %ǻM + %ǻV – %ǻY = 6.74
c. Next, find the data on the GDP deflator price index (GDPDEF), download the data using
the ‘Percent Change from Year Ago’ setting, and calculate the average inflation rate
since 2000:Q1. Comment on the value relative to your answer in part (b).
Average inflation per year for the period using GDPDEF is 1.96%, which is lower than
2. Go to the St. Louis Federal Reserve FRED database and find data on the budget deficit
(FYFSD), the amount of federal debt held by the public (FYGFDPUN), and the amount of
federal debt held by the Federal Reserve (FDHBFRBN). Convert the two “debt held” series
to “Annual” using the frequency setting. Download all three series into a spreadsheet. Make
sure that the rows of data align properly to the correct dates. Note that for the deficit series,
a negative number indicates a deficit; multiply the series by –1 so that a deficit is indicated
by a positive number. Manipulate the three series so that all data are given in terms of the
same units (either millions or billions of dollars). To do this, if a series is in millions and you
are converting it to billions, divide the series by 1000. Finally, for each year, convert the two
“debt held” series into one “changes in debt holdings by the public and the Federal
Reserve” series by calculating, for each year, the difference in bond holdings from the
preceding year.
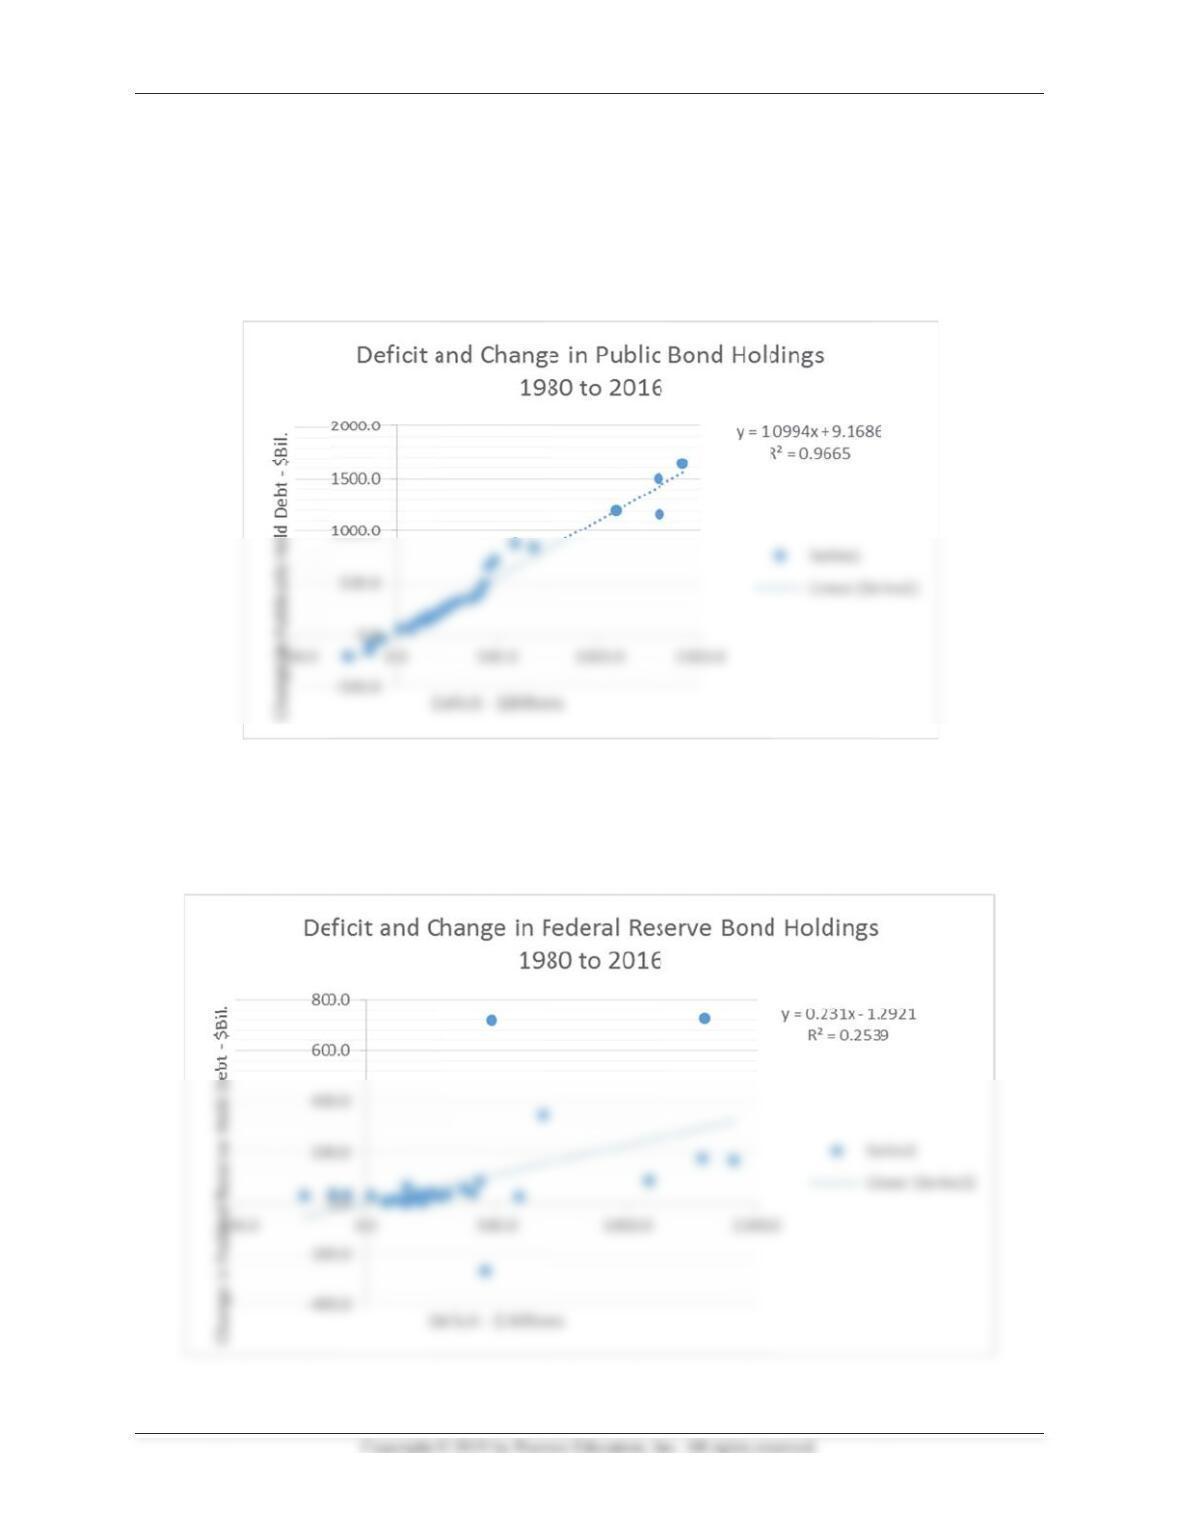
a. Create a scatter plot showing the deficit on the horizontal axis and the change in bond
holdings by the public on the vertical axis, using the data from 1980 through the most
b. Create a scatter plot showing the deficit on the horizontal axis and the change in bond
holdings by the Federal Reserve on the vertical axis, using the data from 1980 through
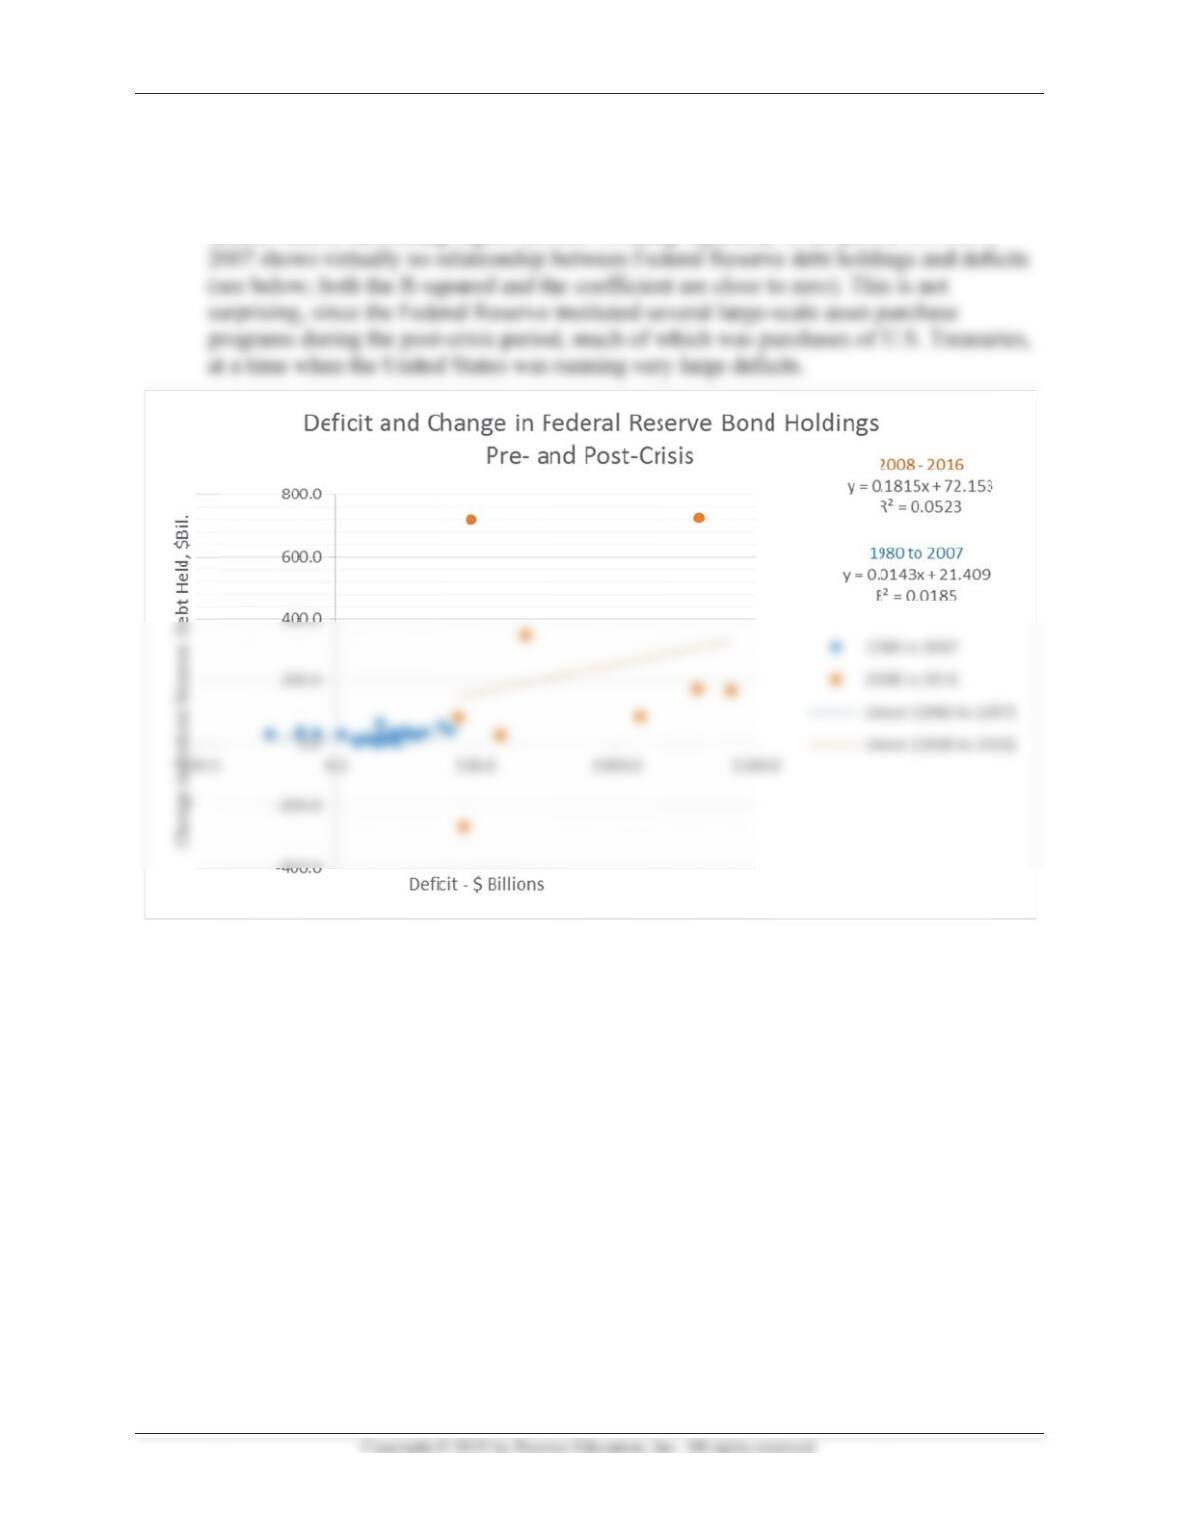
c. Now repeat part (b), but create separate scatterplots for the period of 1980 to 2007, and
2008 to the most recent year. Comment on how, if at all, the monetizing of the debt is
Mishkin •
a.
S
r
e
l
i
o
n
n
b. S
p
o
b
p
r
i
t
I
nstructor’s Ma
n
ee below.
N
e
lationship
b
i
ne is very s
t
n
e-to-one r
e
ew debt iss
u
ee graph be
l
ositive relat
i
b
vious (and
r
edictive po
w
t
in debt hol
d
n
ual for The Ec
o
N
ot surprisin
g
b
etween def
i
t
eep (and ha
s
e
lationship.
T
u
ed.
l
ow. For the
i
onship sug
g
using a fitt
e
w
er). In par
t
d
ings.
o
nomics of Mon
e
g
ly, from 19
i
cits and the
s
a high
R
-s
q
T
hus, from t
h
change in
h
g
esting som
e
e
d regressio
n
t
icular, for e
e
y, Banking, an
d
80 to 2016,
change in b
o
q
uared if us
i
h
is data it a
p
h
oldings by t
e
monetizati
o
n
line indica
t
ach $1 of d
e
d
Financial Mar
k
there appea
r
o
nd holding
i
ng a regres
s
p
pears that t
h
t
he Federal
R
o
n of the de
b
t
es a much
s
e
ficit, the Fe
k
ets, Twelfth E
d
r
s to be a ve
r
s by the pu
b
s
ion line), a
n
h
e public a
b
R
eserve, the
r
b
t, but this i
s
s
maller relat
i
e
d absorbs a
b
d
ition
r
y strong
b
lic, as the fi
n
d has close
b
sorbs all of
t
r
e appears t
o
s
much less
i
onship, wit
h
b
out 23 cent
s
217
tted
to a
t
he
o
be a
h
less
s of
Mishkin •
c. S
s
c
d
u
c
e
I
nstructor’s Ma
n
ee graph be
l
c
atterplot d
a
u
ring 2008
t
e
ntral bank
i
n
ual for The Ec
o
l
ow. There
a
a
ta in the po
s
t
o 2016, the
i
s facilitatin
g
o
nomics of Mon
e
a
ppears to b
e
s
t-crisis peri
o
change in b
o
g
higher de
fi
e
y, Banking, an
d
e
some amo
u
o
d: in gener
a
o
nd holding
s
fi
cits. Looki
n
d
Financial Mar
k
u
nt of debt
m
a
l, as the de
f
s
by the Fe
d
n
g separatel
y
k
ets, Twelfth E
d
m
onetizatio
n
f
icits get si
g
d
gets larger,
y
at the peri
o
d
ition
n
in the
g
nificantly l
a
indicating
t
o
d of 1980 t
o
218
a
rger
t
he
o