
Chapter 18
Consumption and Saving
◼ Chapter Outline, Overview, and Teaching Tips
Chapter Outline
The Relationship Between Consumption and Saving
Intertemporal Choice and Consumption
The Intertemporal Budget Constraint
The Intertemporal Choice Model in Practice: Income and Wealth
Response of Consumption to Income
The Intertemporal Choice Model in Practice: Interest Rates
Interest Rates and the Intertemporal Budget Line
The Optimal Level of Consumption and the Intertemporal Budget Line
Borrowing Constraints
The Keynesian Theory of Consumption
The Keynesian Consumption Function: Building Blocks
The Permanent Income Hypothesis
The Permanent Income Consumption Function
Application: Consumer Confidence and the Business Cycle
Relationship of the Permanent Income Hypothesis and Intertemporal Choice
206 Mishkin • Macroeconomics: Policy and Practice, Second Edition
Two Modifications of the Theory: The Random Walk Hypothesis and Behavioral Economics
The Random Walk Hypothesis
Behavioral Economics and Consumption
Policy and Practice: Behavioral Policies to Increase Saving
Chapter 18 Web Appendix: Income and Substitution Effects: A Graphical Analysis
Chapter Overview and Teaching Tips
This chapter begins Part Seven of the book, which focuses on the microeconomic foundations of
Chapter 18 lays out the theory of consumption and saving. It is first important to let students know that
consumption and saving are just two sides of the same coin, so a theory of consumption is a theory of saving,
The chapter then goes on to discuss the three basic theories of consumption: the Keynesian consumption
function, the permanent income hypothesis, and the life-cycle hypothesis. One key feature of the treatment
in this text, which is typically not always present in others, is that it shows how all three theories are
related to the basic intertemporal choice model, thereby showing the relationships between them. One
Application that should interest students given their natural interests in what went wrong during the recent
financial crisis is “Housing, the Stock Market, and the Collapse of Consumption in 2008 and 2009.”
Chapter 18 Consumption and Saving 207
◼ Answers to End of Chapter Review Questions and Problems
Answers to Review Questions
The Relationship Between Consumption and Savings
1. Letting S represent private saving, C consumption expenditure, and Y disposable income, it is true
Intertemporal Choice and Consumption
2. The intertemporal budget constraint is based on the idea that a person’s lifetime consumption depends
on (is constrained by) his or her lifetime resources. Borrowing allows people to increase their current
consumption at the expense of future consumption, and saving rewards them for foregoing current
consumption by making possible greater future consumption. The diagrammatic form of the
3. Indifference curves show various combinations of current (period 1) and future (period 2)
consumption among which consumers are indifferent (that is, they have no preference for any one
combination over the others) because the combinations all provide the same level of satisfaction (or
4. The consumer wishes to choose the combination of current and future consumption that will yield the
The Intertemporal Choice Model in Practice: Income and Wealth
5. Increases in current income, future income, and wealth all shift the intertemporal budget line (IBL) to
the right. As a result, current and future consumption both increase. This outcome reflects consumers’
208 Mishkin • Macroeconomics: Policy and Practice, Second Edition
The Intertemporal Choice Model in Practice: Interest Rates
6. Increases in the real interest rate make the IBL pivot around the “no borrowing or lending point” at
which current consumption equals current income plus wealth. If the real interest rate rises, the IBL
becomes steeper (pivots clockwise) to reflect the higher opportunity cost of current consumption and
the higher maximum future consumption that results from higher interest earnings possible on period
7. Consumers face a binding borrowing constraint if they prefer to consume more than their income in
period 1 but are unable to borrow to do so. This prevents them from achieving the optimal balance
between their current and future consumption. The IBL for these consumers is kinked and becomes a
The Keynesian Theory of Consumption
8. Keynes’s consumption theory is based on the notions that as disposable income rises, consumer
spending also rises, but by a smaller amount, and that consumers spend a smaller proportion and save
borrowing constraints.
The Permanent Income Hypothesis
9. Milton Friedman’s permanent income hypothesis divides income into two components, permanent
income that a consumer expects to persist over time (and therefore reflects his or her lifetime
The Life-Cycle Hypothesis
10. The life-cycle hypothesis assumes that people smooth their consumption over their entire lifetime,
saving some of their income during their working lives to finance their consumption during
retirement. Their lifetime resources consist of earned income and wealth that accumulates as people
Chapter 18 Consumption and Saving 209
Two Modifications of the Theory: The Random Walk Hypothesis and Behavioral Economics
11. The random walk hypothesis posits that consumers are forward looking and base their consumption
decisions on their current expectations about future income and lifetime resources. Changes in
consumers’ expectations are unpredictable in that they occur when unanticipated new information
becomes available, so changes in consumption are unpredictable and follow a random walk. In
Answers to Problems
Intertemporal Choice and Consumption
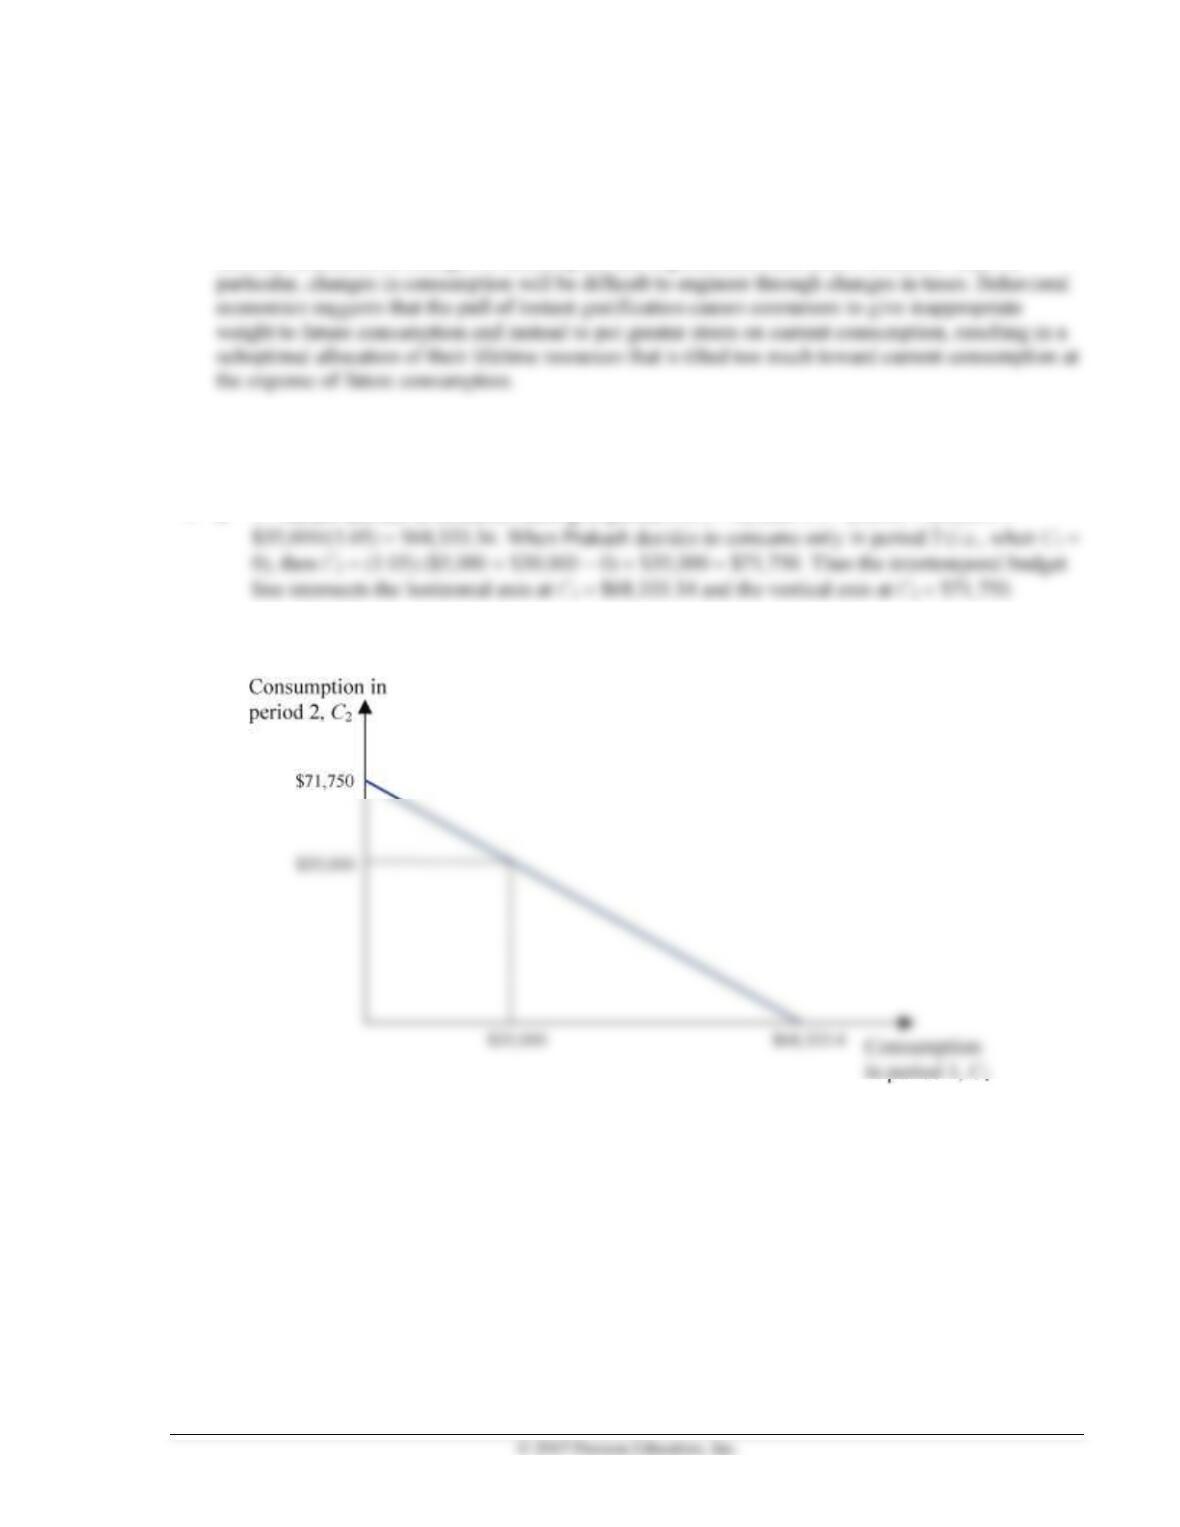
1. a. If Prakash decides to consume nothing in period 2 (C2 = 0), then C1 = $5,000 + $30,000 +
b. C1 = $35,000 when Prakash decides to have no savings at the end of period 1. C2 is therefore
$35,000.
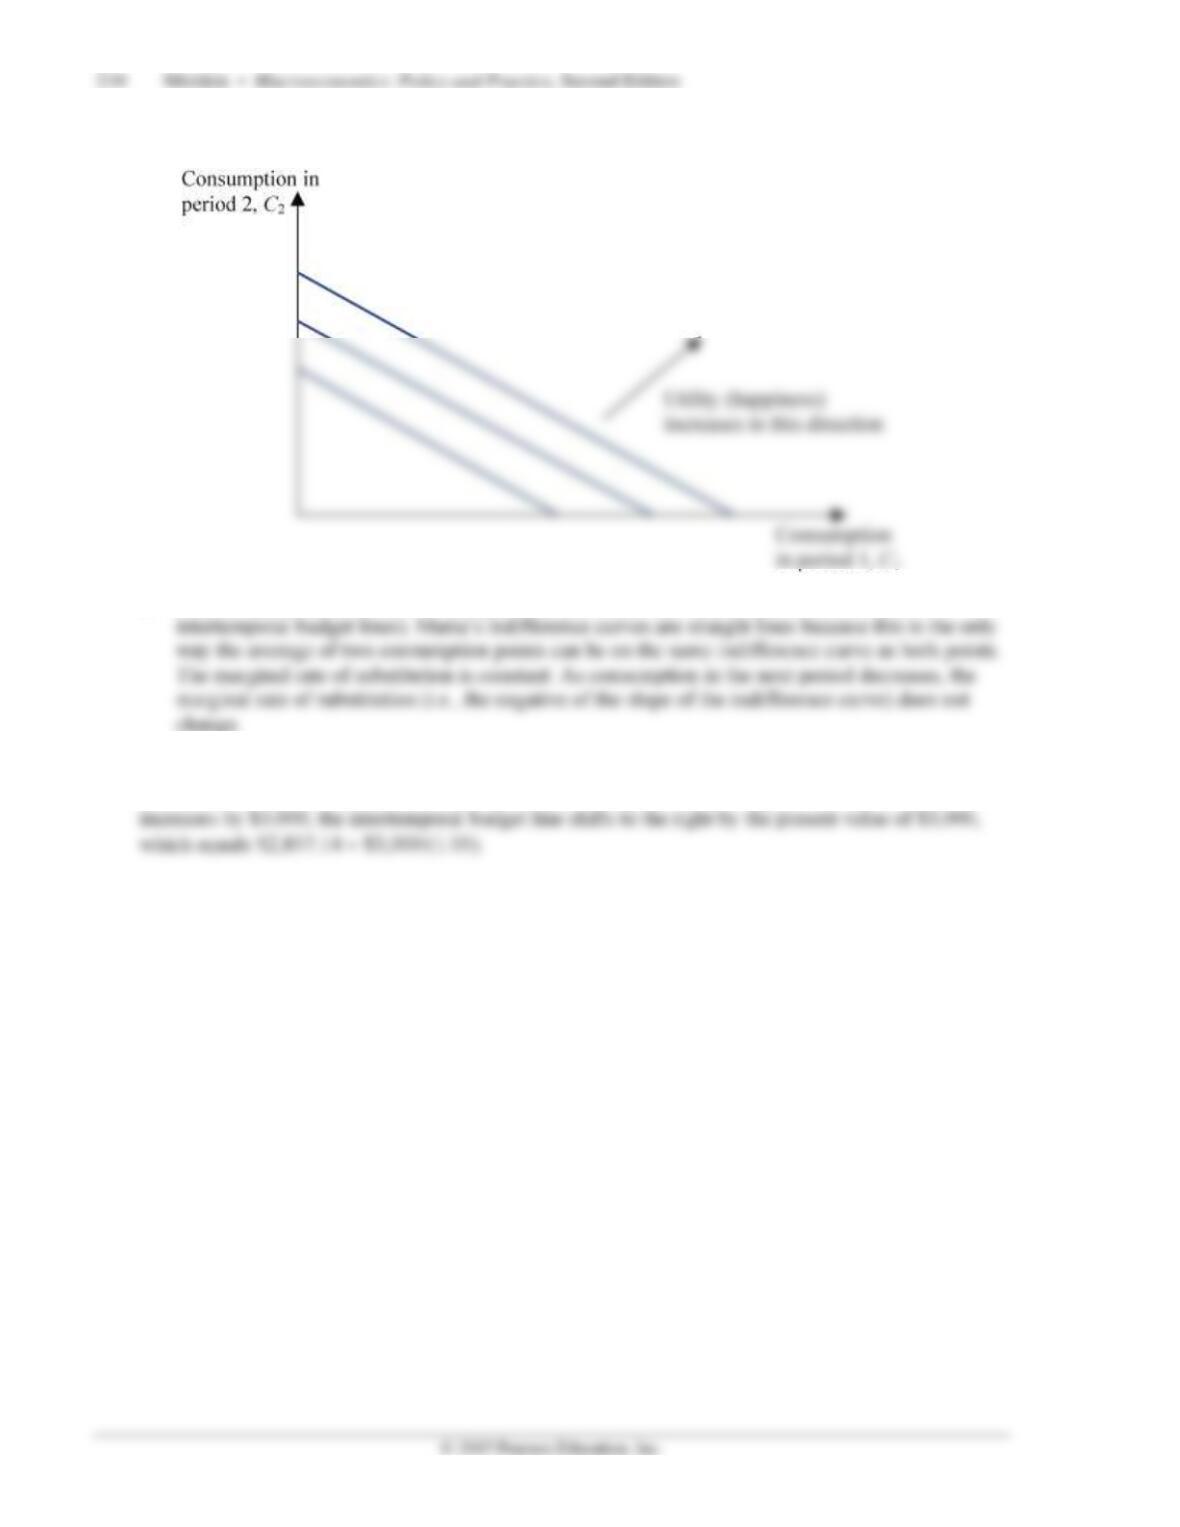
2. a.
b. Maria’s indifference curves are straight lines (note that these are indifference curves, not
The Intertemporal Choice Model in Practice: Income and Wealth
3. An increase in future income shifts the intertemporal budget line to the right. If next period’s income
Chapter 18 Consumption and Saving 211
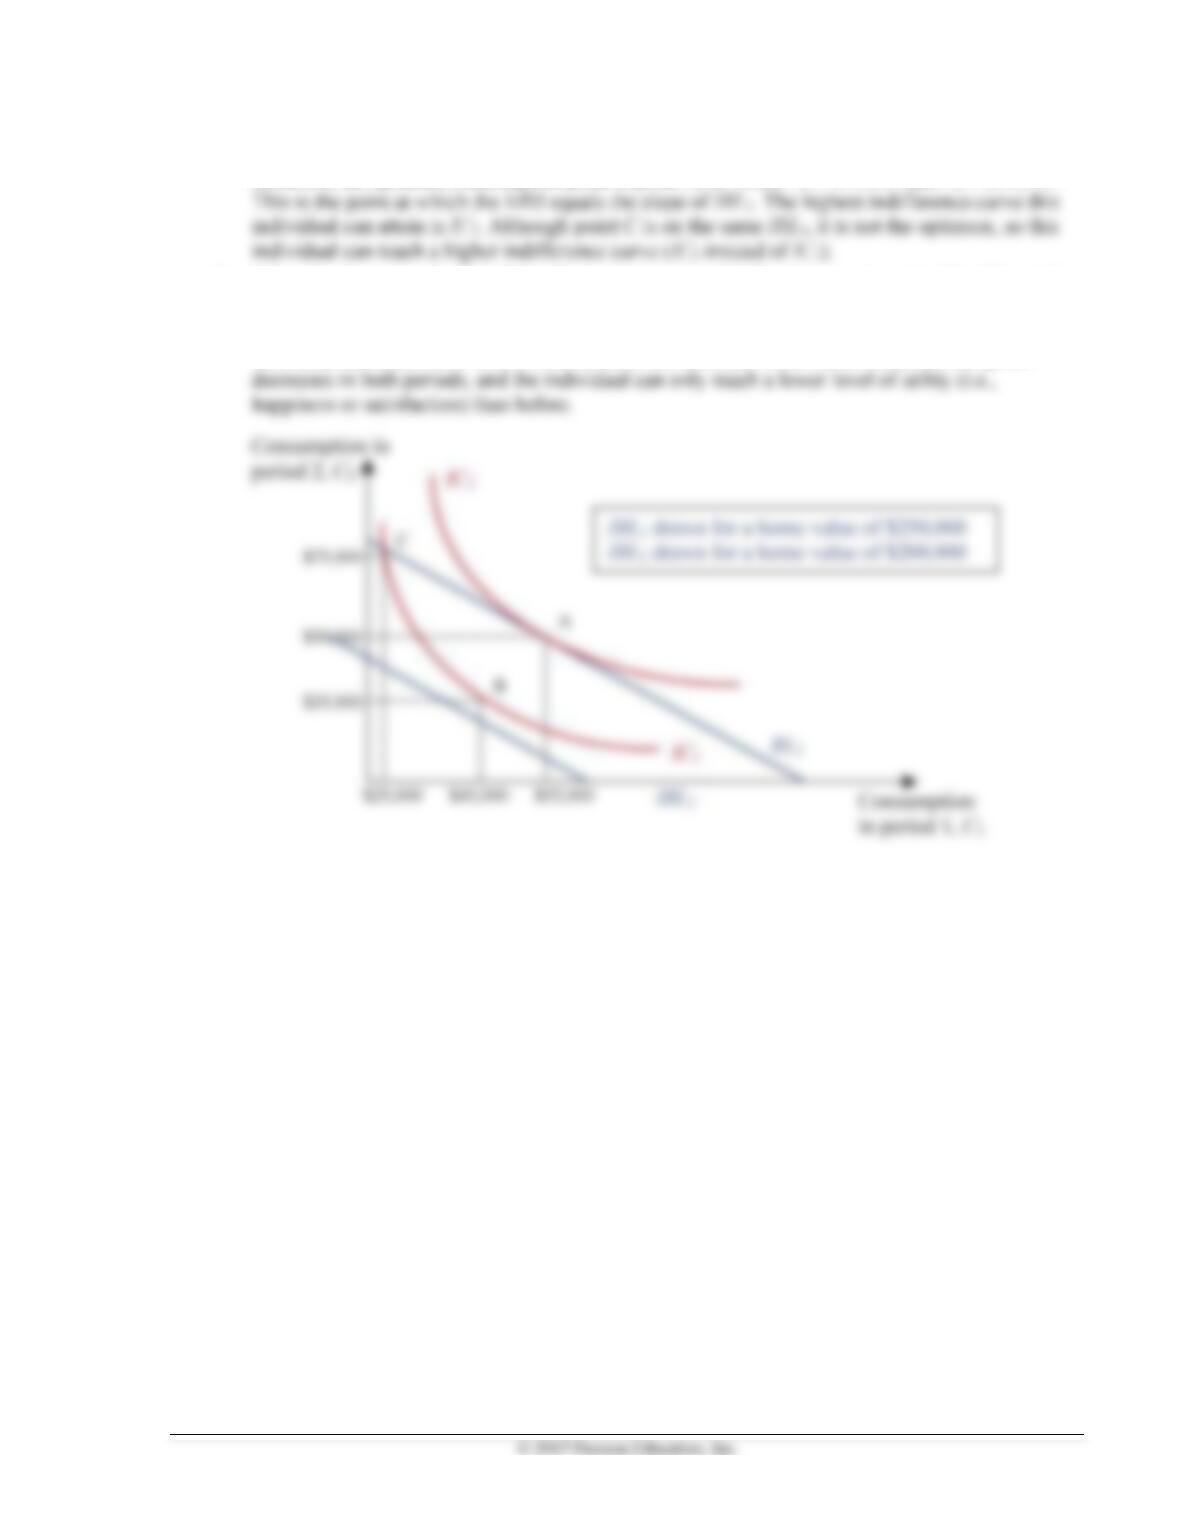
4. a. When the home is valued at $250,000 the intertemporal budget line is represented by IBL1, and
therefore, the optimum consumption point is point A, at which C1 = $55,000 and C2 = $50,000.
b. When the home is valued at $200,000 the intertemporal budget line is represented by IBL2, and
therefore, the optimum consumption point is point B, where C1 = $45,000 and C2 = $35,000. This
is the points at which the MRS equals the slope of IBL2. The highest indifference curve this
individual can attain now is IC1. As a result of the decrease in the home value, consumption
212 Mishkin • Macroeconomics: Policy and Practice, Second Edition
The Intertemporal Choice Model in Practice: Interest Rates
5. A decrease in the interest rate rotates the intertemporal budget line counterclockwise. The new
intertemporal budget line shares the point at which the individual has no savings at the end of period
1 (i.e., when the individual consumes exactly the value of his or her wealth and period 1 income). As
a result, consumption in period 2 unambiguously decreases. The substitution effect increases
consumption in period 1 because consumption in period 2 is now more expensive (C2/(1 + r) has
increased). Alternatively, you can think that incentives to save have decreased because the interest
rate earned on savings is now smaller. The income effect decreases consumption in period 1, as the
lower interest rate decreases available resources for period 2 and therefore reduces consumption in
both periods, but it is smaller than the substitution effect, so consumption in period 1 increases when
the two effects are combined.
The Keynesian Theory of Consumption
6. a.
Chapter 18 Consumption and Saving 213
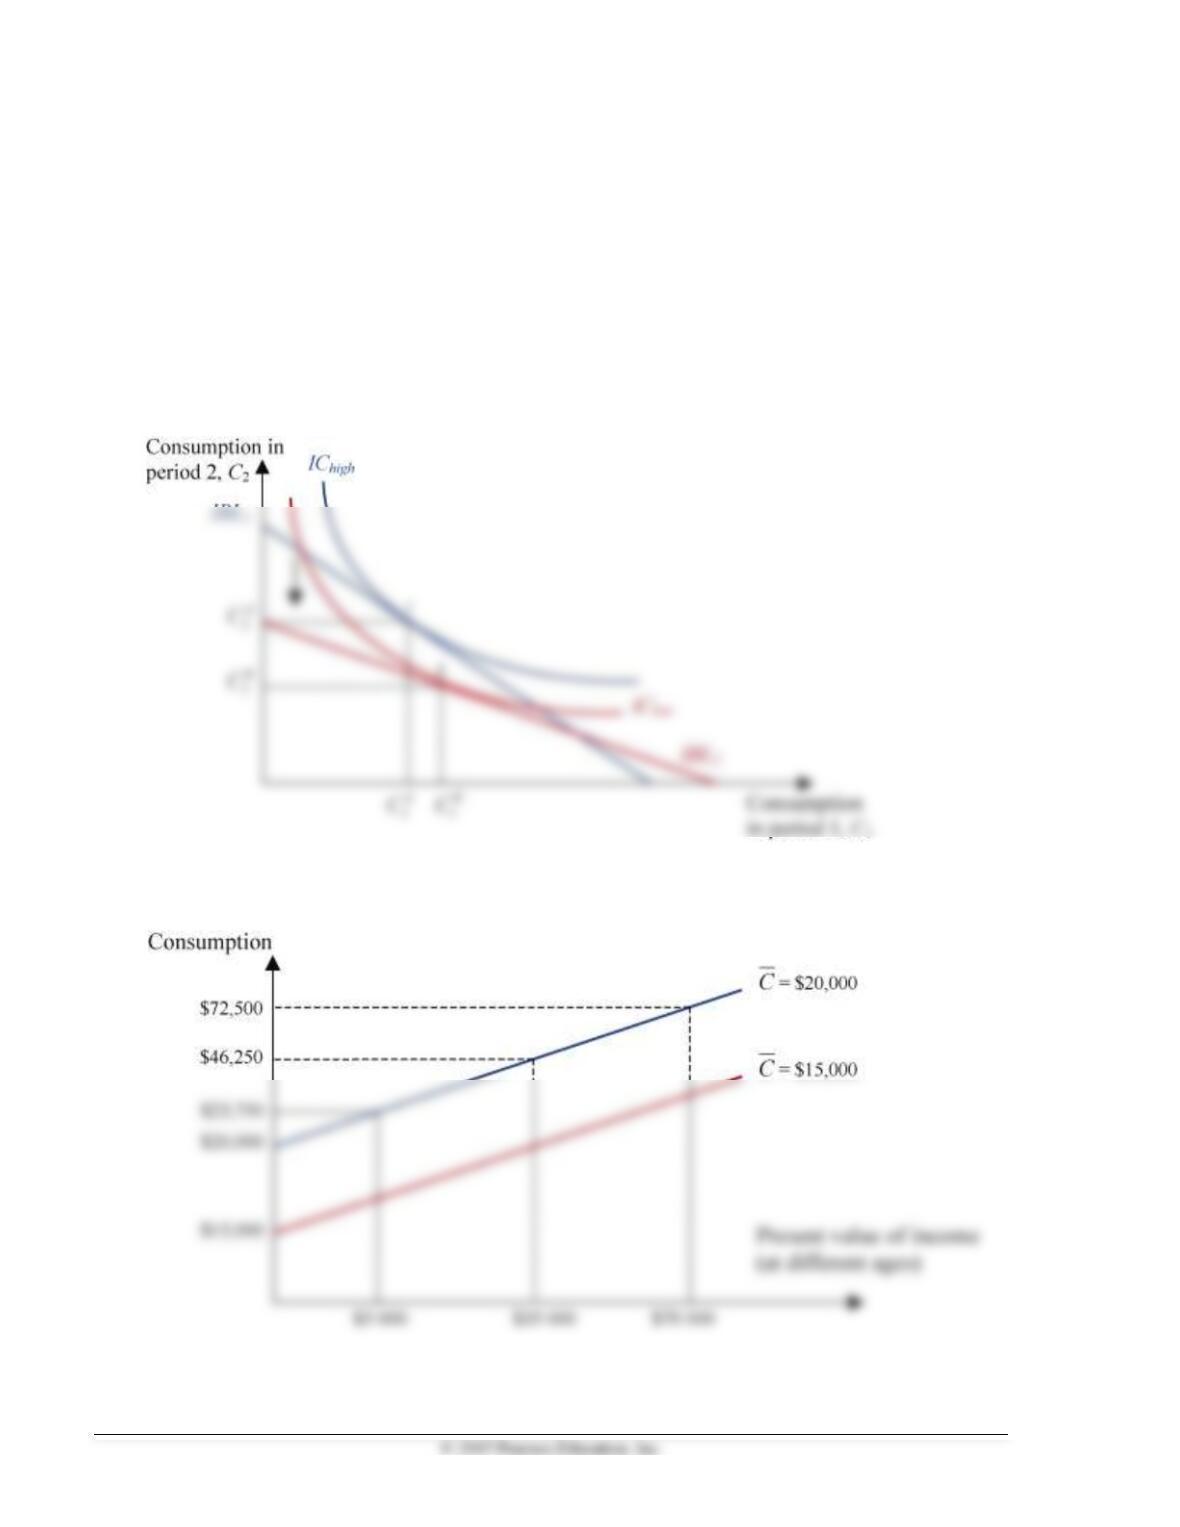
b. Nicole’s average propensity to consume is $23,750/$5,000 = 4.75 when she is 15 years old (and
her income is $5,000). Similar calculations indicate that her average propensity to consume is
1.32 and 1.03 when her income is $35,000 and $70,000, respectively.
7. According to the Keynesian consumption function, a rich country should have a lower average
propensity to consume than a poorer country does because the rich country has a higher income.
The Life-Cycle Hypothesis
8. Pensions and other types of supplemental income during retirement play a significant role for many
individuals. According to the life-cycle hypothesis, an unexpected decline in this type of income will
Two Modifications of the Theory: The Random Walk Hypothesis and Behavioral Economics
9. a. If taxes increase by less than expected, individuals’ disposable income will be higher than
expected, which will result in higher current consumption. According to the random walk
hypothesis, current consumption will increase, even if taxes have increased because individuals
10. The application of behavioral economics ideas to consumption behavior concludes that measures like
the creation of IRAs would not have a significant effect on individuals’ consumption (and therefore
savings) decisions. Instruments like IRAs encourage savings by protecting contributions to a savings
◼ Answers to Data Analysis Problems
1. a. For 2011 and 2012, the real interest rate is 0.56 percent and –0.48 percent, averaging 0.04
percent. Consumption (in $billions) is $10,291.3 and $10,517.6, respectively.
214 Mishkin • Macroeconomics: Policy and Practice, Second Edition
2. See table below. For the periods of 2011:Q3 to 2012:Q2 and 2012:Q3 to 2013:Q2, it does not support
Keynes’ third conjecture. Disposable income on average rose slightly over that period of time, by
about 2.9 percent between the two four quarter periods. However, the average of the APC was
essentially constant (increased ever so slightly). The behavior of the APS seems to reinforce this, as
the average propensity to save declined slightly as income rose over the two periods. Keynes’ third
3. a. See table below.
b. The population went slightly “younger” from the 1980s to the 1990s, suggesting under the life-
cycle hypothesis that the MPC out of permanent income should increase over that time. In the
1990s onward, those 55 years and older became an increasingly larger fraction of the whole
population, as a result, the MPC out of permanent income on average should decrease.
4. Yes, they behave as expected. From 2011:Q4 to 2012:Q4, the consumer sentiment index
increased by 79.4 – 64.8 = 14.6. Over the same time, consumption grew to $10,584.8 billion,
◼ Answers to Review Questions and Problems in Web Appendix,
“Income and Substitution Effects: A Graphical Analysis”
1. The substitution effect refers to how an individual’s consumption in periods 1 and 2 would respond to
a change in the relative price of consumption in each time period, holding his or her wealth and
2. The income effect is an individual’s response to a change in his or her income when the relative price
of consumption is held constant. Because this relative price is held constant, the slope of the
Chapter 18 Consumption and Saving 215
3. According to the substitution effect, because the higher real interest rate increases the reward for
saving in period 1, Carmencita will save more in period 1, reducing her consumption in period 1 and
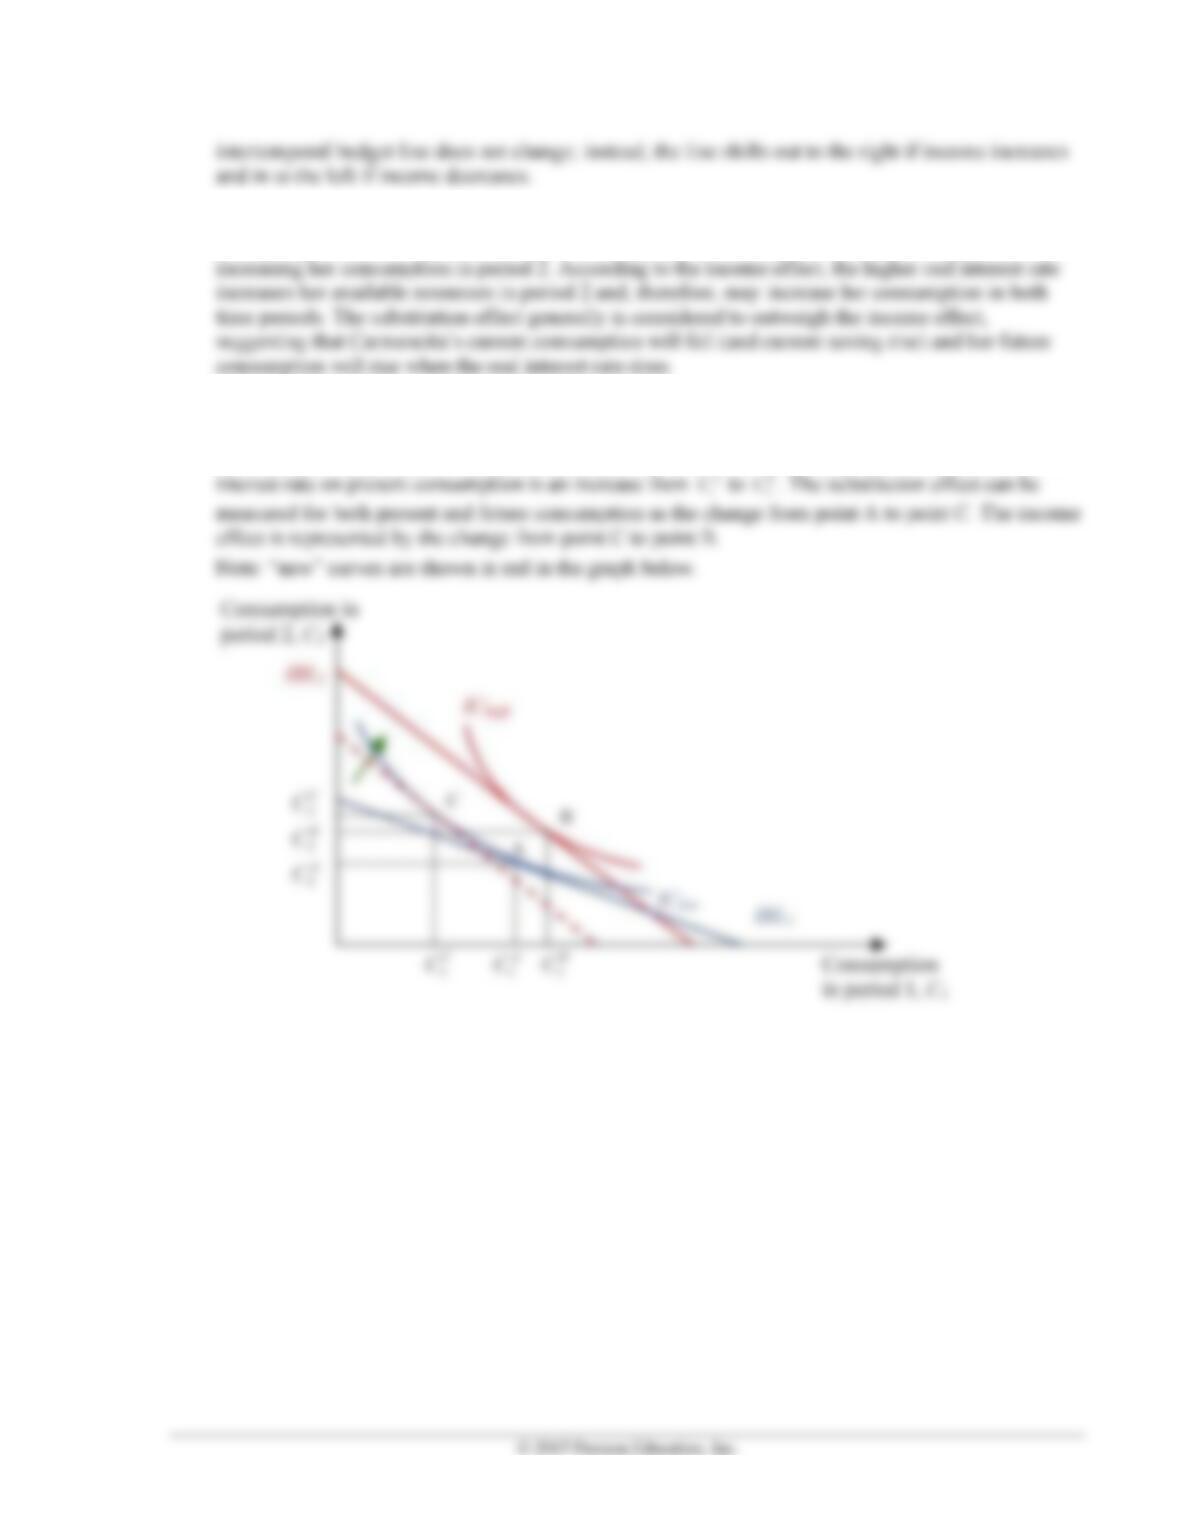
4. As shown in the graph, an increase in the interest rates shifts the intertemporal budget clockwise,
from IBL1 to IBL2 (this shifts is represented by the green arrow). In this case, the income effect is
assumed to be larger than the substitution effect, and therefore, the consequence of an increase in the
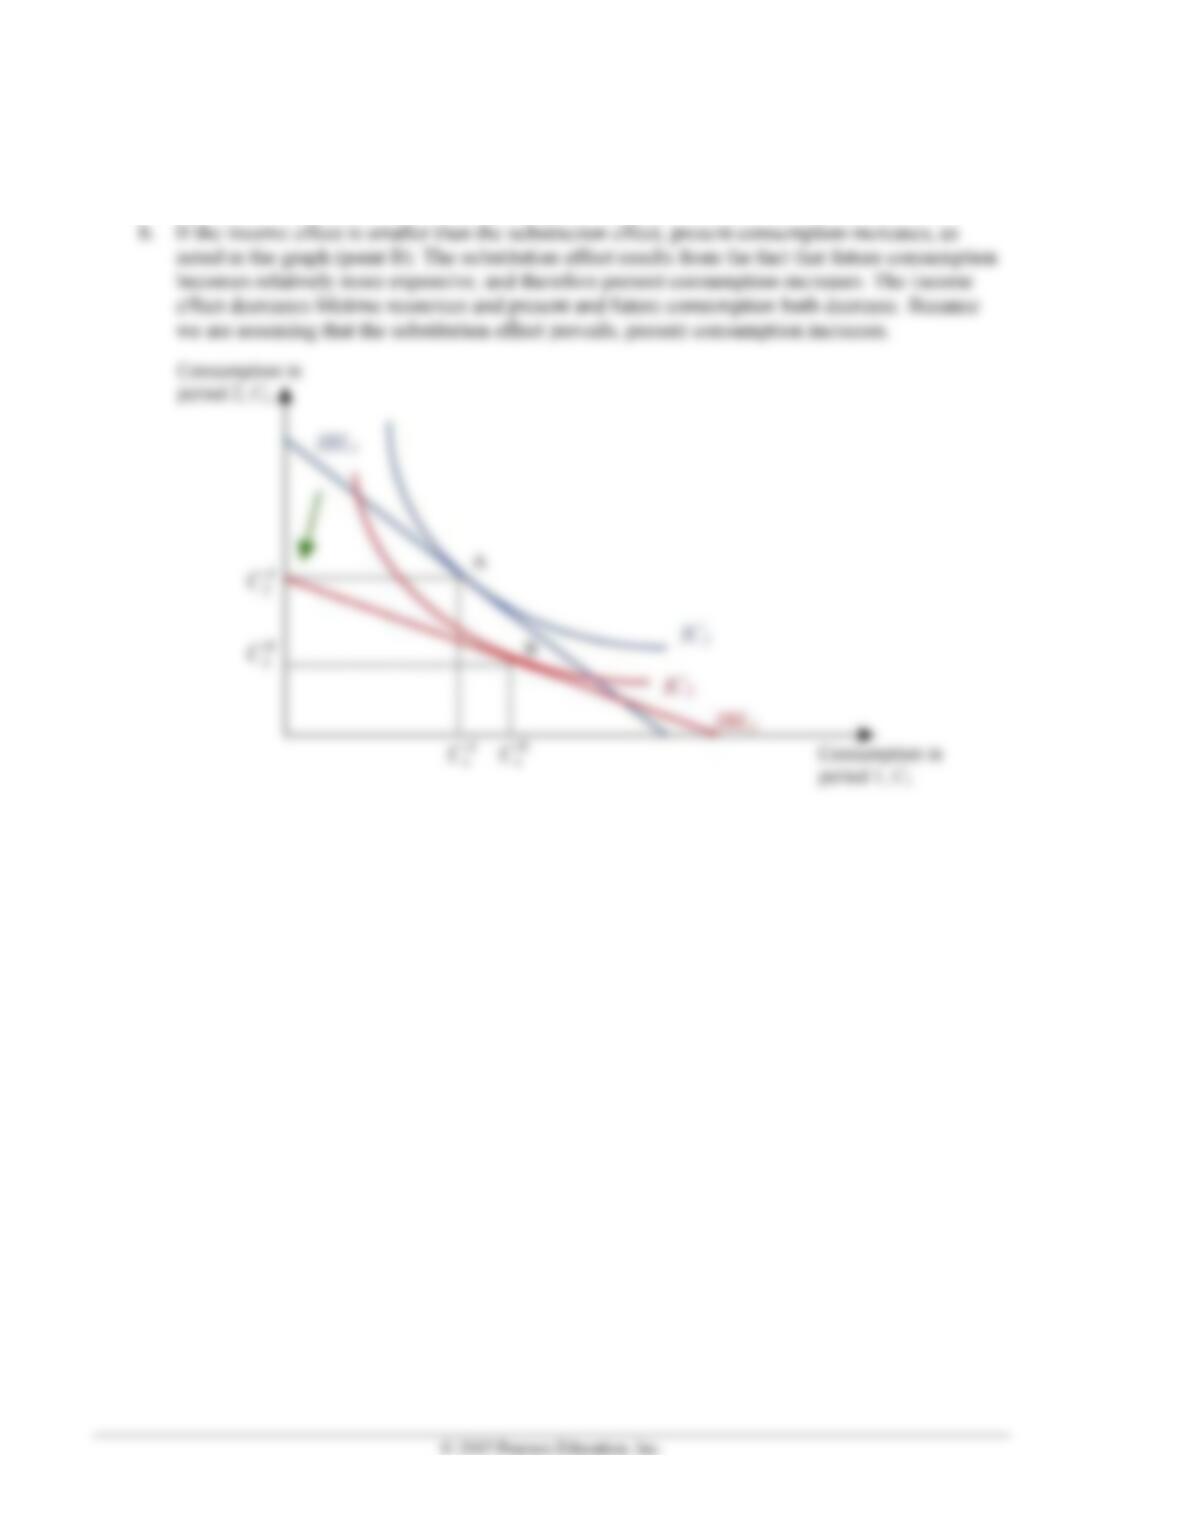
216 Mishkin • Macroeconomics: Policy and Practice, Second Edition
5. a. When the interest rate decreases, the intertemporal budget line pivots counterclockwise, from
IBL1 to IBL2. Note that both IBL lines share one point (the point at which the individual saves
nothing after period 1).
6. a. The change in the intertemporal budget line from IBL1 to IBL2 is the result of a decrease in the
interest rate, as the intertemporal budget line has a slope equal to: – (1 + r).
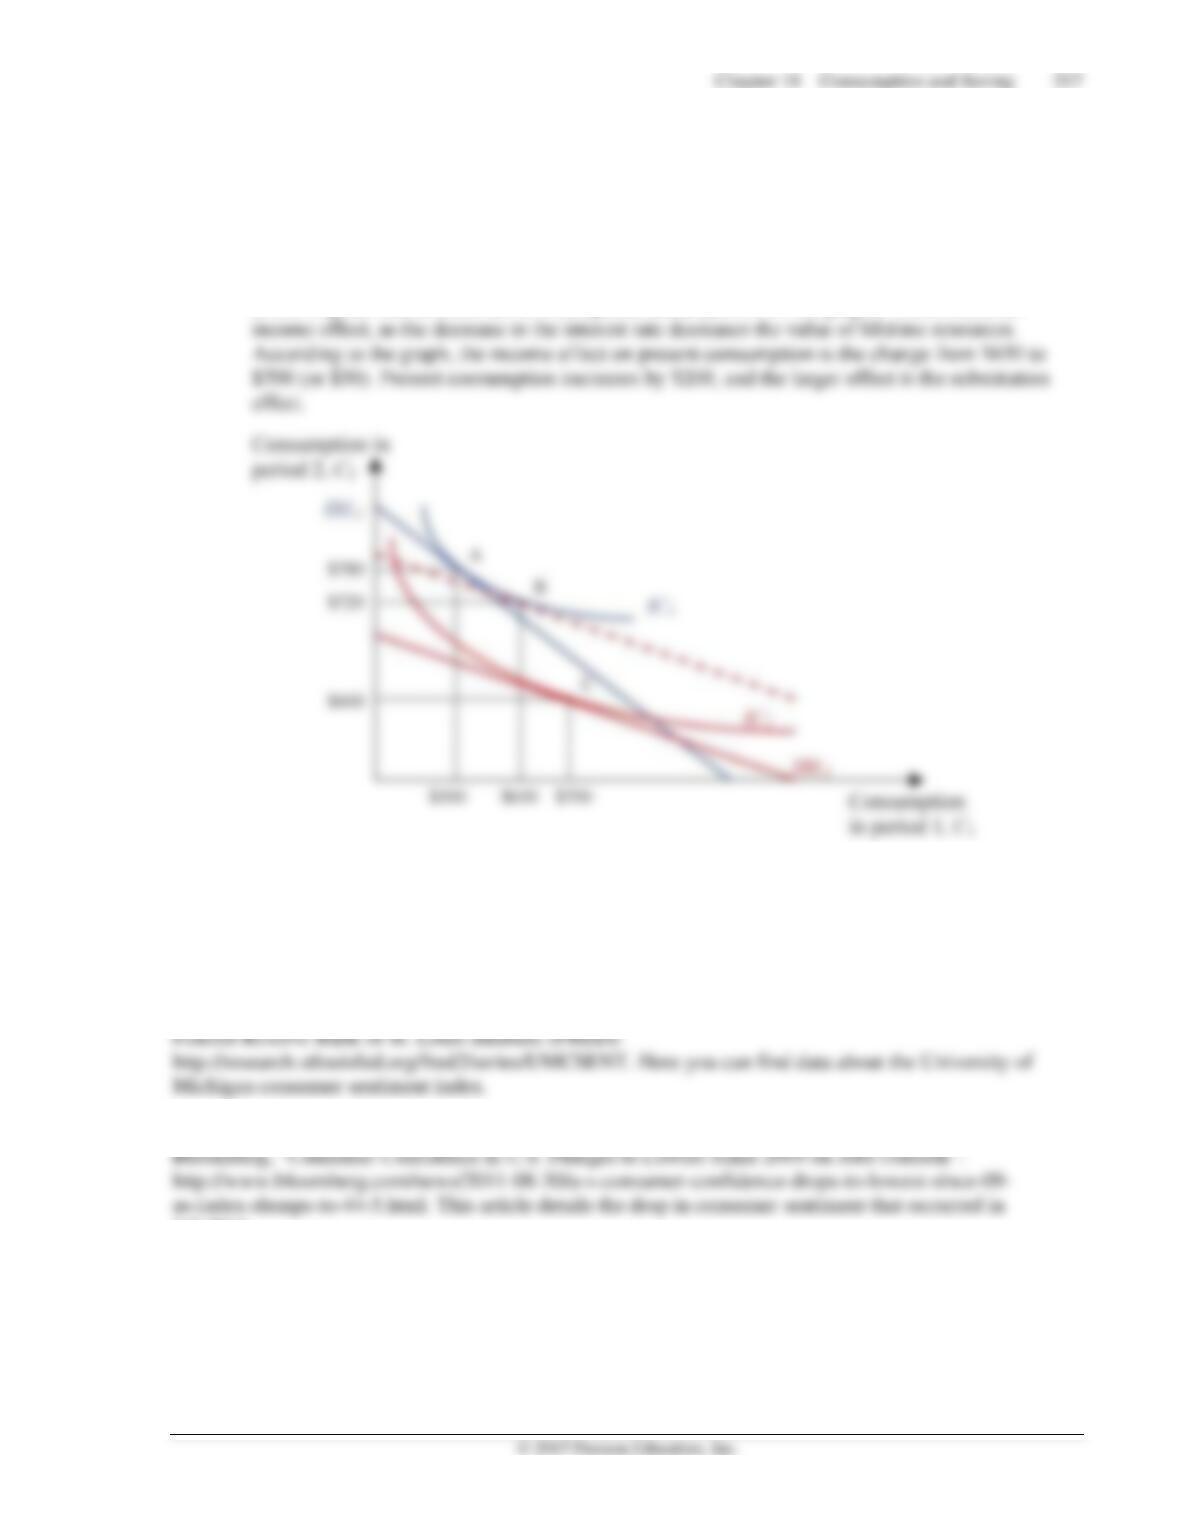
b. The substitution effect on present consumption derived from the decrease in the interest rate is
$150 (calculated as the difference between $500 and $650). The decrease in the interest rate
makes future consumption relatively more expensive, and the individual increases his or her
present consumption. This is obtained by applying the new slope of the intertemporal budget line
to the original indifference curve IC1 (represented as point B in the graph). There is also an
◼ Data Sources, Related Articles, and Discussion Questions
A. For Information About Application: Consumer Confidence and the Business
Cycle
Data Source
Related Article
fall 2011.
Discussion Question
Determine the effect on consumer confidence, and therefore on autonomous consumption, of news
that indicates a deterioration of economic conditions in the future.

218 Mishkin • Macroeconomics: Policy and Practice, Second Edition
Answer: News that pictures a gloomy future will most probably decrease consumer confidence or
B. For Information About Policy and Practice: The 2008 Tax Rebate
Data Source
Federal Reserve Bank of St. Louis database (FRED):
the personal savings rate (as a percentage of disposable income). You can edit the graph to see the values
of this variable for 2008 only, as in the Policy and Practice case.
Related Article
Discussion Question
Suppose that a tax rebate originally intended to be transitory becomes permanent (i.e., Congress keeps
extending the duration of the tax rebate). What would be the consequences on consumption according to
the permanent income hypothesis?
C. For Information About Application: Housing, the Stock Market, and the
Collapse of Consumption in 2008 and 2009
Data Source
Related Article
Mishkin, Frederic, “Housing and the Monetary Transmission Mechanism”:
of the PDF file) for a survey on the marginal propensity to consume out of wealth.
Discussion Question
Why did the decline in stock prices have a significant effect on consumer’s wealth? After all, many people
own their houses, but not many own stocks. Explain.
Answer: It is true that many people own their houses, but it also true that many people own stocks, albeit
institutions to lose a lot of money during a financial crisis. The drastic drop in stock prices meant that
Chapter 18 Consumption and Saving 219
D. For Information About Policy and Practice: Behavioral Policies to Increase
Saving
Data Source
The White House, “Helping Workers Save for a Secure Retirement”:
about the White House efforts to help workers save for retirement, as mentioned in the Policy and Practice
case.
Related Articles
Choi, James J. et al., “Defined Contribution Pensions: Plan Rules, Participant Decisions, and the Path of
behavioral economics: Employees often follow the path of least resistance (which presents the opportunity
to manipulate that path to change decisions).
Discussion Question
The idea of libertarian paternalism is the center of an intense debate. Its critics argue that precisely because
people tend to follow the path of least resistance, one can induce them to enroll in retirement plans. Do you
think the same argument can be made about primary education? Are the long-term consequences of a more
educated population and a population that saved more comparable?
Answer: Compulsory primary (and secondary in most countries) education can be understood from the