CHAPTER 17 | Inflation, Unemployment,
and Federal Reserve Policy
Brief Chapter Summary and Learning Objectives
17.1 The Discovery of the Short-Run Trade-off between Unemployment and
Inflation (pages 986–991)
17.2 The Short-Run and Long-Run Phillips Curves (pages 991–995)
17.3 Expectations of the Inflation Rate and Monetary Policy (pages 995–998)
Discuss how expectations of the inflation rate affect monetary policy.
17.4 Federal Reserve Policy from the 1970s to the Present (pages 998–1009)
Use a Phillips curve graph to show how the Federal Reserve can permanently lower the
inflation rate.
▪ The Fed uses contractionary monetary policy to reduce inflation, which pushes the
economy down a short-run Phillips curve.
Key Terms
Disinflation, p. 1000. A significant reduction in
the inflation rate.
Phillips curve, p. 986. A curve showing the
short-run relationship between the
unemployment rate and the inflation rate.
CHAPTER 17 | Inflation, Unemployment, and Federal Reserve Policy 415
Structural relationship, p. 988. A relationship
that depends on the basic behavior of consumers
and firms and that remains unchanged over long
periods.
Too-big-to-fail policy, p. 1007. A policy under
which the federal government does not allow
large financial firms to fail, for fear of damaging
the financial system.
Chapter Outline
Why Does Goodyear Worry about Monetary Policy?
In mid-2015, with the unemployment rate at 5.1 percent and the rate of inflation below the Federal
Reserve’s target of 2 percent, investors anticipated that the Fed would finally increase the target for the
17.1
The Discovery of the Short-Run Trade-off between Unemployment and
Inflation (pages 986–991)
Learning Objective: Describe the Phillips curve and the nature of the short-run trade-off
between unemployment and inflation.
Higher unemployment is usually accompanied by lower inflation, and lower unemployment is usually
A. Explaining the Phillips Curve with Aggregate Demand and Aggregate Supply
Curves
The inverse relationship between unemployment and inflation is consistent with the aggregate demand and
B. Is the Phillips Curve a Policy Menu?
Some economists argued during the 1960s that the Phillips curve represented a structural relationship in the
economy. A structural relationship is a relationship that depends on the basic behavior of consumers and
416 CHAPTER 17 | Inflation, Unemployment, and Federal Reserve Policy
C. Is the Short-Run Phillips Curve Stable?
In his 1968 presidential address to the American Economic Association, Milton Friedman argued that the
Phillips curve did not represent a permanent trade-off between unemployment and inflation. Edmund
D. The Long-Run Phillips Curve
At potential real GDP, firms operate at their normal level of capacity, and everyone who wants a job will
E. The Role of Expectations of Future Inflation
Friedman argued that the experience of the 1950s and 1960s, which showed a stable trade-off between
unemployment and inflation, actually showed only a short-run trade-off. The short-run trade-off existed
because workers and firms sometimes expected the inflation rate to be either higher or lower than it
Extra Solved Problem 17.1
The Policy Menu View of the Phillips Curve
In 1960, Paul Samuelson and Robert Solow wrote the first article using the Phillips curve model to
explain the relationship between unemployment and inflation in the United States. They concluded that:
[P]rice stability is seen to involve about 5½ percent unemployment; whereas…3 percent
Vol. 50, No. 2, May 1960, pp. 192–193.
a. What did Samuelson and Solow mean by “price stability”?
b. What does the “tug of war of politics” have to do with what happens to the unemployment and
inflation rates?
CHAPTER 17 | Inflation, Unemployment, and Federal Reserve Policy 417
Solving the Problem
Step 1: Review the chapter material.
This problem is about how the Phillips curve was understood in the 1960s, so you may want
to review the section “Is the Phillips Curve a Policy Menu?” which is on page 988 in the
textbook.
Step 2: Explain what Samuelson and Solow meant by “price stability.”
Teaching Tips
The end of the chapter in the main text includes a special category of exercises titled Real-Time Data
Exercises. These exercises help students become familiar with a key data source, learn how to locate data,
17.2
The Short-Run and Long-Run Phillips Curves (pages 991–995)
Learning Objective: Explain the relationship between the short-run and long-run Phillips
curves.
A. Shifts in the Short-Run Phillips Curve
A new, higher expected inflation rate can become embedded in the economy, meaning that workers,
B. How Does a Vertical Long-Run Phillips Curve Affect Monetary Policy?
By the 1970s, most economists accepted the argument that the long-run Phillips curve is vertical and that
the common view of the 1960s had been wrong: It was not possible to buy a permanently lower
418 CHAPTER 17 | Inflation, Unemployment, and Federal Reserve Policy
17.3
Expectations of the Inflation Rate and Monetary Policy (pages 995–998)
Learning Objective: Discuss how expectations of the inflation rate affect monetary
policy.
The experience of the last 60 years indicates that how workers and firms adjust to their expectations of
inflation depends on how high the inflation rate is. There are three possibilities:
1. Low inflation. When the inflation rate is low, workers and firms tend to ignore it.
A. The Implications of Rational Expectations for Monetary Policy
Robert Lucas of the University of Chicago and Thomas Sargent of New York University pointed out an
important consequence of rational expectations: An expansionary monetary policy would not work, and
there might not be a trade-off between unemployment and inflation, even in the short run. By the mid–
B. Is the Short-Run Phillips Curve Really Vertical?
The claim by Lucas and Sargent that the short-run Phillips curve is vertical and that an expansionary
monetary policy cannot reduce the unemployment rate below the natural rate surprised many economists.
The experience of the 1950s and 1960s seemed to show that the short-run Phillips curve was downward
C. Real Business Cycle Models
During the 1980s, some economists argued that Lucas was correct in assuming that workers and firms
formed their expectations rationally and that wages and prices adjust quickly but that Lucas was wrong in
CHAPTER 17 | Inflation, Unemployment, and Federal Reserve Policy 419
Extra Solved Problem 17.3
Stagflation and the Short-run Phillips Curve
Stagflation is the simultaneous increase in inflation and unemployment (or an increase in inflation and
slower economic growth). Given the negative slope of the short-run Phillips curve, how is it possible for
the inflation rate and the unemployment rate to increase at the same time?
Solving the Problem
Step 1: Review the chapter material.
This problem is about the role that changing expectations play in shifting the position of the
Step 2: Illustrate the change in the inflation rate and the unemployment rate along a short–
run Phillips curve.
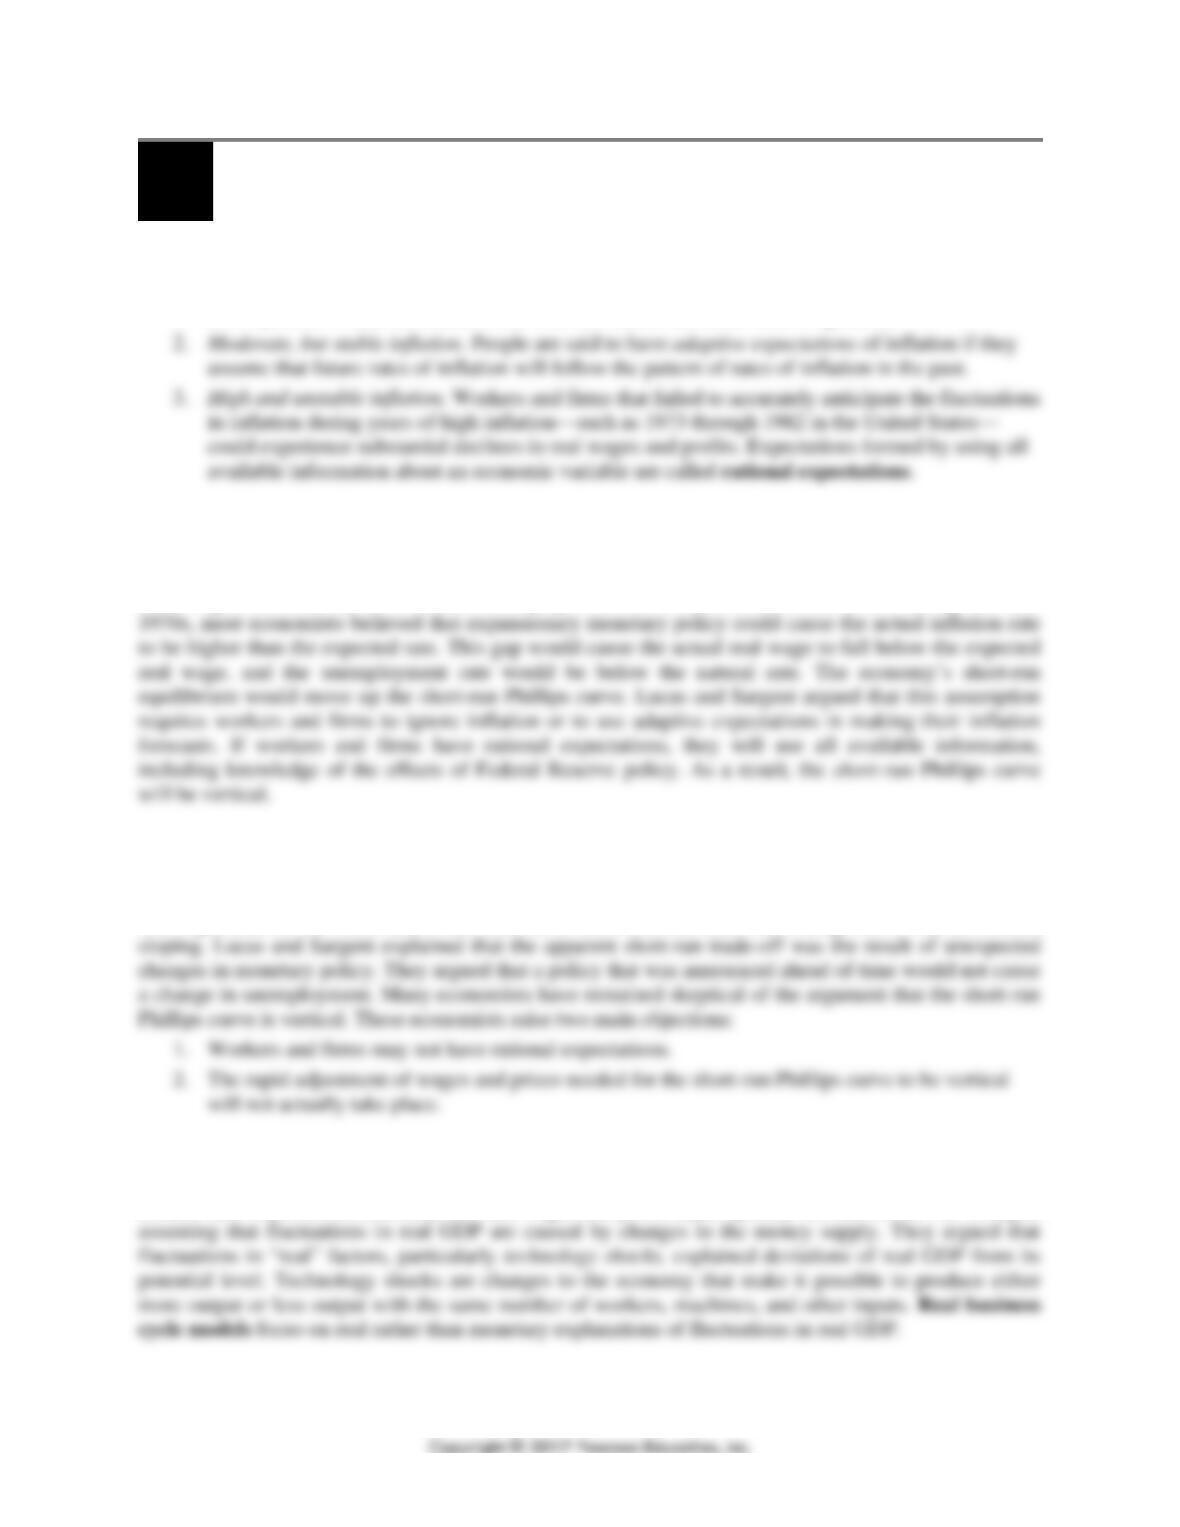
The short-run Phillips curve shows the short-run trade-off between inflation and
unemployment. On any particular short-run Phillips curve, an increase in inflation will be
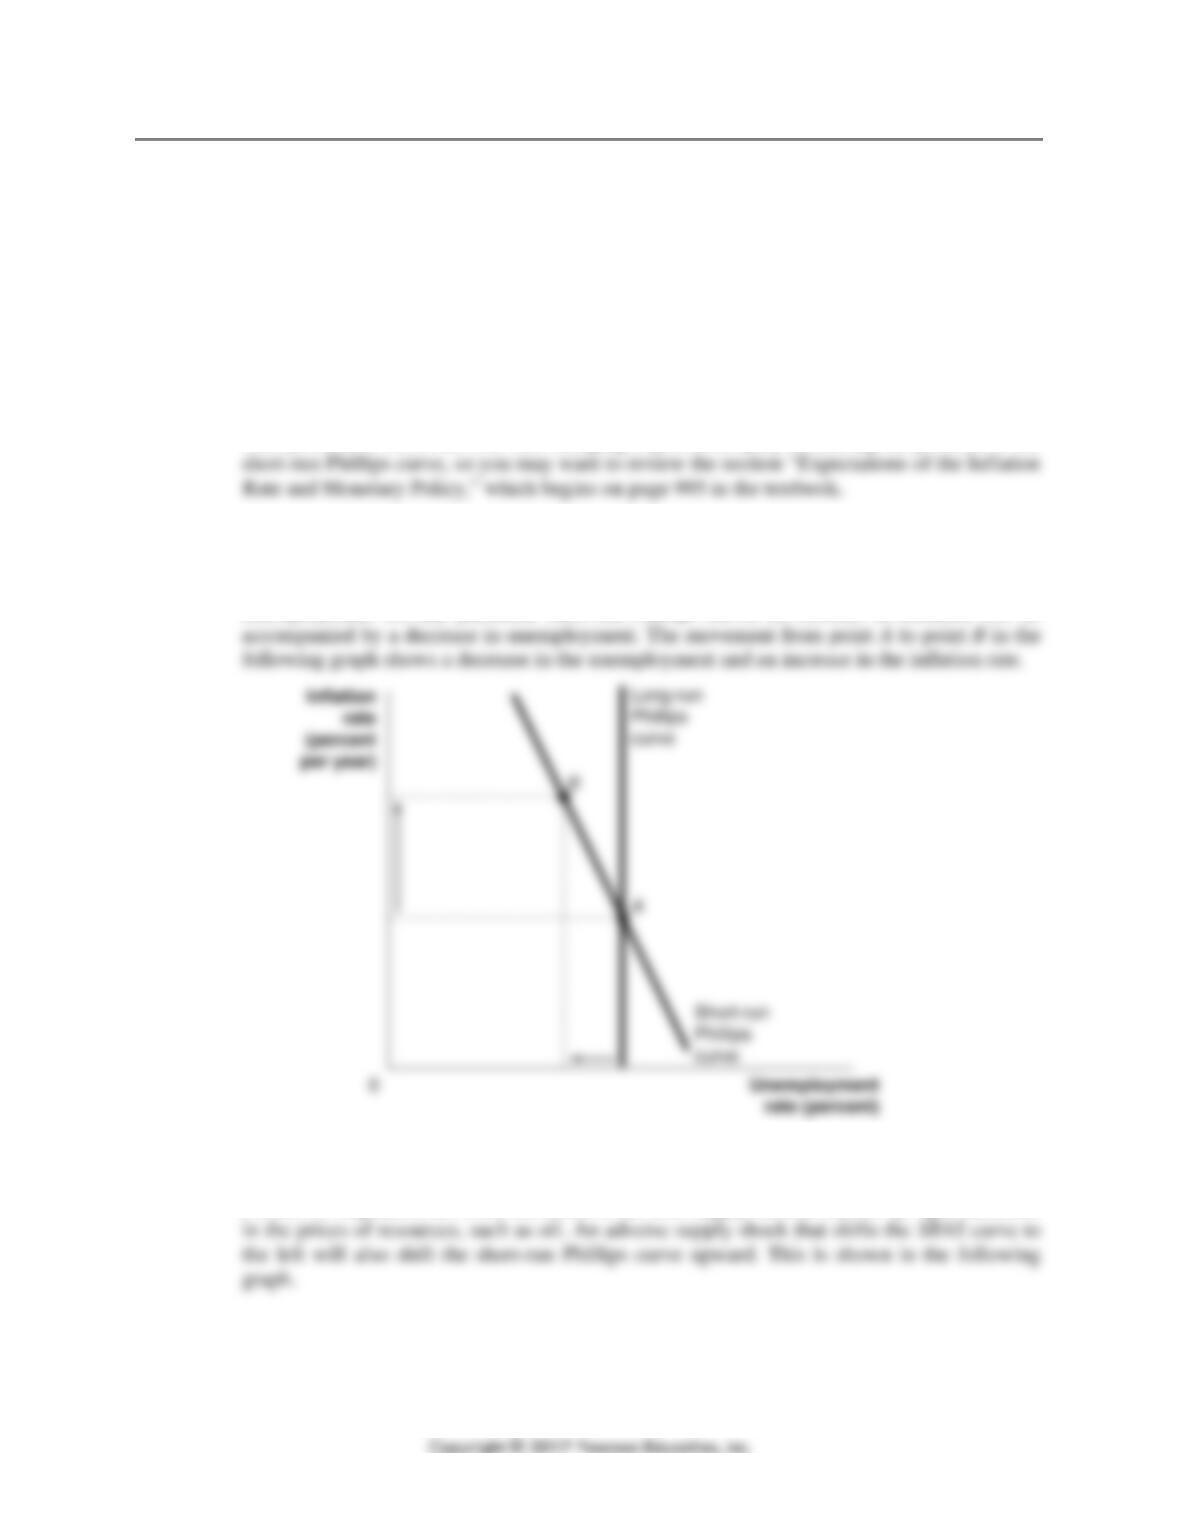
Step 3: Illustrate how an adverse supply shock can cause both the unemployment rate
and the inflation rate to increase.
Periods of stagflation are often the result of adverse supply shocks, caused by rapid increases
420 CHAPTER 17 | Inflation, Unemployment, and Federal Reserve Policy
Extra Making
the
Connection
Does the Federal Reserve Need a New Model of the Economy?
The Great Depression and the period of “stagflation” in the 1970s led economists to develop new models
to deal with these crises. These models influenced how policymakers would respond to future crises. The
models developed to address stagflation were based on rational expectations. Consistent with the theory
of rational expectations is the idea that markets are efficient. That is, the price of any financial security is
based on all relevant information. Another financial crisis led to the recession of 2007–2009 and tested
CHAPTER 17 | Inflation, Unemployment, and Federal Reserve Policy 421
Professor Geanakoplos believes that his theory has important implications for the Federal Reserve, which
currently uses interest rates as its monetary policy target. Could something else—lenders’ collateral or
margin demands—be even more important than interest rates? The challenge for Geanakoplos and other
17.4
Federal Reserve Policy from the 1970s to the Present (pages 998–1009)
Learning Objective: Use a Phillips curve graph to show how the Federal Reserve can
permanently lower the inflation rate.
A. The Effect of a Supply Shock on the Phillips Curve
Following actions by the Organization of Petroleum Exporting Countries (OPEC), oil prices rose in 1974,
which caused the short-run aggregate supply curve to shift to the left. The result was a higher price level
B. Paul Volcker and Disinflation
By the late 1970s, the Federal Reserve had gone through a two-decade period of increasing the rate of
growth of the money supply. In August 1979, President Carter appointed Paul Volcker as chairman of the
Board of Governors of the Federal Reserve System. Volcker was convinced that high inflations rates were
damaging the economy. Volcker began reducing the growth rate of the money supply. Interest rates rose,
C. Alan Greenspan, Ben Bernanke, Janet Yellen, and the Crisis in Monetary Policy
In 1987, President Ronald Reagan appointed Alan Greenspan to succeed Paul Volcker as Fed chairman.
Greenspan served in this position for 18 years. Ben Bernanke was appointed chairman in 2006. In 2013,
Janet Yellen succeeded Bernanke. Greenspan, Bernanke, and Yellen shared Volcker’s determination to
422 CHAPTER 17 | Inflation, Unemployment, and Federal Reserve Policy
keep the inflation rate low. Under Greenspan’s leadership, inflation was reduced nearly to the levels
reached in the 1950s and 1960s. When Greenspan left office in 2006 he was widely applauded for his
leadership. However, the severity of the recession of 2007–2009 led some critics to question whether
decisions made during Greenspan’s leadership might have played a role in bringing on the crisis. There
were two other developments in monetary policy over the past 20 years:
De-emphasizing the money supply. Before 1987, the Fed would announce annual targets for how
much M1 and M2 would increase during the year. In February 1987, near the end of Paul
Two actions by the Fed during Greenspan’s term have been identified as possibly contributing to the
financial crisis that lengthened the recession of 2007–2009.
The first action was the decision during 1998 to help save the hedge fund Long Term Capital Management
(LTCM). In 1998, LTCM suffered heavy losses. Other financial firms that lent to LTCM feared that the firm
would go bankrupt and pushed for repayment of their loans. If LTCM had been forced to sell all of its
D. The Debate over the Fed’s Future
The financial crisis of 2007–2009 led the Fed to move beyond the federal funds rate as the focus of
monetary policy. Traditionally, the Fed made discount loans only to commercial banks, but under Section
CHAPTER 17 | Inflation, Unemployment, and Federal Reserve Policy 423
During the crisis, the Fed took action to save Bear Stearns and AIG under what is called the too-big-to–
fail policy: a policy under which the federal government does not allow financial firms to fail, for fear of
damaging the financial system. Some economists believe that this policy increases moral hazard.
Provisions of the Dodd-Frank Act make it more difficult for the Fed to use a too-big-to-fail policy.
However, some economists are critical of these restrictions on the Fed’s ability to lend freely in a crisis.
In 2015, there were several proposals in Congress that were designed to change the Fed’s operations or
structure, including:
• Require the Fed to adopt a formal policy rule.
Extra Making
the
Connection
Paul Volcker and the Fed’s Fight for Independence
In his brief history of the Federal Reserve System, Tim Todd, an economist with the Federal Reserve
Bank of Kansas City, describes the withering criticism leveled at Paul Volcker during his term as
chairman of the Federal Reserve Board between 1979 and 1987. Volcker began his term when the U.S.
economy suffered from double-digit inflation. He immediately announced that the Fed would begin
424 CHAPTER 17 | Inflation, Unemployment, and Federal Reserve Policy
Todd described the invective directed at Volcker and the Fed by Members of Congress between 1981 and
1982.
‘We are destroying the small business man…We are destroying the American dream,’
conservative Congressman George Hansen said…Democrat Frank Annunzio shouted and
pounded his desk, accusing the Fed of favoring big business, and…Henry Gonzales threatened to
However, not all of the comments regarding Volcker were negative. One Wall Street trader told the
New York Times:
Interference with the central bank would be taken very poorly in the investment community…
Paul Volcker…has become the whipping boy for high interest rates and the administration is
Extra Making
the
Connection
The Debate over Quantitative Easing
The decision by Fed Chairman Ben Bernanke and the FOMC to engage in a policy of quantitative easing
(QE) beginning in November 2008 caused extended debate among economists and policymakers. Under
the QE policy, the Fed purchased long-term Treasury securities and mortgage-backed securities to reduce
CHAPTER 17 | Inflation, Unemployment, and Federal Reserve Policy 425
1. A prolonged period of low interest rates could lead to speculative bubbles. Some economists
argued that as interest rates fell and prices of long-term Treasury bonds rose, financial markets
2. A prolonged period of low-interest rates could lead to excessive risk taking. Treasury securities
are a relatively safe investment. When interest rates on these securities dropped to low levels,
3. Low interest rates reduce the return to saving and hurt the incomes of retired people. As we have
seen, high rates of saving can contribute to long-run growth. One key reason people save is to
4. Quantitative easing deviates from rules-based monetary policy. Prior to the financial crisis, Fed
policy focused on the target for the federal funds rate. The target the Fed chose was usually
consistent with the Taylor rule (see Chapter 15). This approach was generally successful in
allowing the Fed to achieve its dual mandate of high employment and price stability. In 2015, the
Fed was still keeping the target for the federal funds rate below the rate indicated by the Taylor
Question
In an opinion column in the Wall Street Journal, Martin Feldstein of Harvard University argued with
respect to quantitative easing that, “low interest rates are generating excessive risk-taking by banks and
other financial investors.” He also warned that the risks could have serious negative effects on the value
of pension funds.
a. What is quantitative easing?
b. Why might quantitative easing have led investors, banks, and pension funds to engage in
excessive risk taking?
c. Why might this risk reduce the value of pension funds?
Source: Martin Feldstein, “The Fed Should Start to Taper Now,” Wall Street Journal, July 1, 2013.