550 Chapter 17
C. Should the company have relatively abundant capital resources, or at least $5,000,000
P17.6 NPV and PI. Louisiana Drilling and Exploration, Inc. (LD&E) has the funds necessary
to complete one of two risky oil and gas drilling projects. The first, Permian Basin 1,
involves the recovery of a well that was plugged and abandoned five years ago but that
may now be profitable, given improved recovery techniques. The second, Permian
Basin 2, is a new onshore exploratory well that appears to be especially promising.
Based on a detailed analysis by its technical staff, LD&E projects a ten-year life for
each well with annual net cash flows as follows:
Project
Probability
Annual Cash Flow
Permian Basin 1
0.08
0.84
0.08
$500,000
1,000,000
1,500,000
Capital Budgeting 551
projects involve land acquisition, as well as surface preparation and subsurface drilling
costs of $3 million each.
A. Calculate the expected value, standard deviation, and coefficient of variation for
annual net operating revenues from each well.
B. Calculate and evaluate the NPV for each project using the risk-adjusted discount
rate method.
C. Calculate and evaluate the PI for each project.
P17.6 SOLUTION
A. Permian Basin #1
Permian Basin #2
552 Chapter 17
B. Permian Basin #1
Permian Basin #2
C. Permian Basin #1
Permian Basin #2

Capital Budgeting 553
P17.7 Investment Project Choice. Toby Amberville’s Manhattan Café, Inc., is considering
investment in two alternative capital budgeting projects. Project A is an investment of
$75,000 to replace working but obsolete refrigeration equipment. Project B is an
investment of $150,000 to expand dining room facilities. Relevant cash flow data for the
two projects over their expected two-year lives are:
Project A
Year 1
Year 2
Probability
Cash Flow
Probability
Cash Flow
0.18
$0
0.08
$0
0.64
50,000
0.84
50,000
0.18
100,000
0.08
100,000
Project B
Year 1
Year 2
Probability
Cash Flow
Probability
Cash Flow
0.50
$0
0.125
$0
0.50
200,000
0.75
100,000
0.125
200,000
A. Calculate the expected value, standard deviation, and coefficient of variation for
cash flows from each project.
D. Calculate the IRR for each project, and rank the projects according to the IRR
criterion.
554 Chapter 17
E. Compare your answers to parts B, C, and D, and discuss any differences.
P17.7 SOLUTION
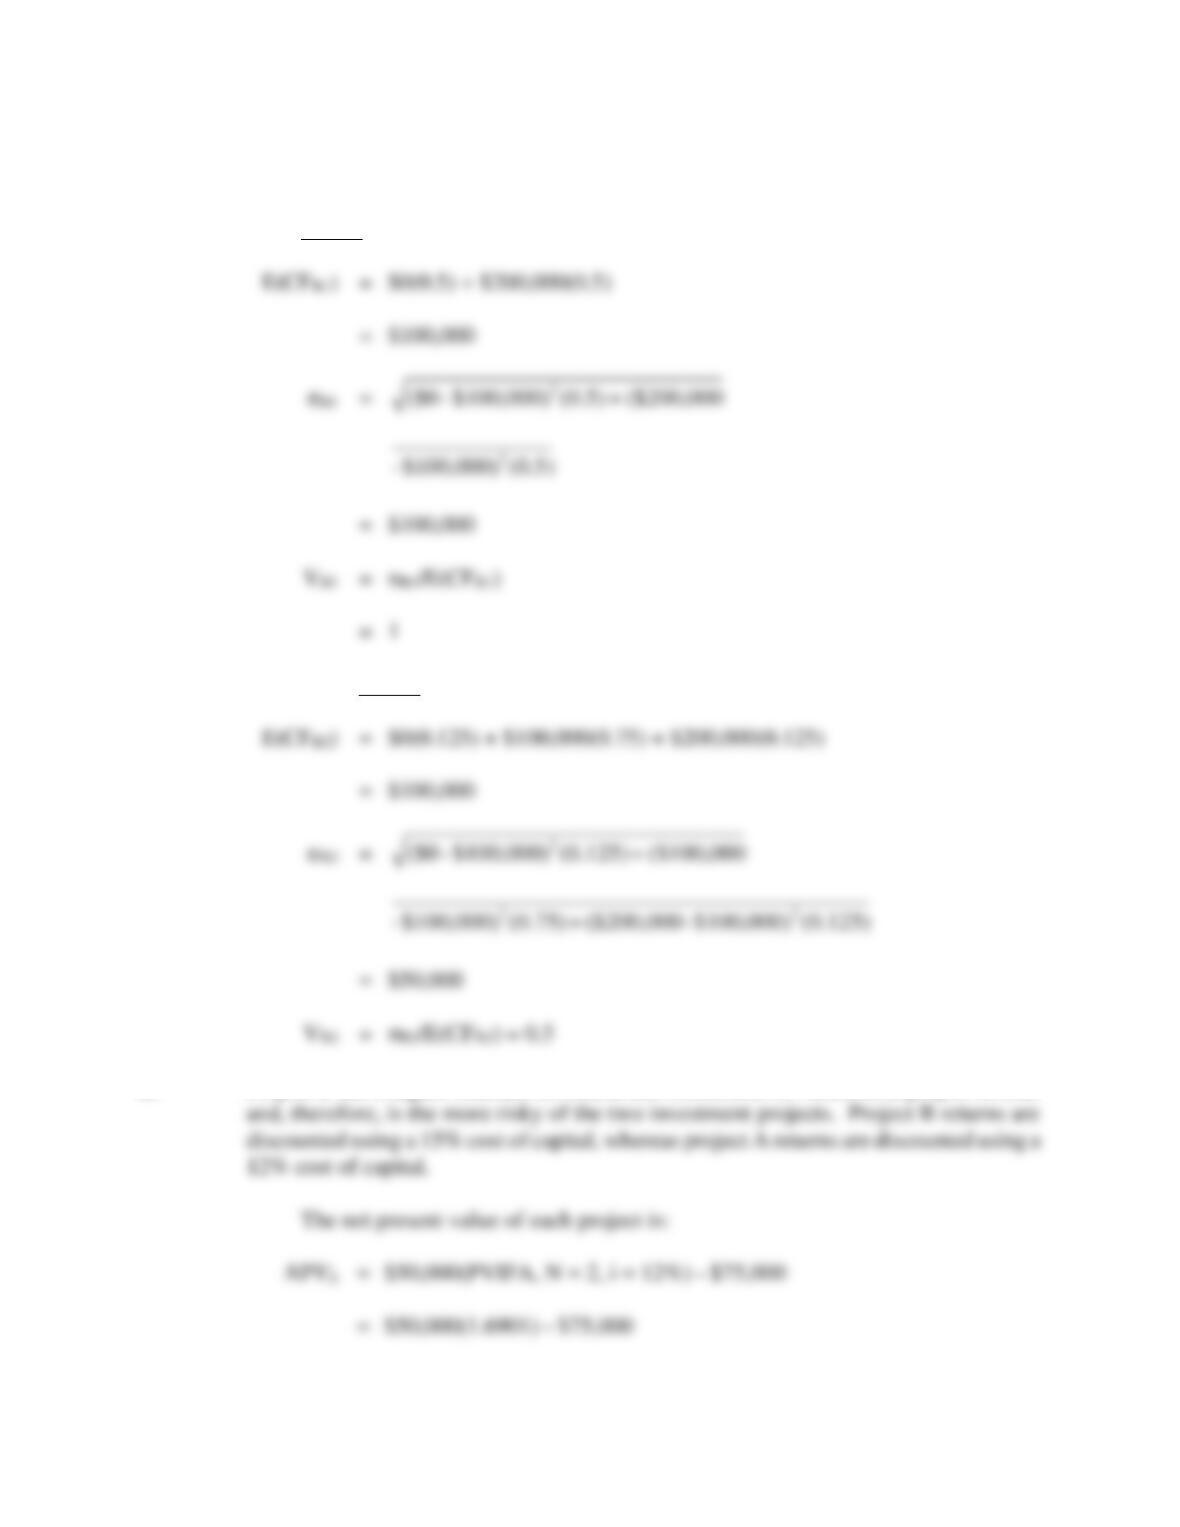
A. Project A
Year 1:
Year 2:
Project B
Capital Budgeting 555
Year 1:
Year 2:
B. Project B has a higher standard deviation and coefficient of variation in project returns
556 Chapter 17
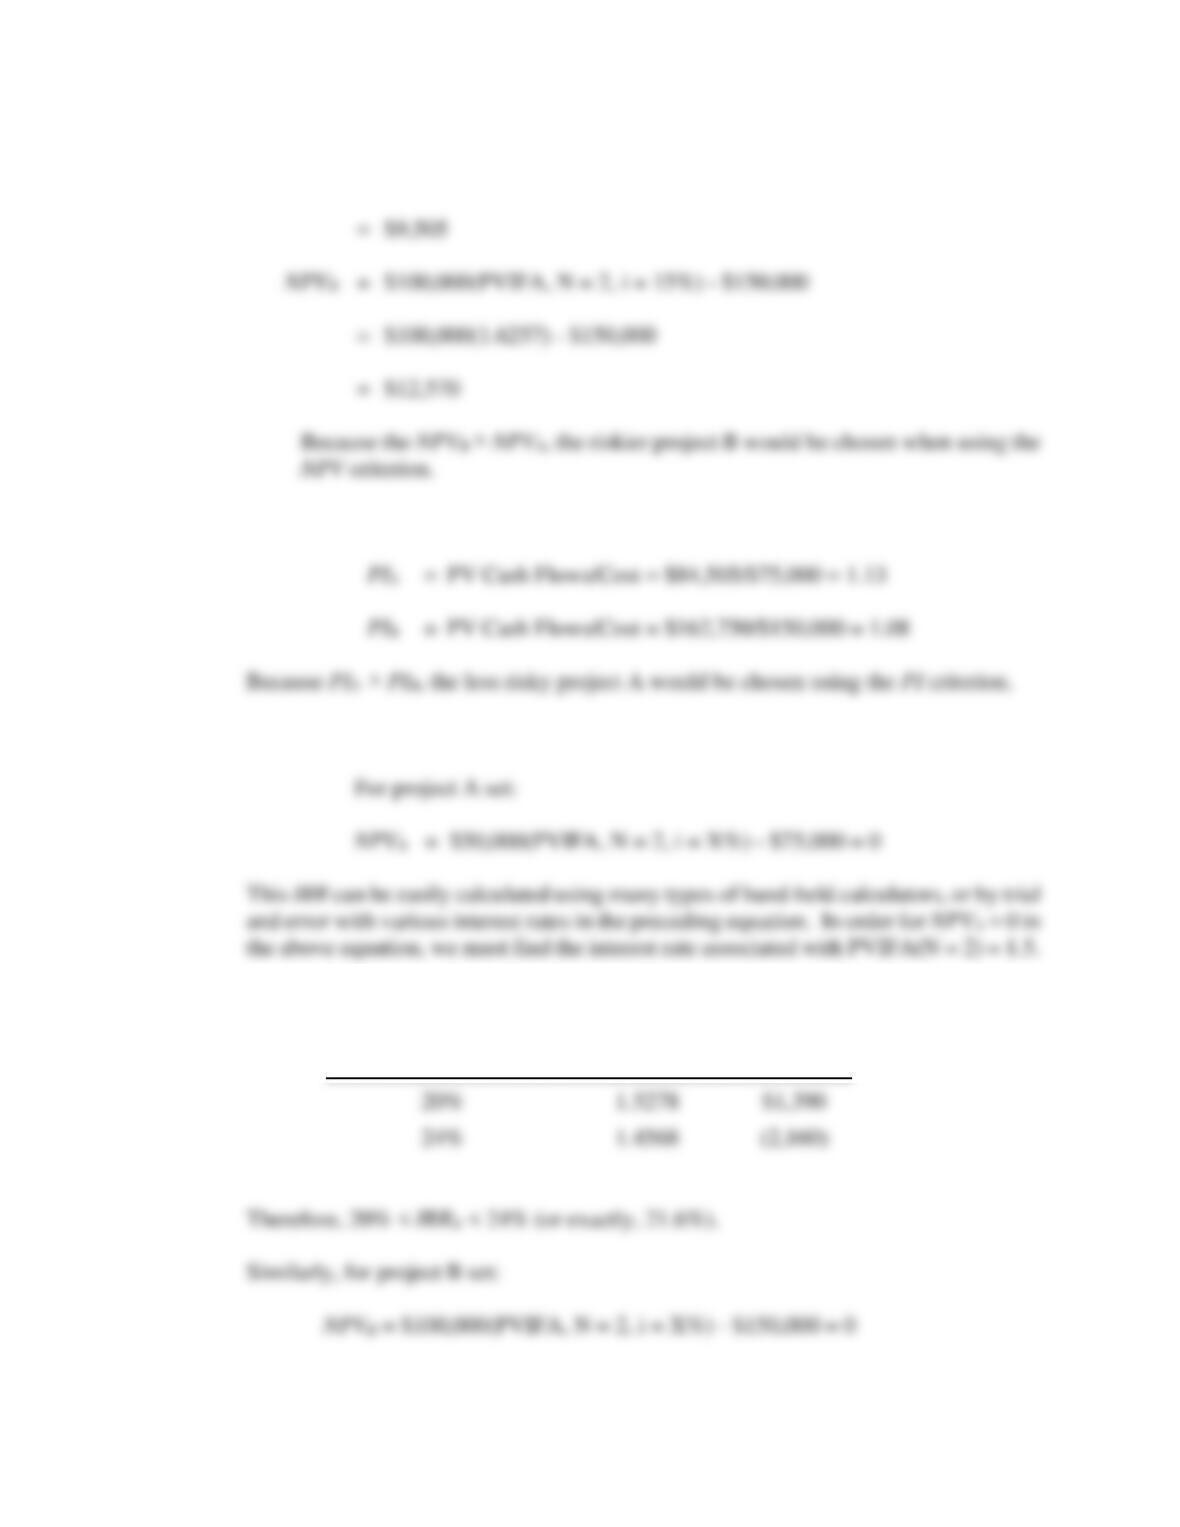
C. The profitability index for each project is:
D. The IRR is the interest rate that produces an NPV equal to zero.
Using the appendix in the back of the book, we find:
INTEREST RATE
PVIFA(N = 2)
NPVA
Capital Budgeting 557
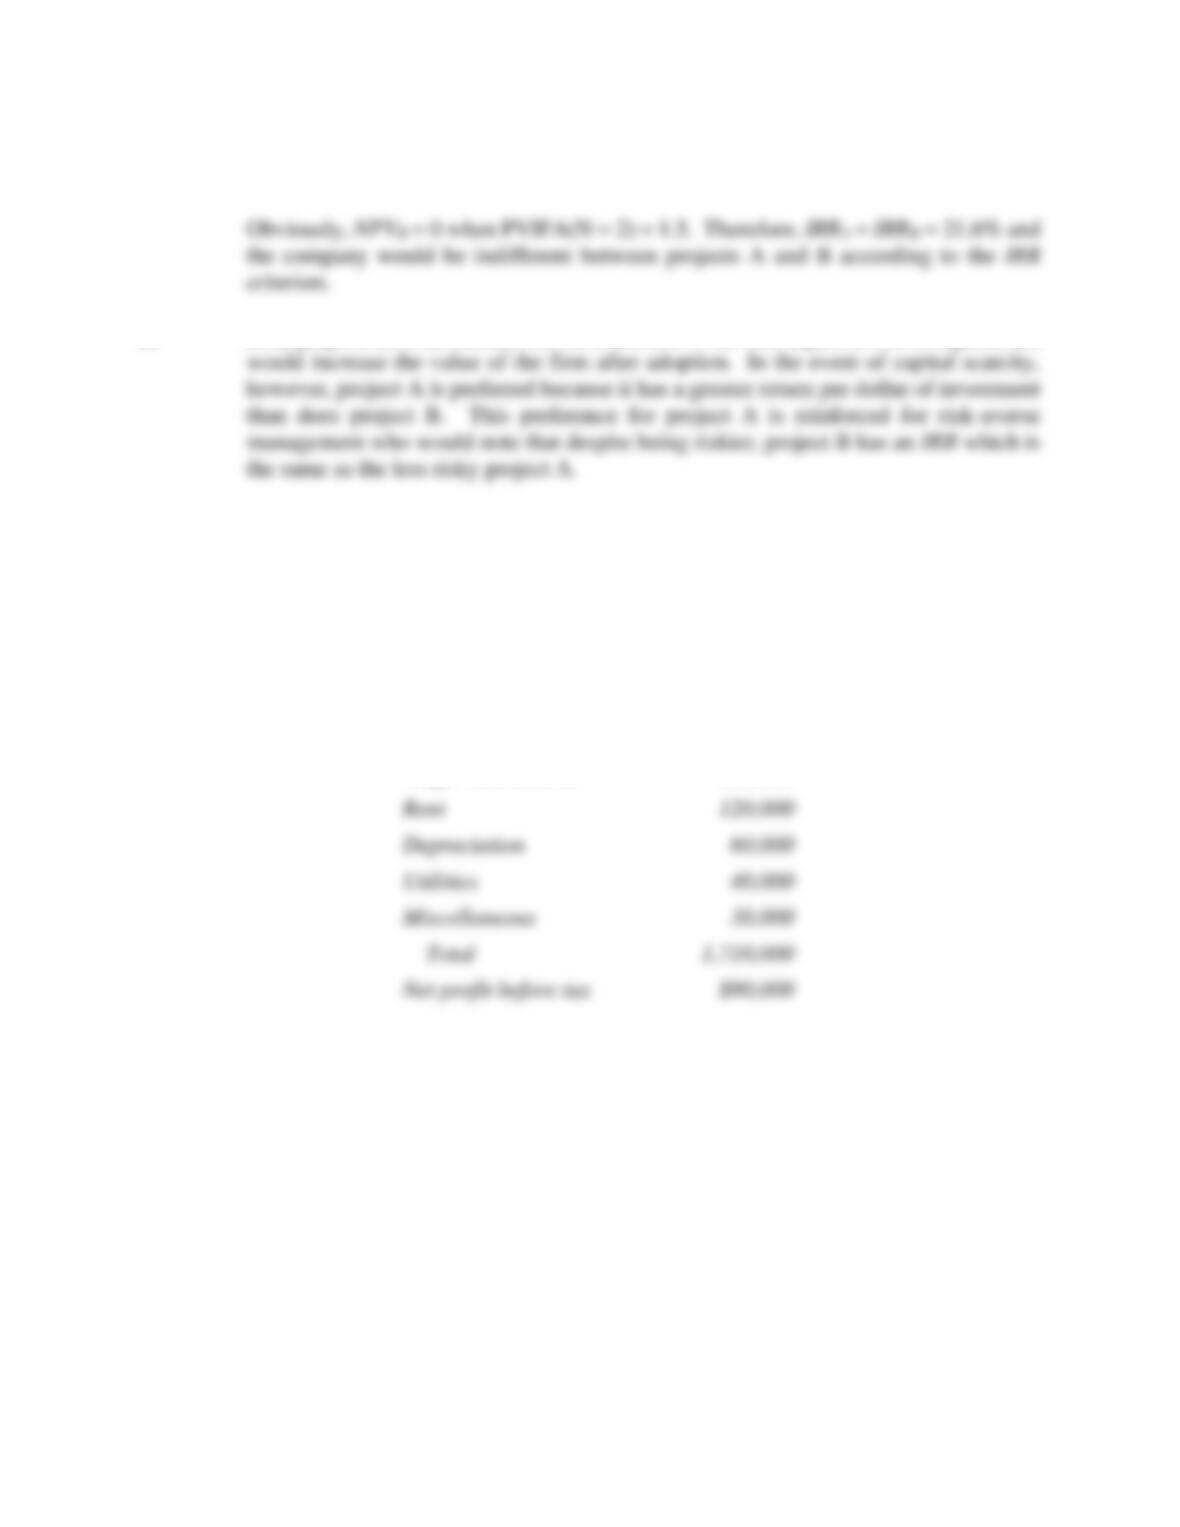
E. Both projects have an internal rate of return above the risk-adjusted cost of capital, and
P17.8 Cash Flow Estimation. Cunningham’s Drug Store, a medium-size drugstore located in
Milwaukee, Wisconsin, is owned and operated by Richard Cunningham. Cunningham’s
sells pharmaceuticals, cosmetics, toiletries, magazines, and various novelties.
Cunningham’s most recent annual net income statement is as follows:
Sales revenue
$1,800,000
Total costs
Cost of goods sold
$1,260,000
Wages and salaries
200,000
Depreciation
Utilities
Miscellaneous
Total
Net profit before tax
$90,000
Cunningham’s sales and expenses have remained relatively constant over the past
few years and are expected to continue unchanged in the near future. To increase sales,
Cunningham is considering using some floor space for a small soda fountain.
Cunningham would operate the soda fountain for an initial three-year period and then
would reevaluate its profitability. The soda fountain would require an incremental
investment of $20,000 to lease furniture, equipment, utensils, and so on. This is the only
capital investment required during the three-year period. At the end of that time,
additional capital would be required to continue operating the soda fountain, and no
capital would be recovered if it were shut down. The soda fountain is expected to have
annual sales of $100,000 and food and materials expenses of $20,000 per year. The
soda fountain is also expected to increase wage and salary expenses by 8% and utility
expenses by 5%. Because the soda fountain will reduce the floor space available for
558 Chapter 17
display of other merchandise, sales of other fountain items are expected to decline by
10%.
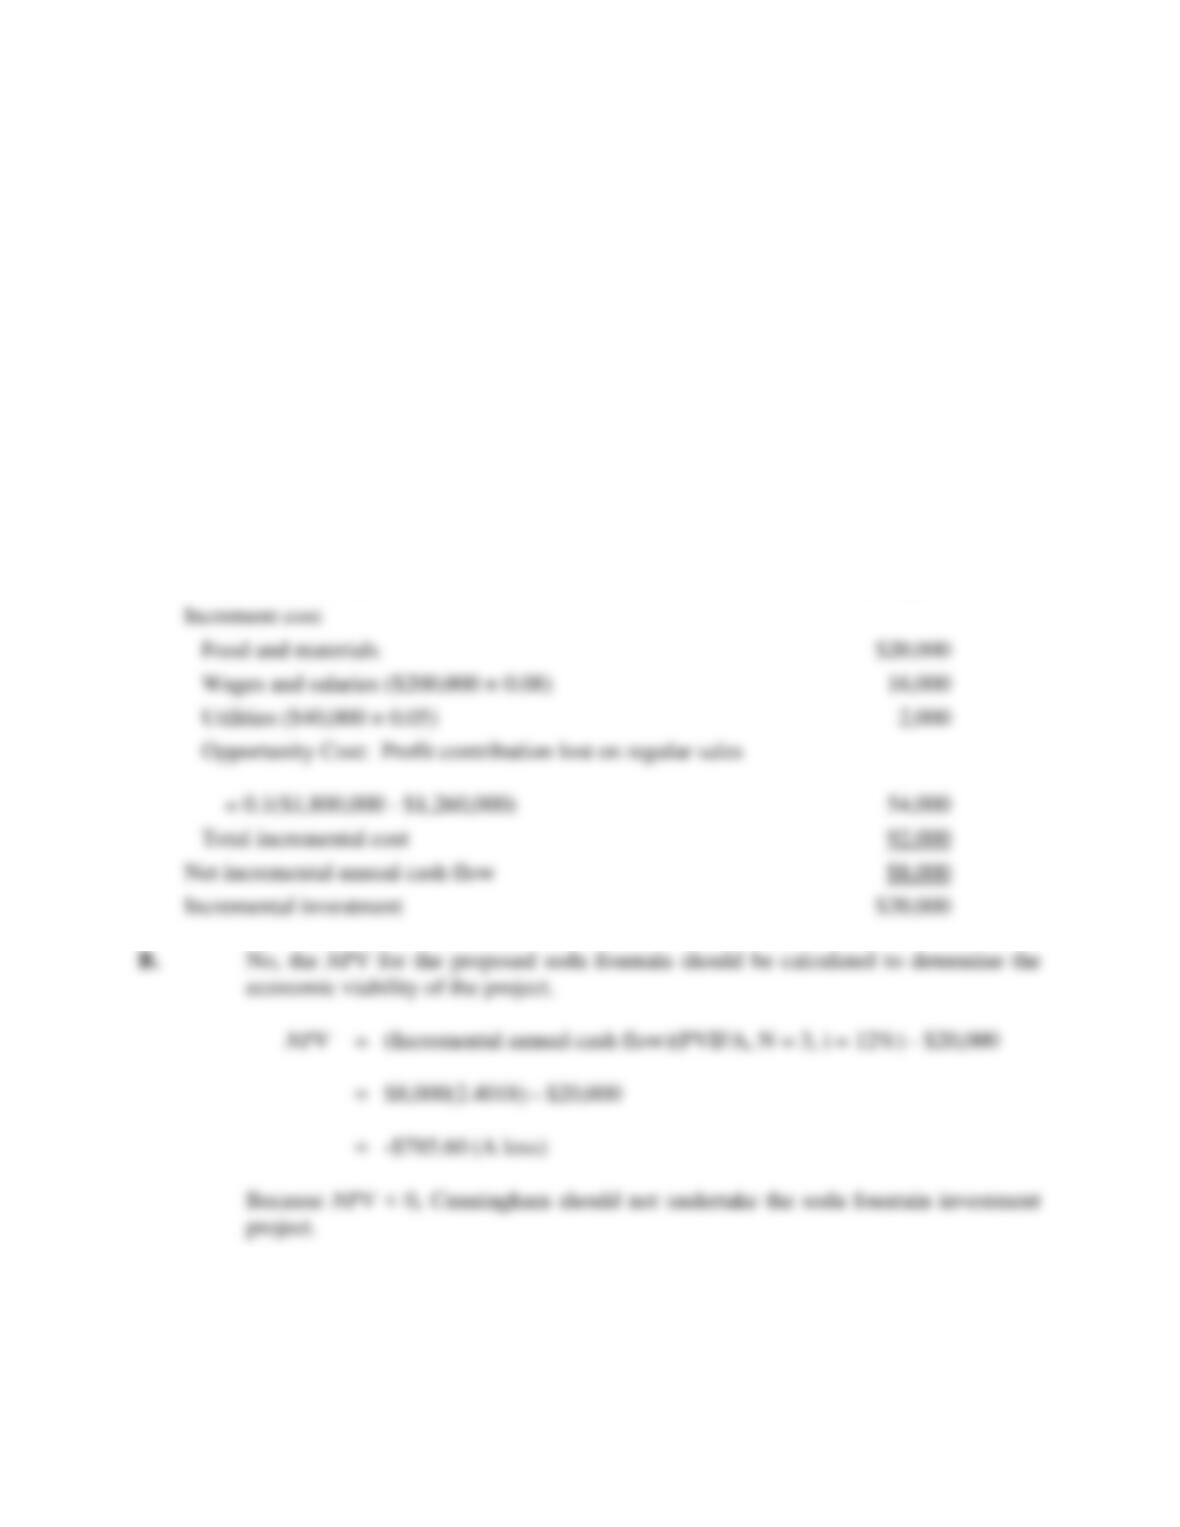
A. Calculate net incremental cash flows for the soda fountain.
B. Assume that Cunningham has the capital necessary to install the soda fountain
and that he places a 12% opportunity cost on those funds. Should the soda
fountain be installed? Why or why not?
P17.8 SOLUTION
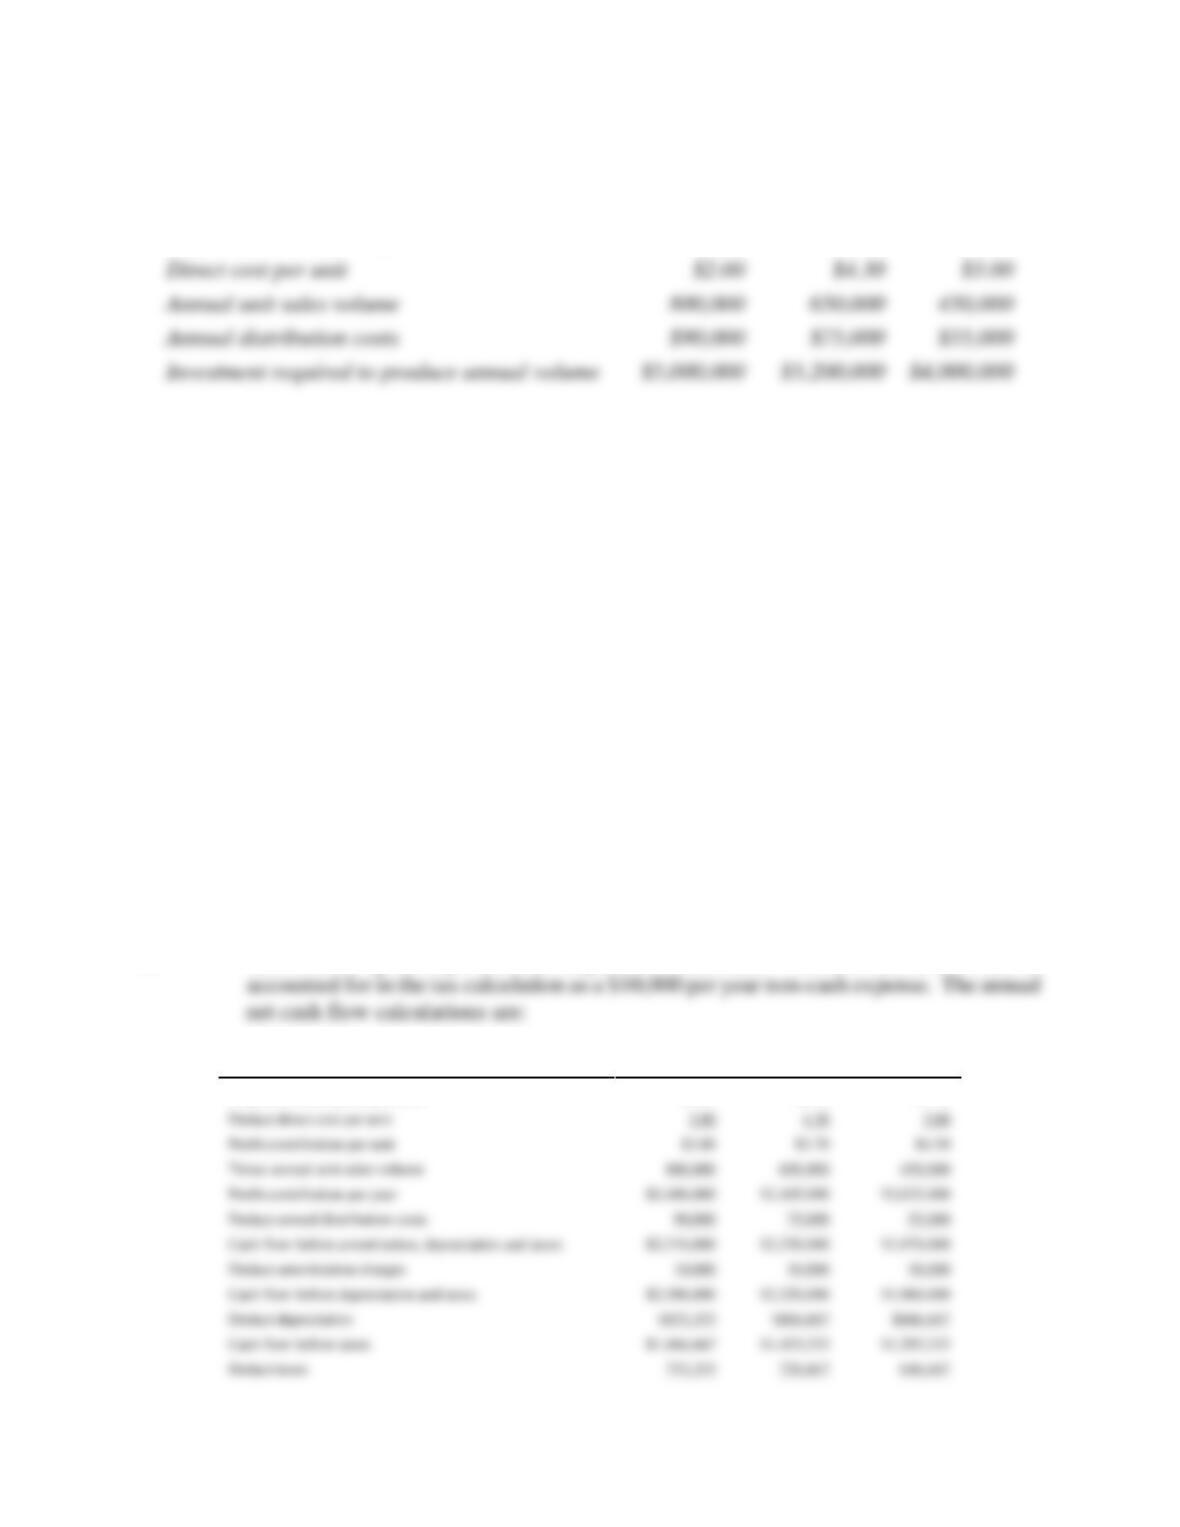
A. The relevant annual cash flows from the proposed soda fountain are:
Incremental revenue
$100,000
P17.9 Cash Flow Analysis. Dunder-Mifflin, Inc., is analyzing the potential profitability of
three printing jobs put up for bid by the State Department of Revenue:
Job A
Job B
Job C
Increment cost
Utilities ($40,000 × 0.05)
Total incremental cost
Net incremental annual cash flow
Incremental investment
Capital Budgeting 559
Projected winning bid (per unit)
$5.00
$8.00
$7.50
Assume that (1) the company’s marginal city-plus-state-plus-federal tax rate is 50%;
(2) each job is expected to have a six-year life; (3) the firm uses straight-line
depreciation; (4) the average cost of capital is 14%; (5) the jobs have the same risk as
the firm’s other business; and (6) the company has already spent $60,000 on developing
the preceding data. This $60,000 has been capitalized and will be amortized over the
life of the project.
A. What is the expected net cash flow each year? (Hint: Cash flow equals net profit
after taxes plus depreciation and amortization charges.)
B. What is the net present value of each project? On which project, if any, should the
company bid?
C. Suppose that Dunder–Mifflin’s primary business is quite cyclical, improving and
declining with the economy, but that job A is expected to be countercyclical.
Might this have any bearing on your decision?
P17.9 SOLUTION
A. The $60,000 spent on job cost development is a sunk cost. This cost must, however, be
Job A
Job B
Job C
Projected winning bid (per unit)
$5.00
$8.00
$7.50
Profit contribution per unit
$3.00
$3.70
$4.50
Deduct amortization charges
Deduct depreciation
Annual distribution costs
Investment required to produce annual volume
$4,000,000
560 Chapter 17
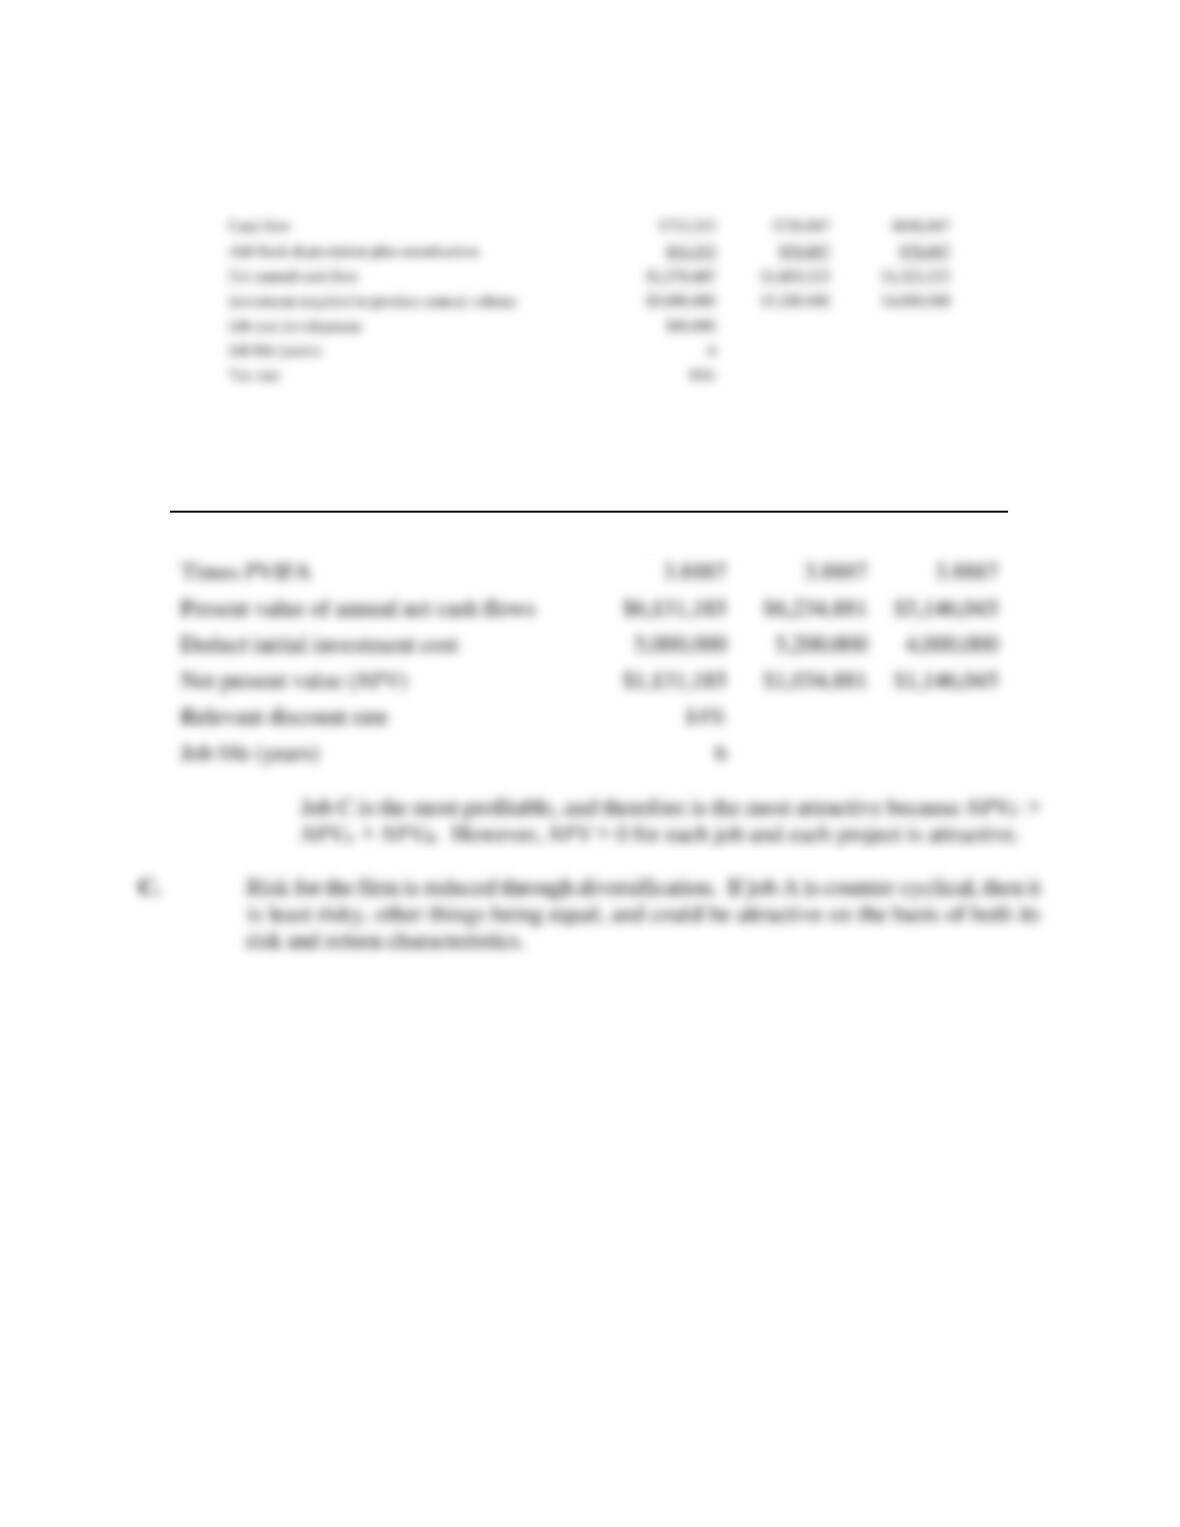
B. The NPV calculations are:
Job A
Job B
Job C
Net annual cash flow
$1,576,667
$1,603,333
$1,323,333
Times PVIFA
Present value of annual net cash flows
$6,131,185
$6,234,881
$5,146,045
Deduct initial investment cost
$1,131,185
$1,034,881
$1,146,045
Relevant discount rate
Job life (years)
P17.10 Cost of Capital. Eureka Membership Warehouse, Inc., is a rapidly growing chain of
retail outlets offering brand-name merchandise at discount prices. A security analyst’s
report issued by a national brokerage firm indicates that debt yielding 13% composes
25% of Eureka’s overall capital structure. Furthermore, both earnings and dividends
are expected to grow at a rate of 15% per year.
Currently, common stock in the company is priced at $30, and it should pay $1.50
per share in dividends during the coming year. This yield compares favorably with the
8% return currently available on risk-free securities and the 14% average for all
common stocks, given the company’s estimated beta of 2.
A. Calculate Eureka’s component cost of equity using both the capital asset pricing
model and the dividend yield plus expected growth model.
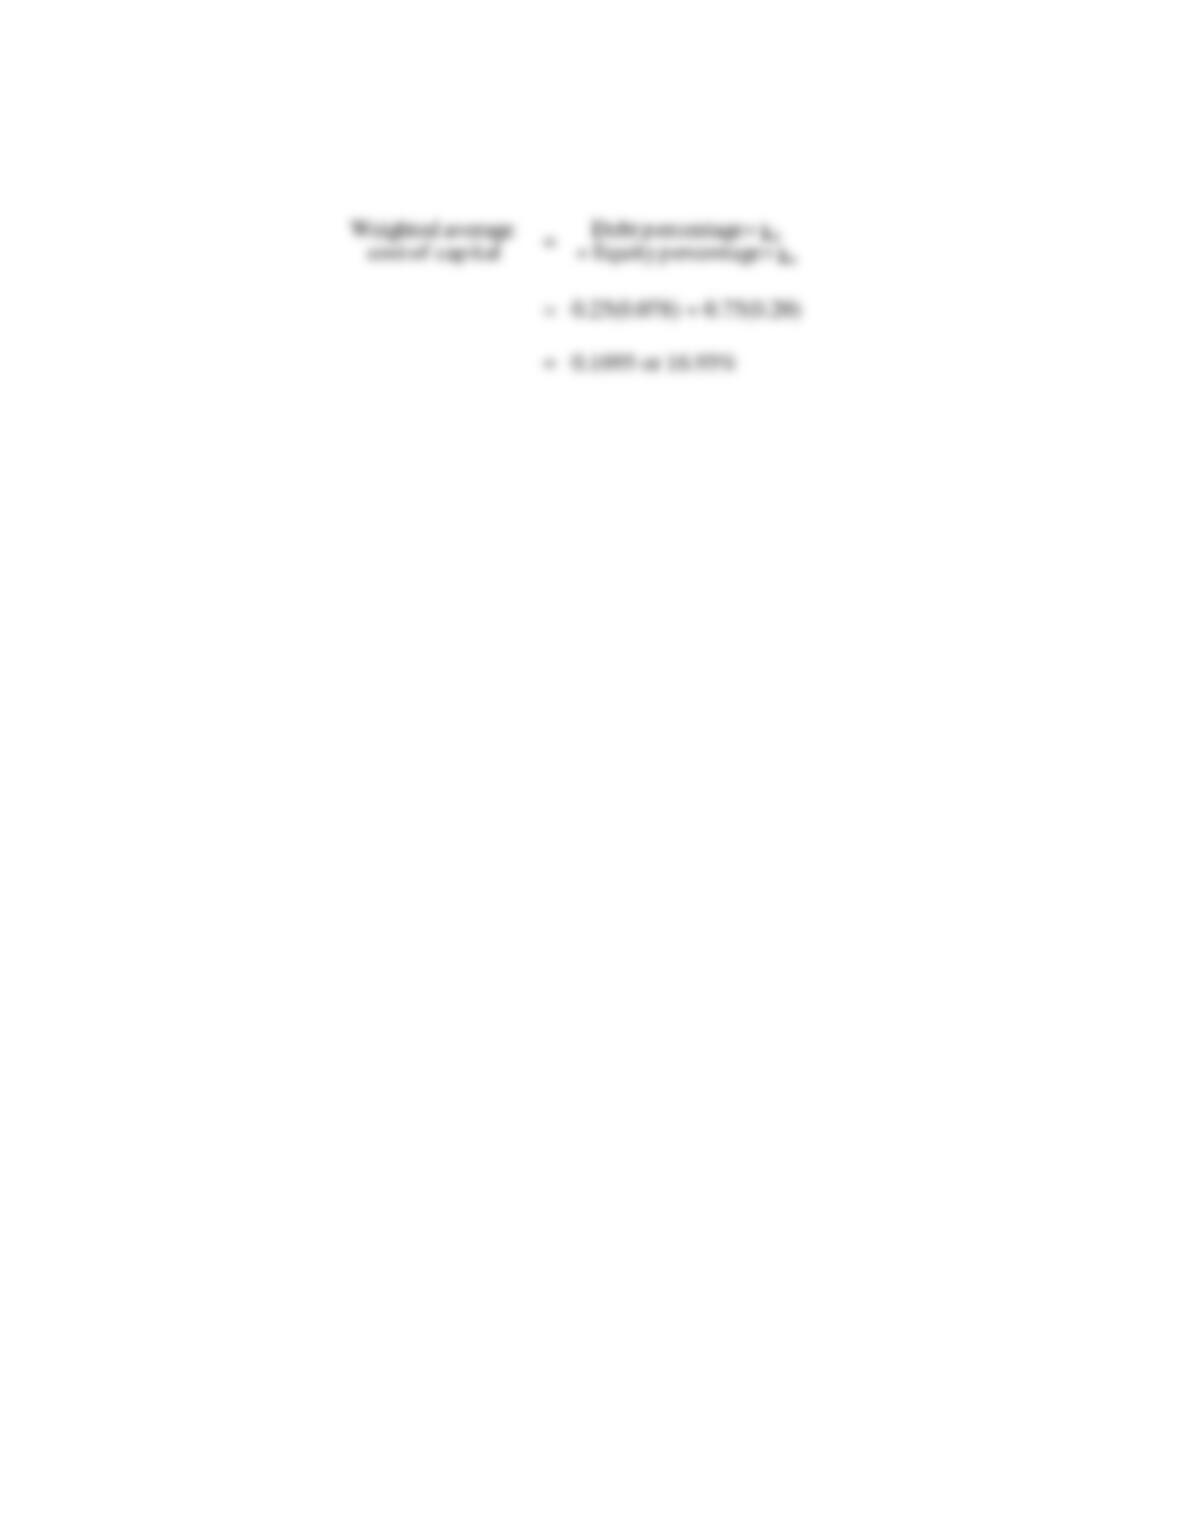
B. Assuming a 40% marginal federal-plus-state income tax rate, calculate Eureka’s
weighted average cost of capital.
Capital Budgeting 561
P17.10 SOLUTION
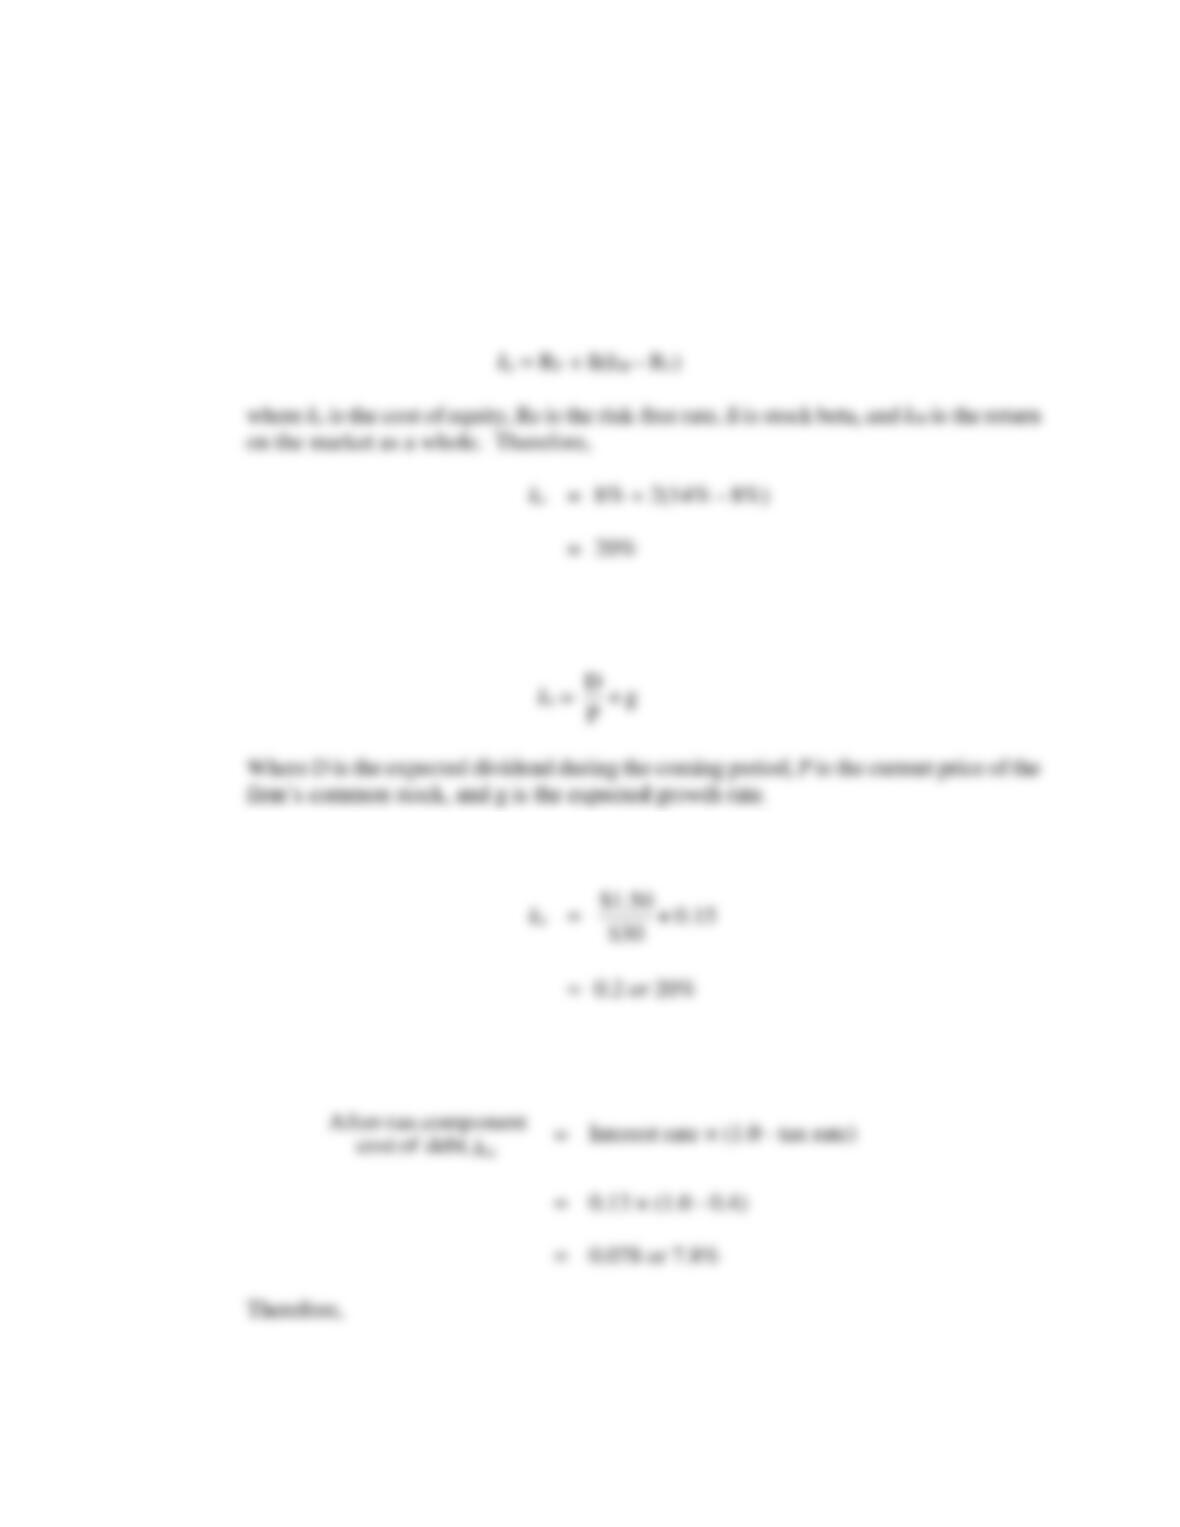
A. In the capital asset pricing model (CAPM) approach, the required return on equity is:
In the dividend yield plus expected growth model approach, the required return on
equity is:
Therefore,
B. Given a 40% state plus federal income tax rate, the after-tax component cost of debt is:
562 Chapter 17
Capital Budgeting 563
CASE STUDY FOR CHAPTER 17
Sophisticated NPV Analysis at Level 3 Communications, Inc.
Level 3 Communications, LLC, provides integrated telecommunications services including voice,
Internet access, and data transmission using rapidly improving optical and Internet protocol
technologies (i.e., “broadband”). Level 3 is called a facilities-based provider because it owns a
substantial portion of the fiber optic plant, property, and equipment necessary to serve its customers.
In 1995, Kiewit distributed its MFS holdings to stockholders. In the seven years from 1988 to
1995, the company had invested approximately $500 million in MFS. At the time of the distribution
to stockholders in 1995, the company’s holdings in MFS had grown to a market value of
approximately $1.75 billion. In December 1996, MFS was purchased by WorldCom in a transaction
valued at $14.3 billion, more than a 28:1 payout and a 52% annual rate of return over 8 years for
During the first quarter of 2001, Level 3 completed construction activities relating to its
North American intercity network. In 2003, the company added approximately 2,985 miles to its
North America intercity network through acquisition of certain assets of Genuity Inc., a
Massachusetts-based provider of communications services. Level 3 has also completed construction
of an approximately 3,600 mile fiber optic intercity network that connects many major European
cities, including Amsterdam, Berlin, Copenhagen, Frankfurt, Geneva, London, Madrid, Milan,
Munich, Paris, Stockholm, Vienna, and Zurich. Level 3’s European network is linked to the North
564 Chapter 17
assets in North America and Europe. This transaction closed on January 18, 2002. As part of the
agreement, Reach and Level 3 agreed that Level 3 would provide capacity and services to Reach
Today, Level 3 has grown to become an international communications and information
services powerhouse headquartered in Broomfield, Colorado. Level 3 is one of the largest providers
of wholesale dial-up service to Internet service providers (ISPs) in North America, and is the
primary provider of Internet connectivity for millions of broadband subscribers through its cable
and DSL partners. The company operates one of the largest communications and Internet
backbones in the world. Level 3 provides services to the world’s ten largest telecom carriers, the top
largest ISPs in North America, and Europe’s ten largest telecom carriers. A key contributor to the
company’s success is its highly sophisticated approach to capital budgeting.
To help investors, employees, customers, and the general public understand the economics of
its business and the company’s approach to capital budgeting, Level 3 has posted on the Internet
In order to produce a model for public use that is not overly complex, several simplifying
assumptions have been made in the Silicon Economics Model. The effects of market competition are
not explicitly modeled, and only a single service offering is considered. In practice, Level 3 offers a
wide variety of services in various geographic locations that have differing degrees of demand
elasticity. The model places no limits on demand growth, such as would be imposed by limitations
on Level 3’s internal operating systems or external supply chain requirements. Capital expenditures
(CAPEX) are modeled using an initial (one-time) infrastructure cost plus an incremental cost per
Capital Budgeting 565
displayed on the “Details” tab of the model. Five three-dimensional charts are automatically
produced to illustrate the sensitivity of net present value to four primary input parameters, including
compression rate and operational and network expense compression rates. For illustration
purposes, input assumptions are an initial demand of 8.5 million units, an initial price of $200,
annual price reductions of 25%, a discount rate of 25%, and a 2.25 price elasticity of demand.
Finally, Table 17.7 shows the net present value implications of these model input
assumptions for the discounted net present value of the enterprise. It is important to remember that
these data are for illustration purposes only. They are not predictions of actual operating and
financial results for Level 3 or any other company.
A. Describe the essential components of Level 3’s Silicon Economics Model.
B. Explain how Level 3’s Silicon Economics Model differs from more standard and simplified
CASE STUDY SOLUTION
A. Level 3’s Silicon Economics Model demonstrates in a simplified format the dynamic
relationships that exist between pricing strategies, cost compression, demand growth, and

566 Chapter 17
B. Level 3’s Silicon Economics Model differs from more standard and simplified approaches
to capital budgeting in that it makes explicit the effects of changes in basic economic
C. The usefulness of the Silicon Economics Model should be judged according to simple
criteria. Does the model help management, employees, stockholders and the general public
better understand the basic economics of the business? Does the model help management