Chapter 16 (5)
Price Levels and the Exchange Rate
in the Long Run
◼ Chapter Organization
The Law of One Price
Purchasing Power Parity
The Relationship between PPP and the Law of One Price
Absolute PPP and Relative PPP
A Long-Run Exchange Rate Model Based on PPP
The Fundamental Equation of the Monetary Approach
Box: Some Meaty Evidence on the Law of One Price
PPP in the Short Run and in the Long Run
Case Study: Why Price Levels Are Lower in Poorer Countries
92 Krugman/Obstfeld/Melitz • International Economics: Theory & Policy, Tenth Edition
◼ Chapter Overview
The time frame of the analysis of exchange rate determination shifts to the long run in this chapter. An
analysis of the determination of the long-run exchange rate is required for the completion of the short-run
exchange rate model because, as demonstrated in the previous two chapters, the long-run expected
exchange rate affects the current spot rate. Issues addressed here include both monetary and real-side
determinants of the long-run real exchange rate. The development of the model of the long-run exchange
rate touches on a number of issues, including the effect of ongoing inflation on the exchange rate, the
Fisher effect, and the role of tradables and nontradables. Empirical issues, such as the breakdown of
purchasing power parity in the 1970s and the correlation between price levels and per capita income, are
addressed within this framework.
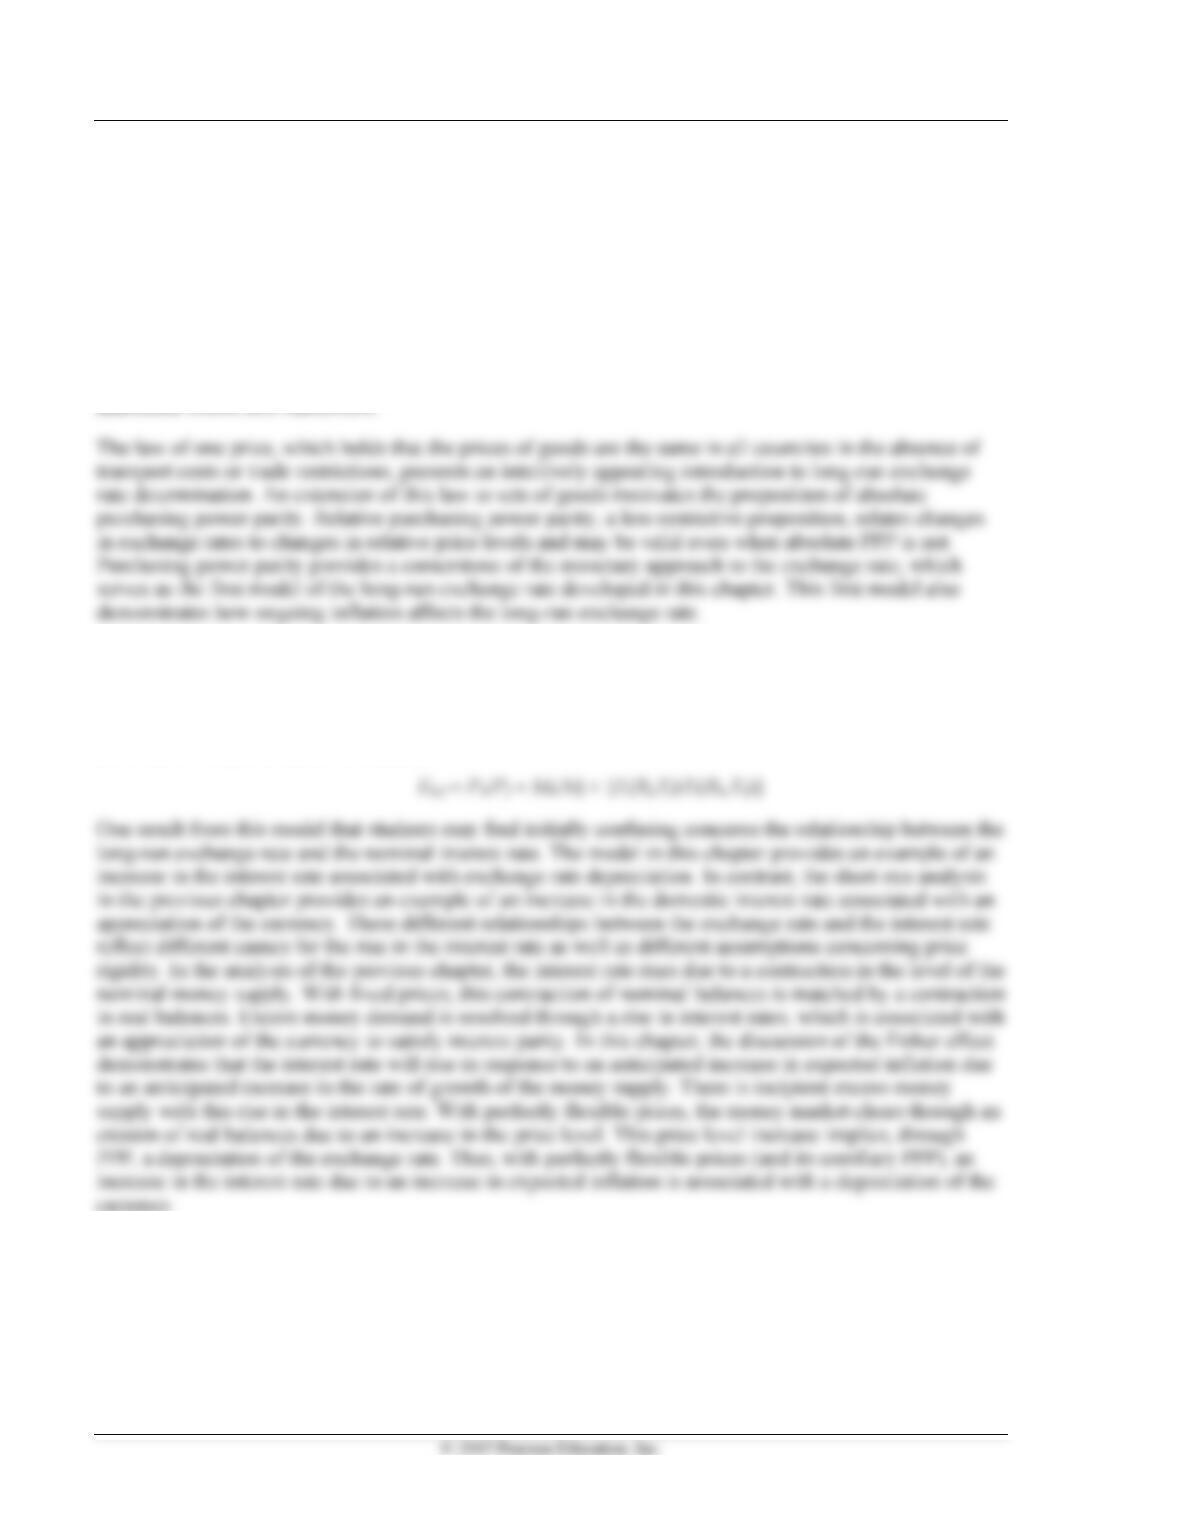
The monetary approach to the exchange rate uses PPP to model the exchange rate as the price level in
the home country relative to the price level in the foreign country. The money market equilibrium
relationship is used to substitute money supply divided by money demand for the price level. The resulting
relationship models the long-run exchange rate as a function of relative money supplies, real interest rates,
and relative output in the two countries:
currency.
Empirical evidence presented in the chapter suggests that both absolute and relative PPP perform poorly
for the period since 1971. Even the law of one price fails to hold across disaggregated commodity groups.
The rejection of these theories is related to trade impediments (which help give rise to nontraded goods
and services), to shifts in relative output prices, and to imperfectly competitive markets. Because PPP
serves as a cornerstone for the monetary approach, its rejection suggests that a convincing explanation of
the long-run behavior of exchange rates must go beyond the doctrine of purchasing power parity. The
Fisher effect is discussed in more detail and accompanied by a diagrammatic exposition in an appendix to
Chapter 16 (5) Price Levels and the Exchange Rate in the Long Run 93
this chapter.
A more general model of the long-run behavior of exchange rates in which real side effects are assigned
a role concludes the chapter. The material in this section drops the assumption of a constant real exchange
rate, an assumption that you may want to demonstrate to students is necessarily associated with the
◼ Answers to Textbook Problems
1. Relative PPP predicts that inflation differentials are matched by changes in the exchange rate.
Under relative PPP, the franc/ruble exchange rate would fall by 95 percent with inflation rates of
100 percent in Russia and 5 percent in Switzerland.
2. A real currency appreciation may result from an increase in the demand for nontraded goods
relative to tradables, which would cause an appreciation of the exchange rate because the increase in
the demand for nontradables raises their price, raising the domestic price level and causing the
3. a. A tilt of spending toward nontraded products causes the real exchange rate to appreciate as the
price of nontraded goods relative to traded goods rises (the real exchange rate can be expressed
4. Relative PPP implies that the pound/dollar exchange rate should be adjusted to offset the inflation
difference between the United States and Britain during the war. Thus, a central banker might
compare the consumer price indices in the United States and the United Kingdom before and
after the war. If America’s price level had risen by 10 percent, while that in Britain had risen by
94 Krugman/Obstfeld/Melitz • International Economics: Theory & Policy, Tenth Edition
5. The real effective exchange rate series for Britain shows an appreciation of the pound from 1977 to
1981, followed by a period of depreciation. Note that the appreciation is sharpest after the increase
in oil prices starts in early 1979; the subsequent depreciation is steepest after oil prices soften in 1982.
6. A permanent shift in the real money demand function will alter the long-run equilibrium nominal
exchange rate but not the long-run equilibrium real exchange rate. Because the real exchange rate
7. The mechanism would work through expenditure effects with a permanent transfer from Poland
8. As discussed in the answer to Question 7, the koruna appreciates against the zloty in real terms
9. Because the tariff shifts demand away from foreign exports and toward domestic goods, there is a
long-run real appreciation of the home currency. Absent changes in monetary conditions, there is a
long-run nominal appreciation as well.
10. The balanced expansion in domestic spending will increase the amount of imports consumed in the
country that has a tariff in place, but imports cannot rise in the country that has a quota in place.
11. A permanent increase in the expected rate of real depreciation of the dollar against the euro leads to a
12. Suppose there is a temporary fall in the real exchange rate in an economy, that is, the exchange
rate appreciates today and then will depreciate back to its original level in the future. The expected
Chapter 16 (5) Price Levels and the Exchange Rate in the Long Run 95
13. International differences in expected real interest rates reflect expected changes in real exchange
rates. If the expected real interest rate in the United States is 9 percent and the expected real interest
rate in Europe is 3 percent, then there is an expectation that the real dollar/euro exchange rate will
depreciate by 6 percent (assuming that interest parity holds).
14. The initial effect of a reduction in the money supply in a model with sticky prices is an increase
in the nominal interest rate and an appreciation of the nominal exchange rate. The real interest rate,
which equals the nominal interest rate minus expected inflation, rises by more than the nominal
interest rate because the reduction in the money supply causes the nominal interest rate to rise and
15. One answer to this question involves the comparison of a sticky-price with a flexible-price model. In
a model with sticky prices, a reduction in the money supply causes the nominal interest rate to rise
and, by the interest parity relationship, the nominal exchange rate to appreciate. The real interest rate,
which equals the nominal interest rate minus expected inflation, increases both because of the
16. If long-term rates are higher than short-term rates, it suggests that investors expect interest rates to be
higher in the future; that is why they demand a higher rate of return on a longer bond. If they expect
interest rates to be higher in the future, they are either predicting higher inflation in the future or a
higher real interest rate. We cannot tell which by simply looking at short and long rates.
17. If we assume that the real exchange rate is constant, then the expected percentage change in the
exchange rate is simply the inflation differential. As the question notes, this relationship holds better
over the long run. Starting from interest parity, we see that R = R* + %eE. The change in the
96 Krugman/Obstfeld/Melitz • International Economics: Theory & Policy, Tenth Edition
18. If markets are fairly segmented, then temporary moves in exchange rates may lead to wide deviations
from PPP even for tradable goods. In the short run, firms may not be able to respond by opening up
19. Recall the definition of the real exchange rate as q$/€ = (E$/€ × PEU)/PUS. According to the problem,
U.S. export goods have a greater weight in the U.S. CPI (price level) than in the foreign CPI.
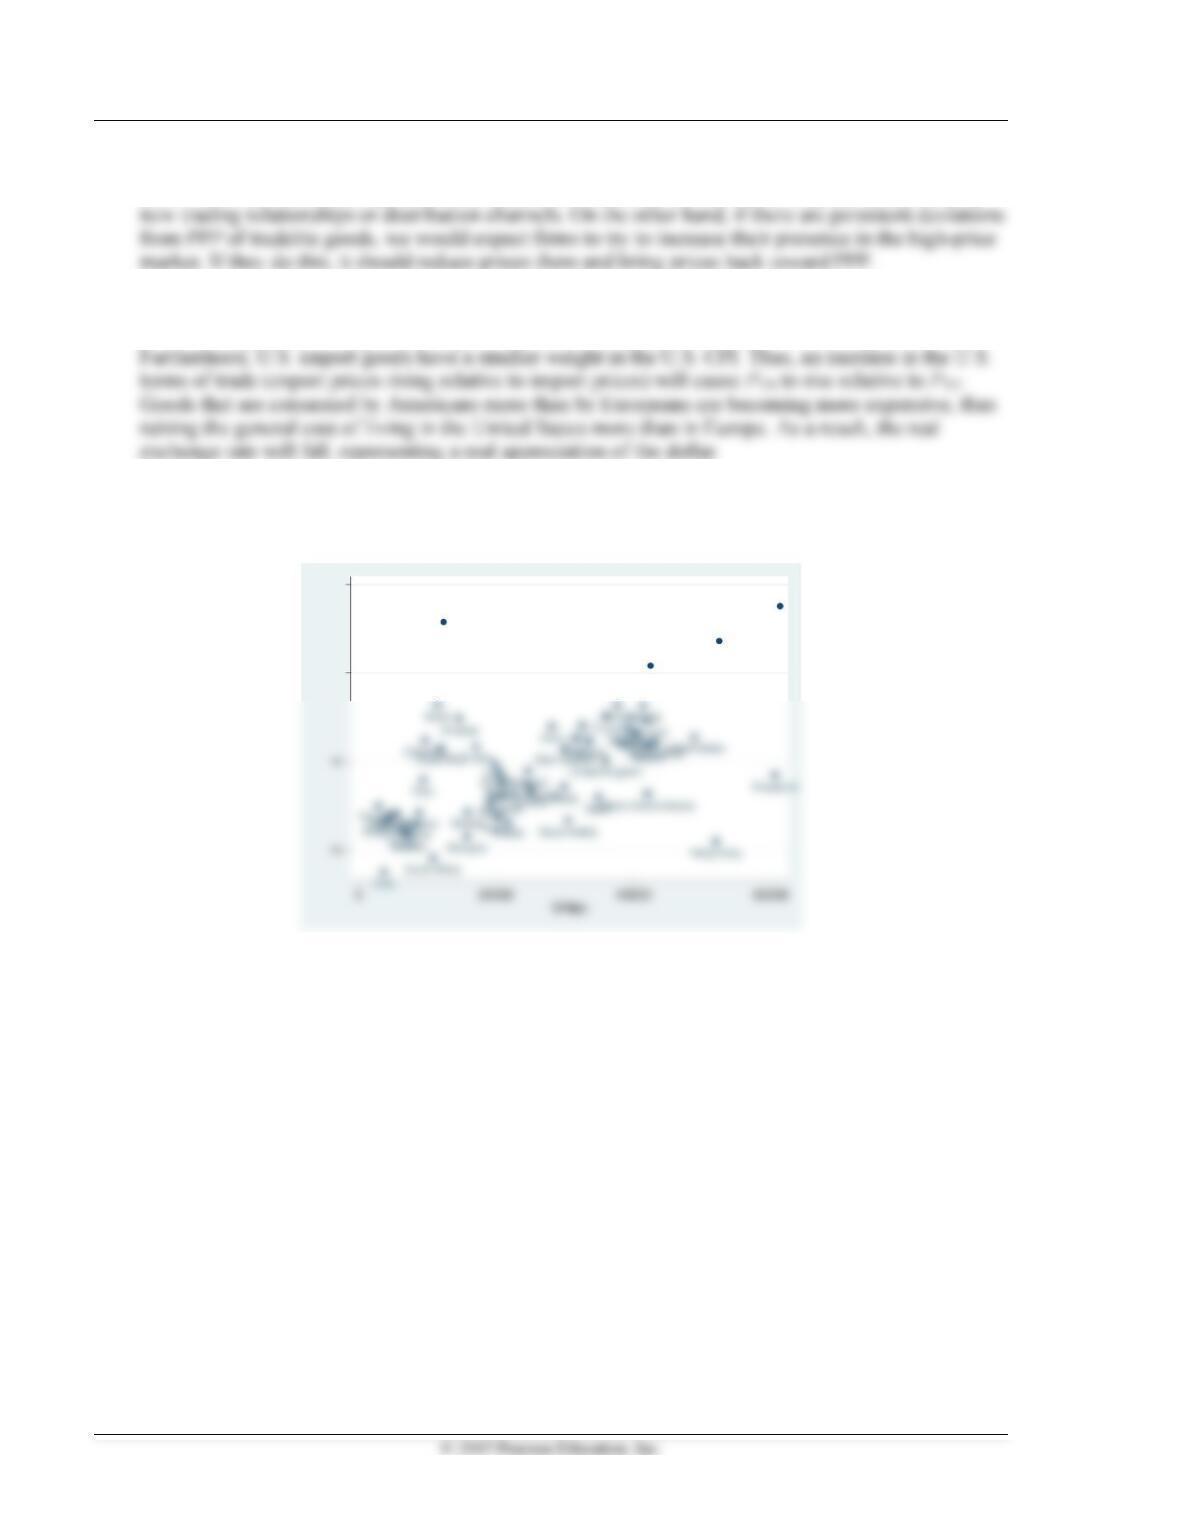
20. As indicated by the graph below, there is a strong and positive relationship between GNI per capita in
a country and the dollar price of a Big Mac:
Venezuela
Sweden
Switzerland
Norway