
Chapter 16: Financial Planning and Forecasting
Learning Objectives
455
Chapter 16
Financial Planning and Forecasting
Learning Objectives
After reading this chapter, students should be able to do the following:
◆ Discuss the importance of strategic planning and the central role that financial forecasting plays in
the overall planning process.
◆ Explain how firms forecast sales.
◆ Use the Additional Funds Needed (or AFN) equation and discuss the relationship between asset
growth and the need for funds.
◆ Explain how spreadsheets are used in the forecasting process, starting with historical statements,
ending with projected statements, and including a set of financial ratios based on those projected
statements.
◆ Discuss how planning is an iterative process.

456
Lecture Suggestions
Chapter 16: Financial Planning and Forecasting
Lecture Suggestions
In Chapter 4, we looked at where the firm has been and where it is now—its current strengths and
weaknesses. Now, in Chapter 16, we look at where it is projected to go in the future.
What we cover, and the way we cover it, can be seen by scanning the slides and Integrated Case
solution for Chapter 16, which appears at the end of this chapter’s solutions. For other suggestions
about the lecture, please see the “Lecture Suggestions” in Chapter 2, where we describe how we conduct
our classes.
DAYS ON CHAPTER: 3 OF 56 DAYS (50-minute periods)
Chapter 16: Financial Planning and Forecasting
Answers and Solutions
457
Answers to End-of-Chapter Questions
16-1 The need for external financing depends on the following key factors:
1. Sales growth (S). Rapidly growing companies require large increases in assets, other things
held constant.
2. Capital intensity (A0*/S0). The amount of assets required per dollar of sales, the capital
3. Spontaneous liabilities-to-sales ratio (L0*/S0). Companies that spontaneously generate a
4. Profit margin (M). The higher the profit margin, the larger the net income available to
5. Retention ratio (1 – Payout). Companies that retain a high percentage of their earnings
16-2 False. At low growth rates, internal financing will take care of the firm’s needs.
16-4 Accounts payable, accrued wages, and accrued taxes increase spontaneously with sales.
16-5 a. +.
b. -. The firm needs less manufacturing facilities, raw materials, and work in process.
458
Answers and Solutions
Chapter 16: Financial Planning and Forecasting
16-2 AFN =
)0,000)(0.318($ 00,000)(0.1)($1,0$1,000,000
$5,000,000
$4,000,000 −−
16-3 AFN = (0.6)($1,000,000) – (0.1)($1,000,000) – 0.03($6,000,000)(1)
= $600,000 – $100,000 – $180,000
16-4 a. 2019 Forecast Basis 2020
Sales $700 1.25 $875.00
Operating costs 500 0.70 Sales 612.50
16-5 Sales = $7,000,000,000; FA = $1,944,000,000; FA are operated at 90% capacity.
Chapter 16: Financial Planning and Forecasting
Answers and Solutions
459
b. Target FA/S ratio = $1,944,000,000/$7,777,777,778 = 0.2499 0.25.
c. Sales increase 15%; FA = ?
16-6 Sales = $300,000,000; gSales = 12%; Inv. = $25 + 0.125(Sales).
16-7 Actual Forecast Basis Pro Forma
Sales $3,000 1.10 $3,300
Oper. costs excluding depreciation 2,450 0.80 Sales 2,640
EBITDA $ 550 $ 660
16-8 a.
equity and
sliabilitie Total
= Accounts payable + Long-term debt + Common stock + Retained earnings
Alternatively,
Total liabilities = Total liabilities and equity – Common stock – Retained earnings
460
Answers and Solutions
Chapter 16: Financial Planning and Forecasting
2020 Sales = (1.25)($3,000,000) = $3,750,000.
Alternatively, using the forecasted financial statements:
Forecast Additions (New 2020
2019 Basis Financing, R/E) Pro Forma
Total assets $1,800,000 × 0.60 Sales20 $2,250,000
*Given in problem that firm will sell new common stock = $130,000.
16-9 S2019 = $4,000,000; A2019 = $3,200,000; CL2019 = $500,000; NP2019 = $200,000; A/P2019 =
$200,000; Accrued liabilities2019 = $100,000; A0*/S0 = 0.80; PM = 3%; (1 – Payout) = 50%; so
AFN = 0, S = ?
AFN = (A0*/S0)S – (L0*/S0)S – MS1(1 – Payout)
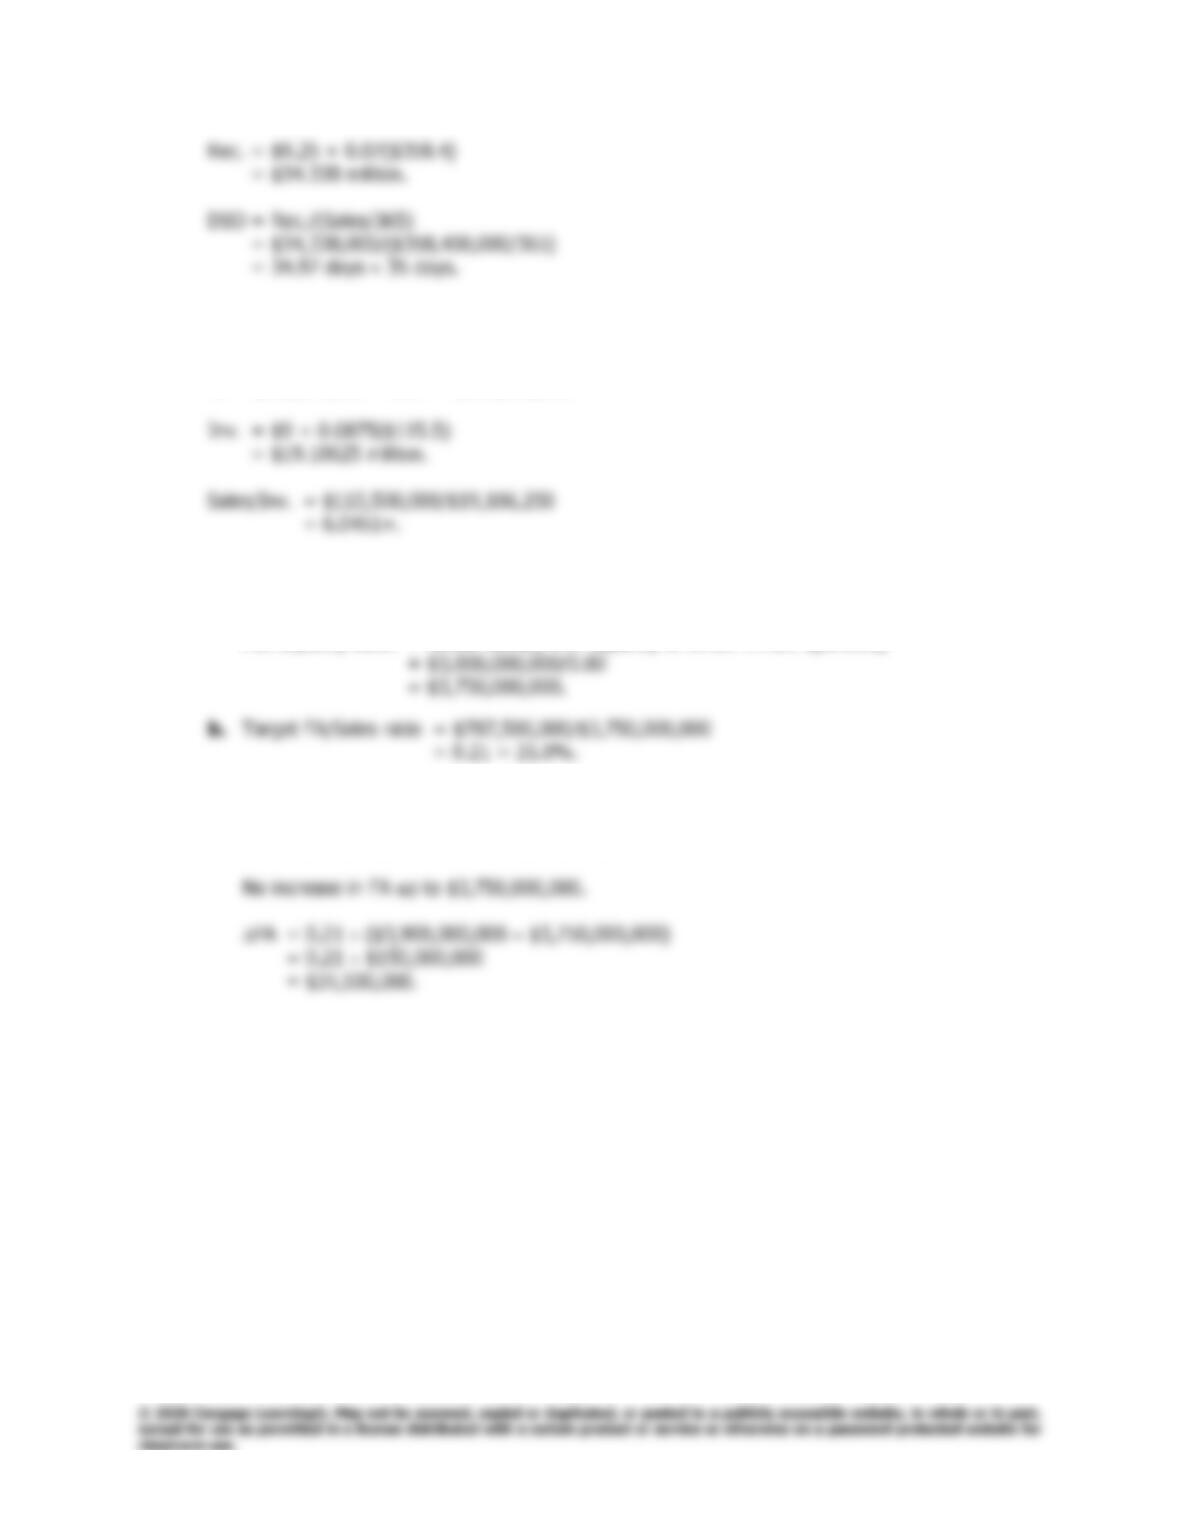
16–10 Sales = $320,000,000; gSales = 12%; Rec. = $9.25 + 0.07(Sales).
Chapter 16: Financial Planning and Forecasting
Answers and Solutions
461
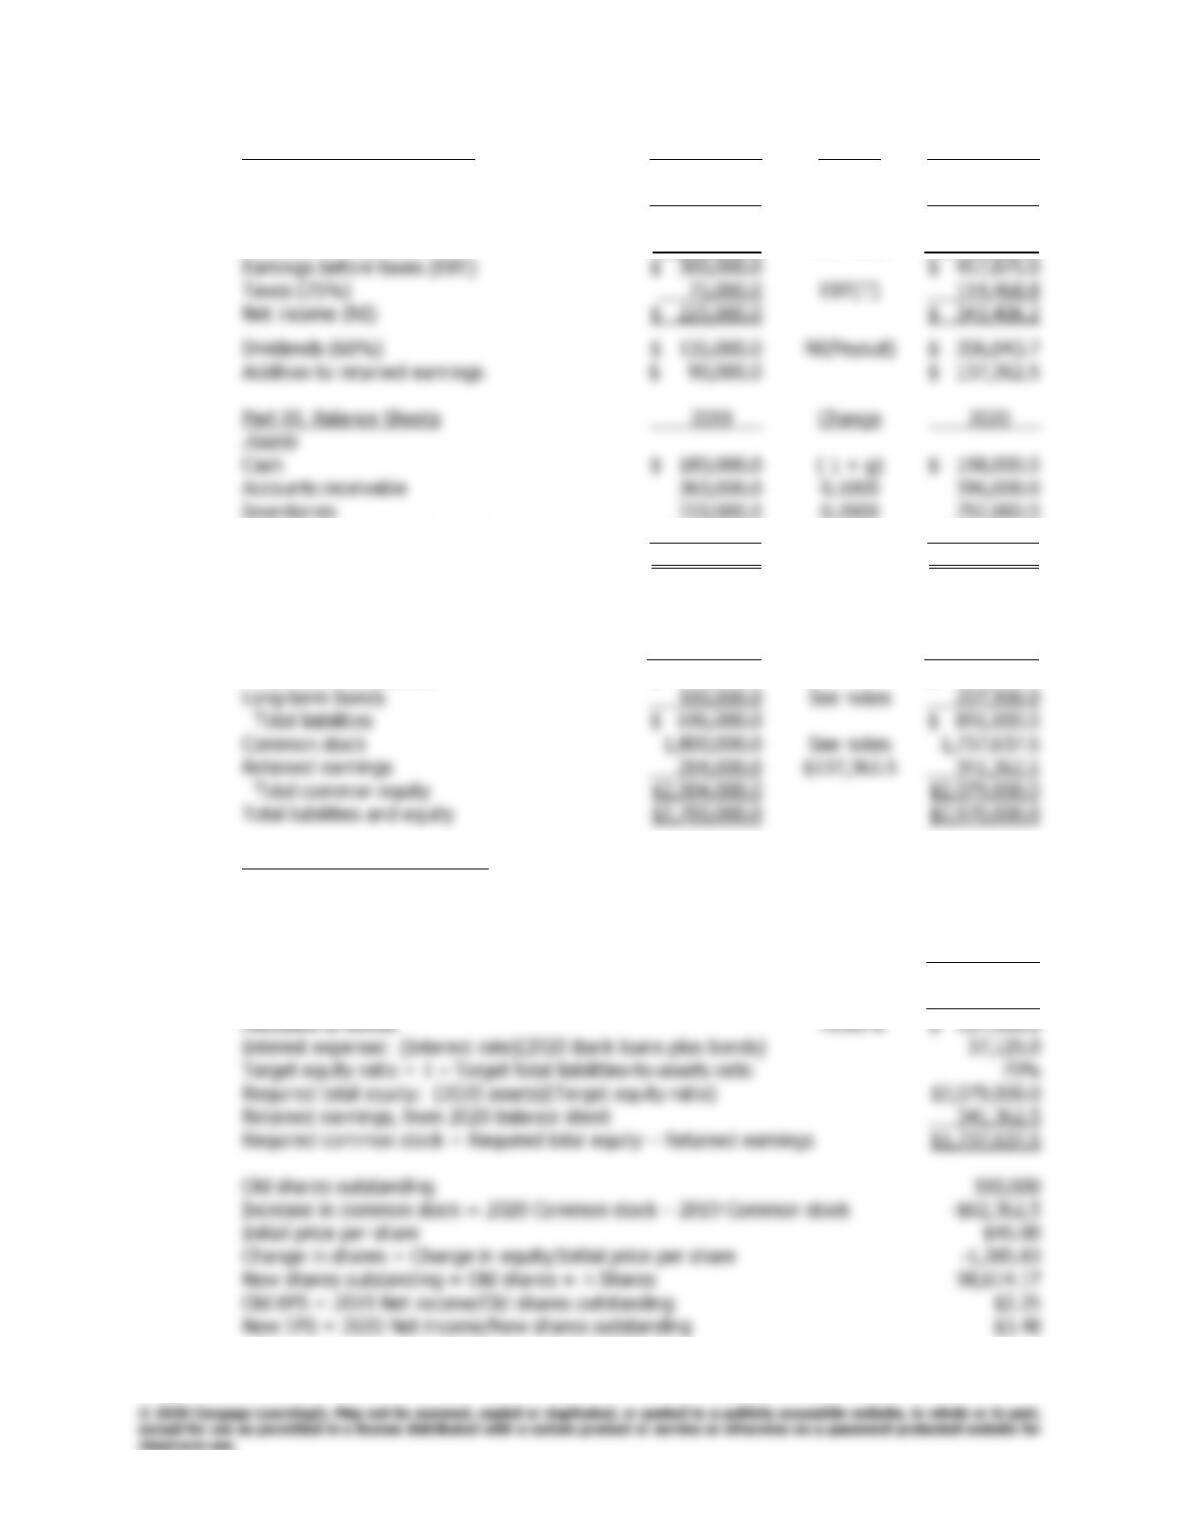
16–11 Sales = $110,000,000; gSales = 5%; Inv. = $9 + 0.0875(Sales).
S1 = $110,000,000 1.05 = $115,500,000.
16–12 a. Sales = $3,000,000,000; FA = $787,500,000; FA are operated at 80% capacity.
Full capacity sales = Actual sales/(% of capacity at which FA are operated)
c. Sales increase 30%; FA = ?
S1 = $3,000,000,000 1.30 = $3,900,000,000.
462
Answers and Solutions
Chapter 16: Financial Planning and Forecasting
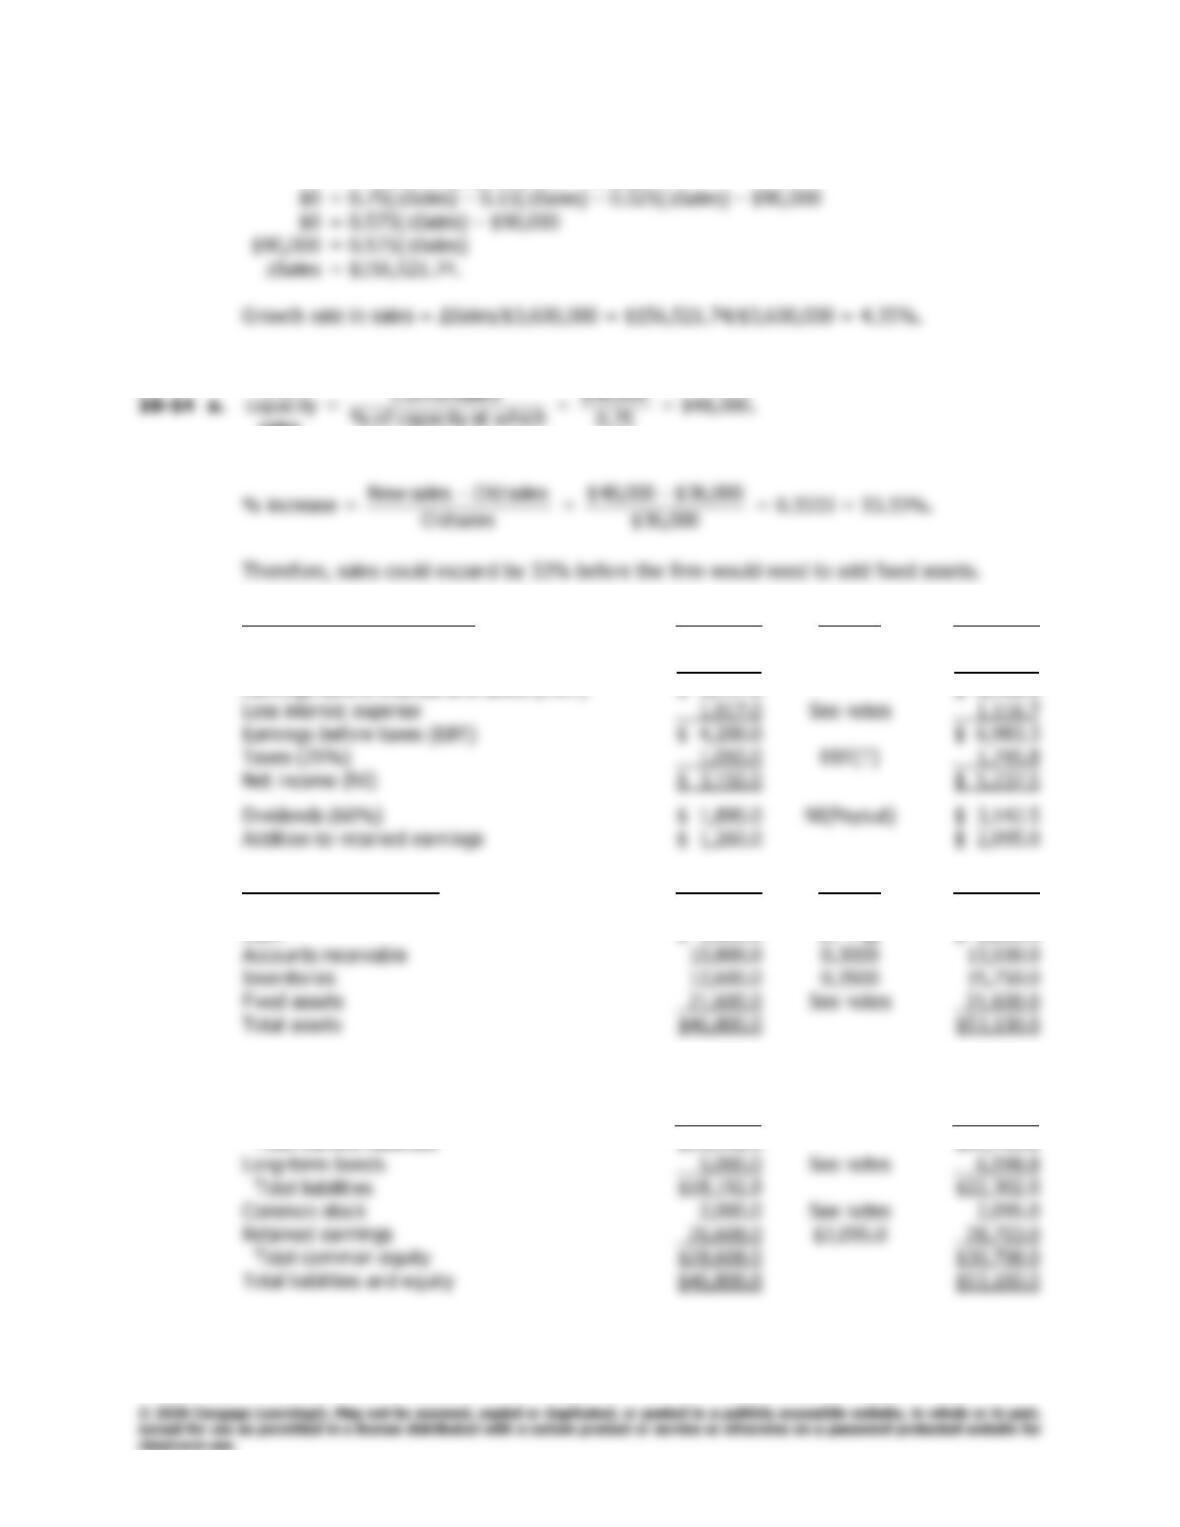
16–13 a. Part II. Income Statements 2019 Change 2020
Sales $3,600,000.0 (1 + g) $3,960,000.0
Operating costs (includes depreciation) 3,279,720.0 0.875 3,465,000.0
Earnings before interest and taxes (EBIT) $ 320,280.0 $ 495,000.0
Less interest expense 20,280.0 See notes 37,125.0
Fixed assets (grow with sales) 1,440,000.0 (1 +g) 1,584,000.0
Total assets $2,700,000.0 $2,970,000.0
Liabilities and Equity
Payables + accruals (both grow with sales) $ 540,000.0 (1 + g) $ 594,000.0
Short-term bank loans 56,000.0 See notes 89,100.0
Total current liabilities $ 596,000.0 $ 683,100.0
Part V. Notes on Calculations
Assets in 2020 will change to this amount, from the balance sheet: $2,970,000.0
Target total liabilities-to-assets ratio 30.00%
Resulting total liabilities: (Target total liabilities-to-assets ratio)(2020 assets) $ 891,000.0
Less: Payables and accruals –594,000.0
Bank loans and bonds (= Interest-bearing debt) $ 297,000.0
Allocated to bank loans 30.00% 89,100.0
Chapter 16: Financial Planning and Forecasting
Answers and Solutions
463
b. AFN = $2,700,000/$3,600,000(Sales) – ($360,000 + $180,000)/$3,600,000(Sales)
– (0.0625)($3,600,000 + Sales)0.4
sales
Full
operated wereFA
75.0
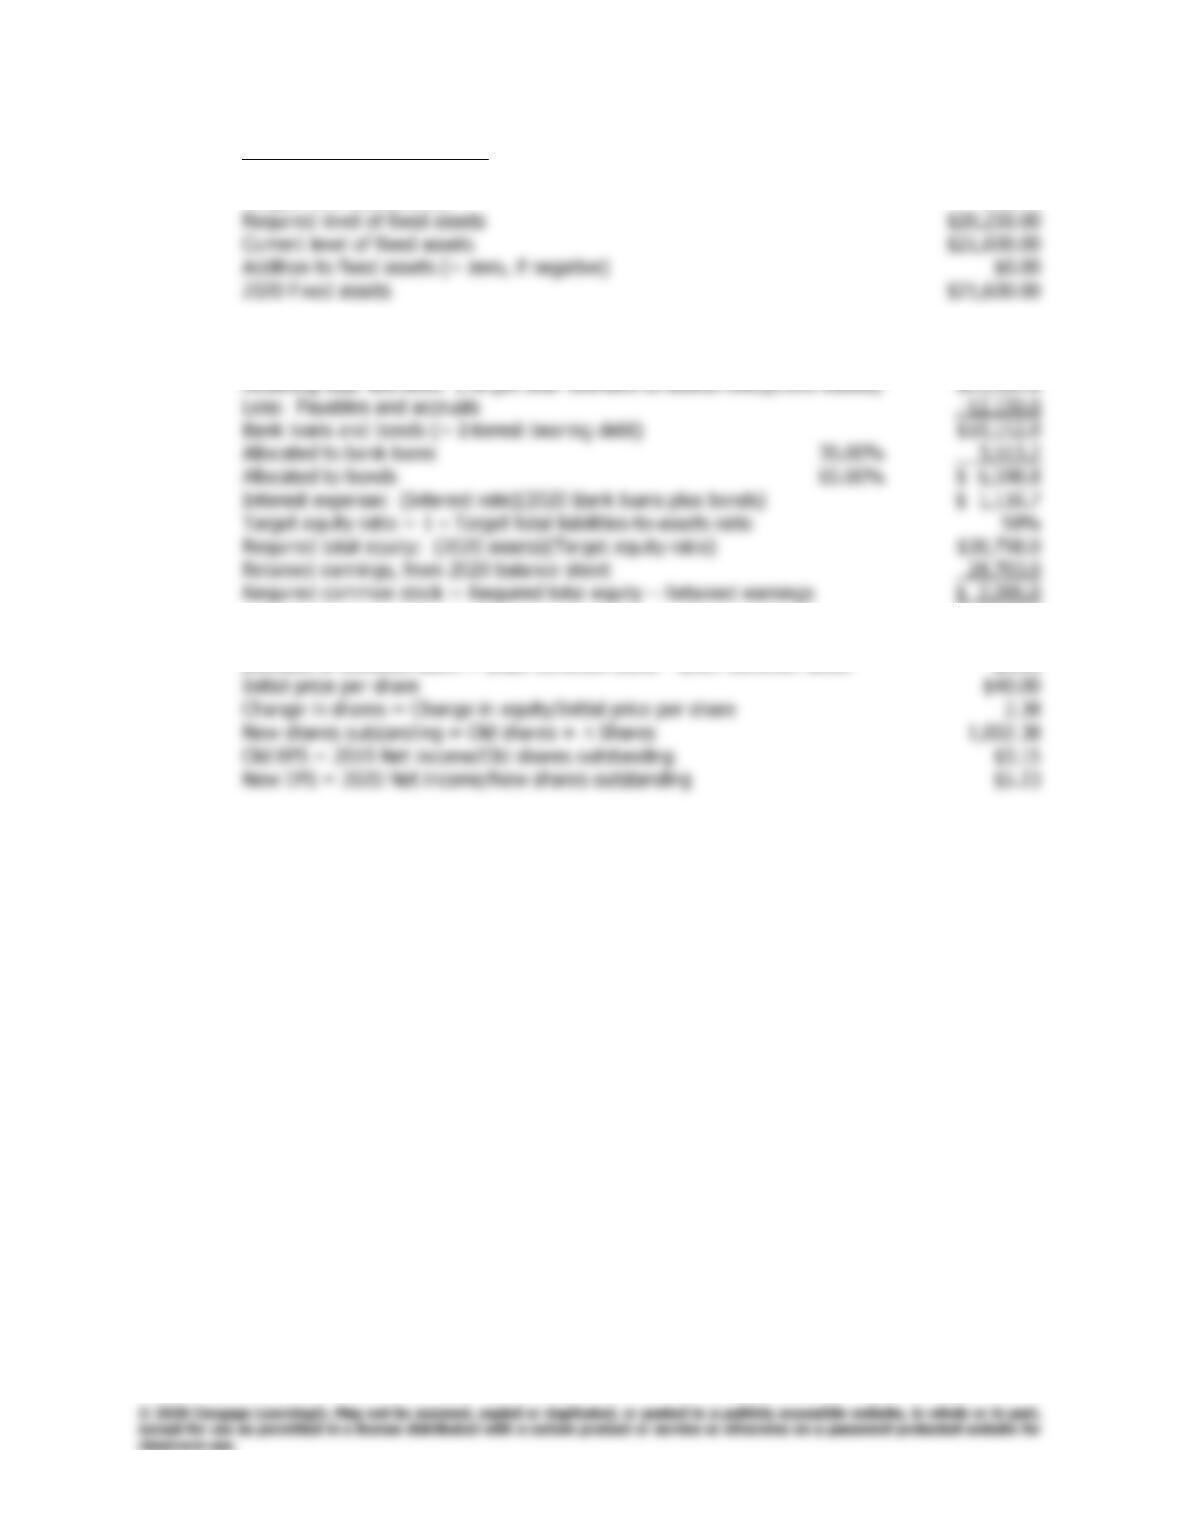
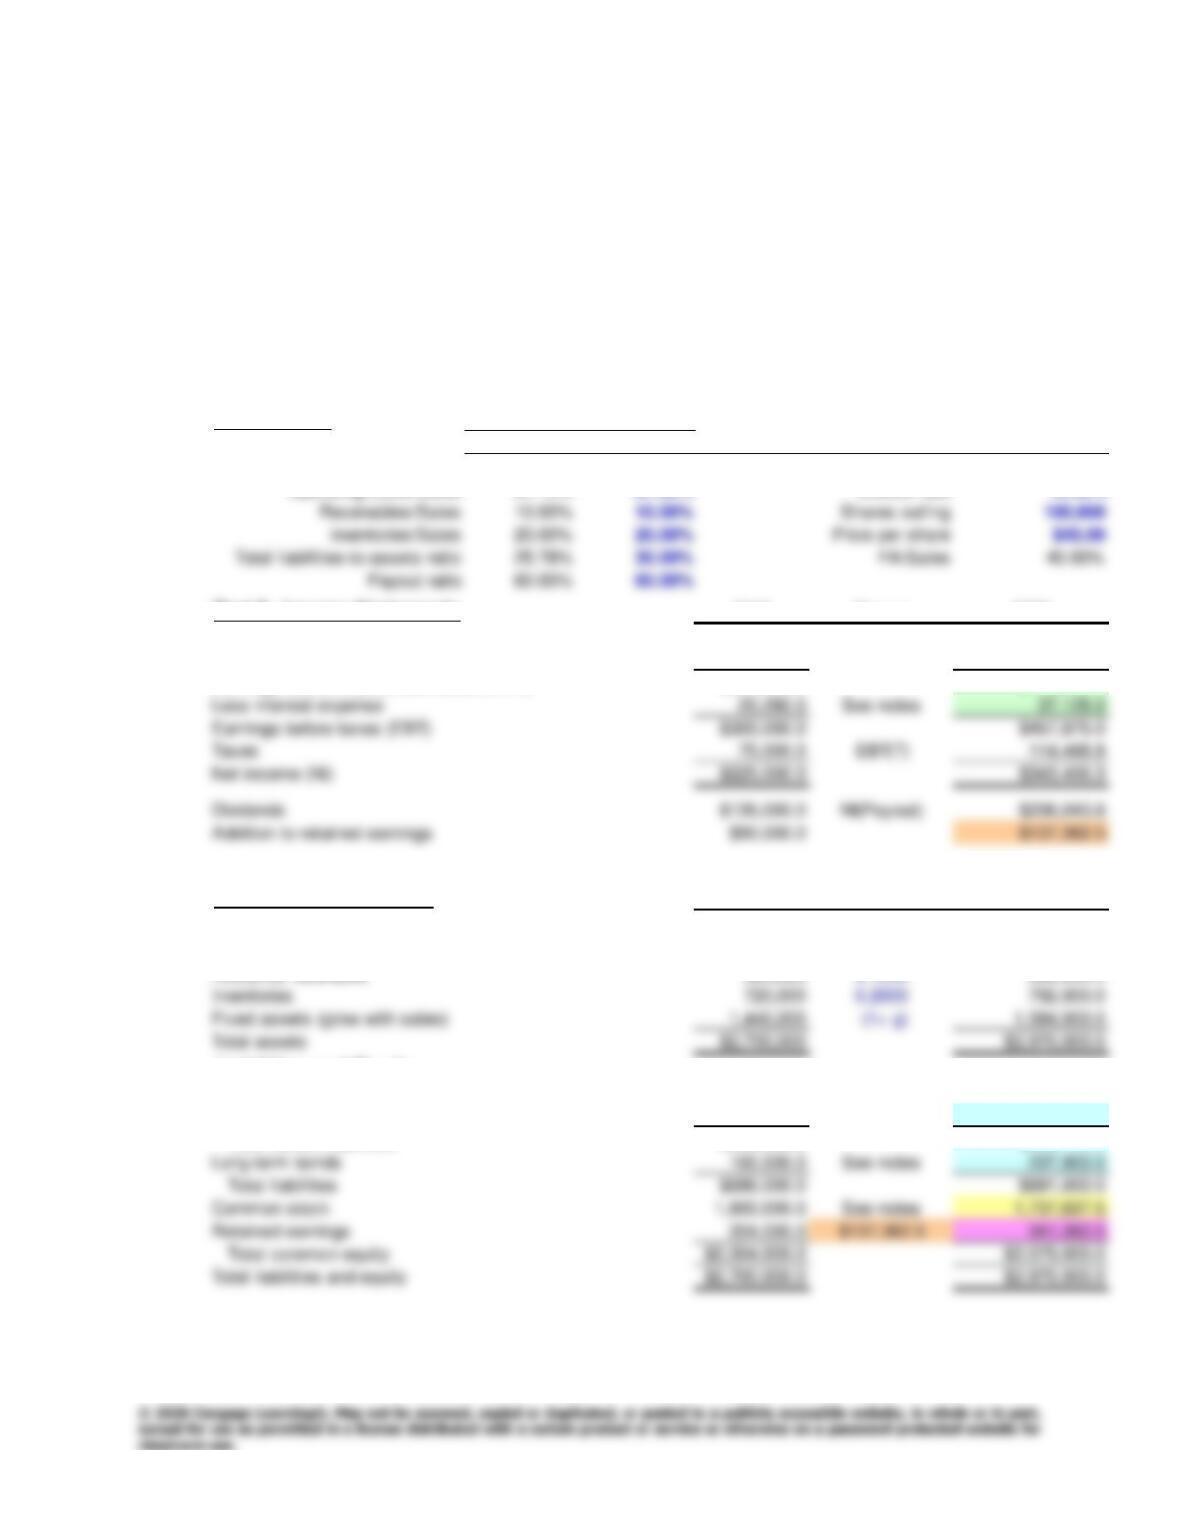
b. Part II. Income Statements (in thousands) 2019 Change 2020
Sales $36,000.0 (1 + g) $45,000.0
Operating costs (includes depreciation) 30,783.0 0.820 36,900.0
Earnings before interest and taxes (EBIT) $ 5,217.0 $ 8,100.0
Part III. Balance Sheets (in thousands) 2019 Change 2020
Assets
Cash $ 1,800.0 (1 + g) $ 2,250.0
Liabilities and Equity
Payables + accruals (both grow with sales) $ 9,720.0 (1 + g) $12,150.0
Short-term bank loans 3,472.0 See notes 3,553.2
Total current liabilities $13,192.0 $15,703.2
464
Answers and Solutions
Chapter 16: Financial Planning and Forecasting
Part V. Notes on Calculations (in thousands)
Full capacity sales $48,000.00
Target fixed assets/Sales 45.00%
Assets in 2020 will change to this amount, from the balance sheet: $53,100.0
Target total liabilities-to-assets ratio 42.00%
Old shares outstanding (in thousands) 1,000
Increase in common stock = 2020 Common stock – 2019 Common stock $95.0
Chapter 16: Financial Planning and Forecasting
Comprehensive/Spreadsheet Problem
465
Comprehensive/Spreadsheet Problem
Note to Instructors:
The solution for 16-14 is provided at the back of the text; however, the solution to 16-13 is
not. Instructors can access the
Excel
file on the textbook’s website.
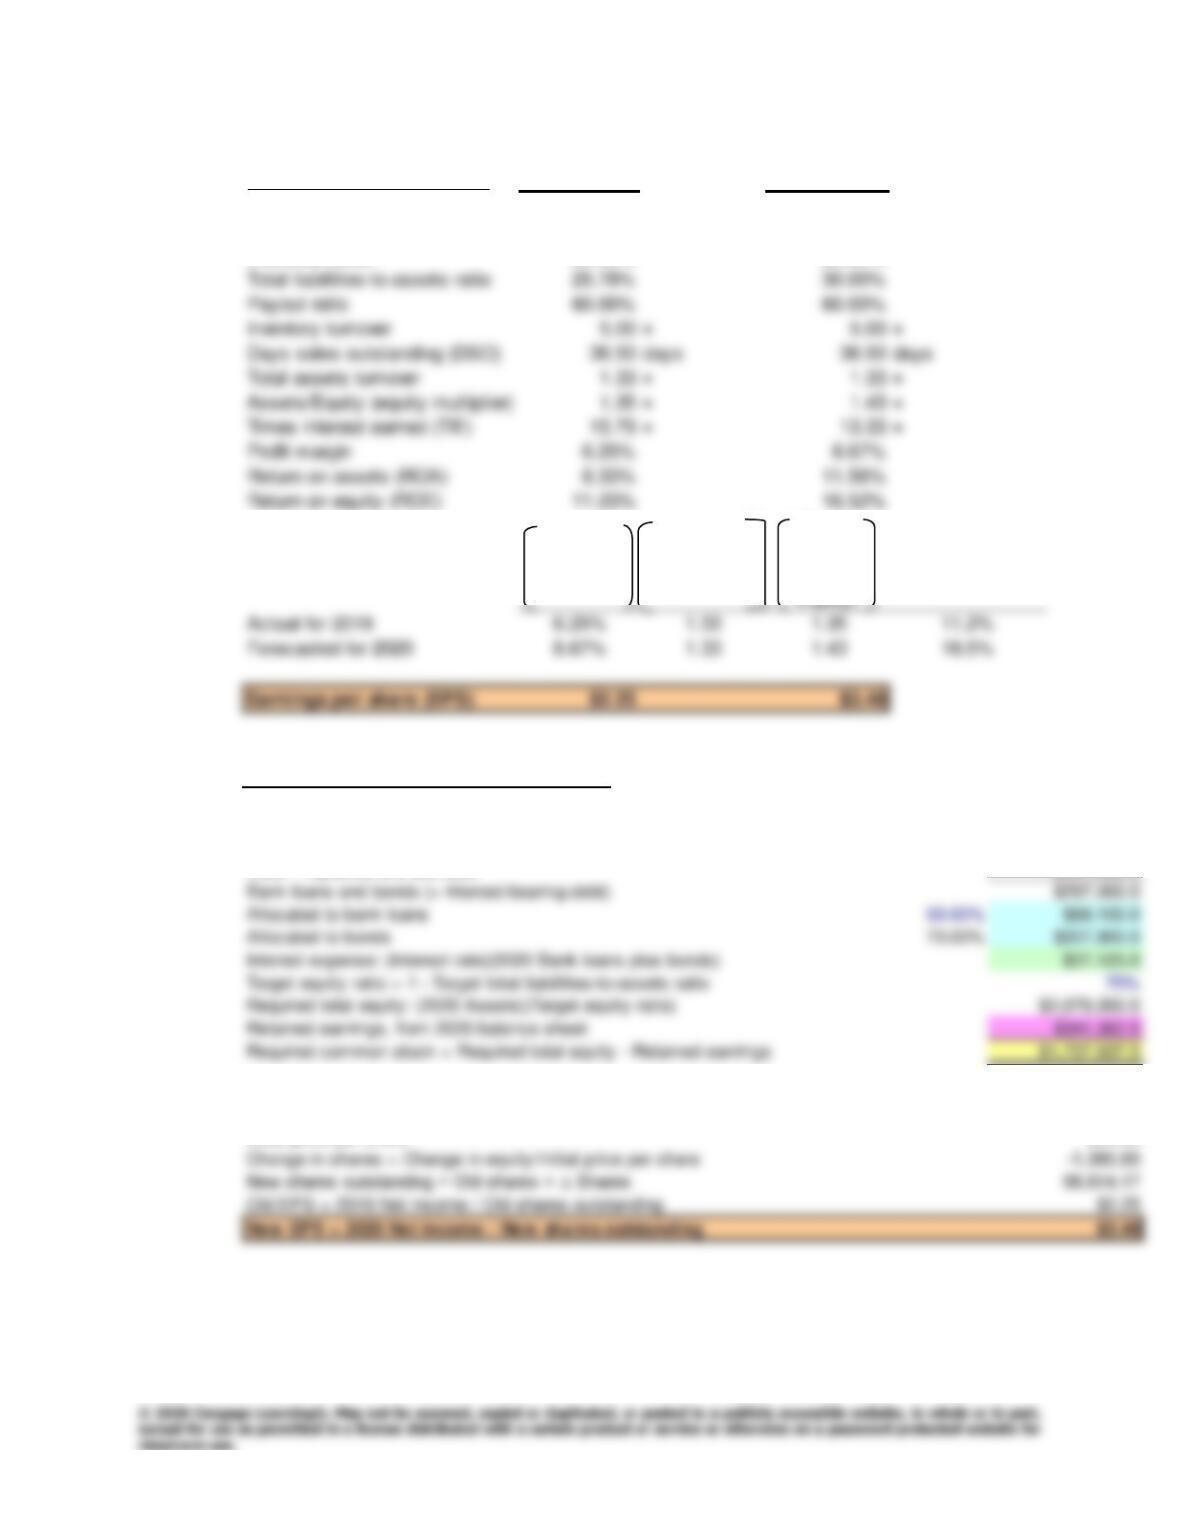
16-15 Problem 16-13 reworked:
a.
Part I. Inputs
2019 2020
Growth rate, g NA 10% Tax rate (T) 25%
Operating costs/Sales 91.10% 87.50% Interest rate 12.50%
Adjustable Inputs
Fixed Inputs
Part II. Income Statements 2019 Change 2020
Sales $3,600,000.0 (1+ g) $3,960,000.0
Operating costs (includes depreciation) 3,279,720.0 0.875 3,465,000.0
Earnings before interest and taxes (EBIT) $320,280.0 $495,000.0
Part III. Balance Sheets 2019 Change 2020
Assets
Cash $180,000 (1+ g) $198,000.0
Accounts receivable 360,000 0.1000 396,000.0
Liabilities and Equity
Payables + accruals (both grow with sales) $540,000.0 (1+ g) $594,000.0
Short-term bank loans 56,000.0 See notes 89,100.0
Total current liabilities $596,000.0 $683,100.0
466
Comprehensive/Spreadsheet Problem
Chapter 16: Financial Planning and Forecasting
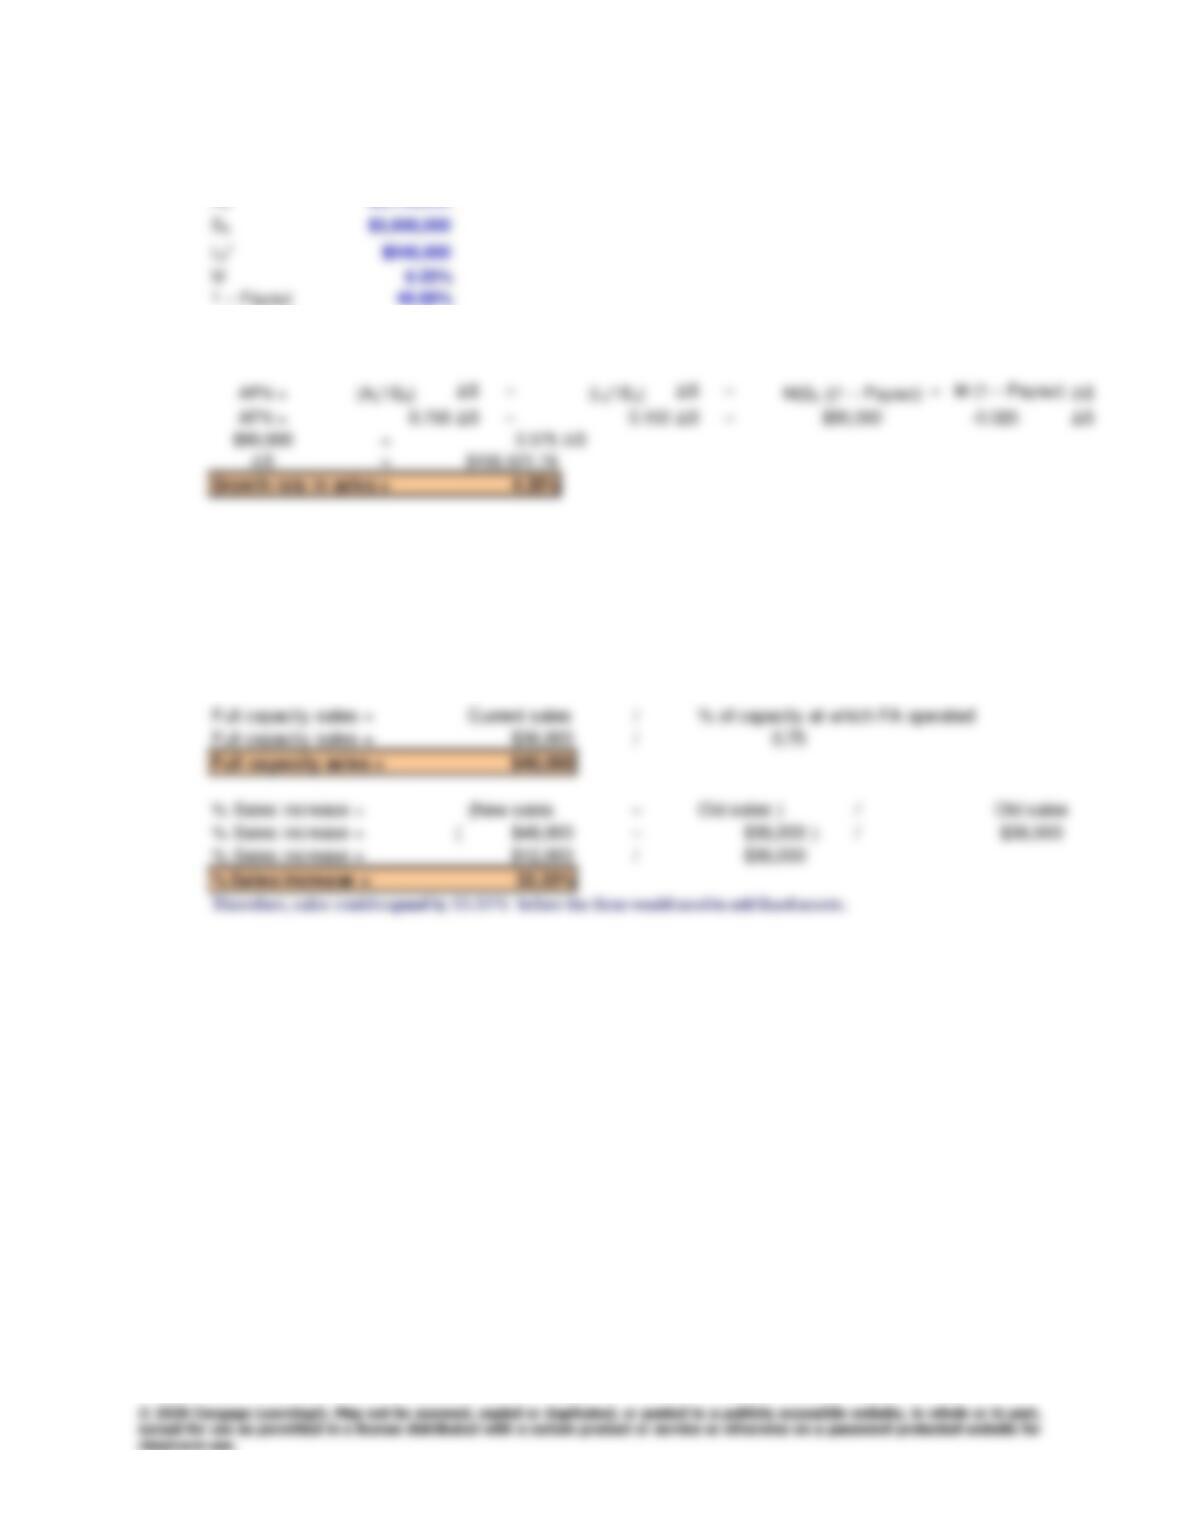
Part IV. Ratios and EPS 2019 2020E
Operating costs/Sales 91.10% 87.50%
Receivables/Sales 10.00% 10.00%
Inventory/Sales 20.00% 20.00%
DuPont Calculations
Profit Margin
(NI/S)
Total Assets
Turnover (S/A)
Equity
Multiplier
(Assets/
= ROE
Part V. Notes on Calculations
Assets in 2020 will change to this amount, from the balance sheet: $2,970,000.0
Target total liabilities-to-assets ratio 30.00%
Resulting total liabilities: (Target total liabilities-to-assets ratio)( 2020 Assets)
$891,000.0
Less: Payables and accruals -$594,000.0
Old shares outstanding 100,000
Increase in common stock = 2020 Common stock – 2019 Common stock -$62,362.5
Initial price per share $45.00
Chapter 16: Financial Planning and Forecasting
Comprehensive/Spreadsheet Problem
467
b.
Input Data:
A0*$2,700,000
S0$3,600,000
AFN =
(A0*/S0)ΔS–(L0*/S0)ΔS–
M(S0 + ΔS)(1 ‒ Payout)
Problem 16-14 reworked:
a.
Input Data:
FA Capacity 75.00%
Current Sales $36,000