514 Chapter 16
A.
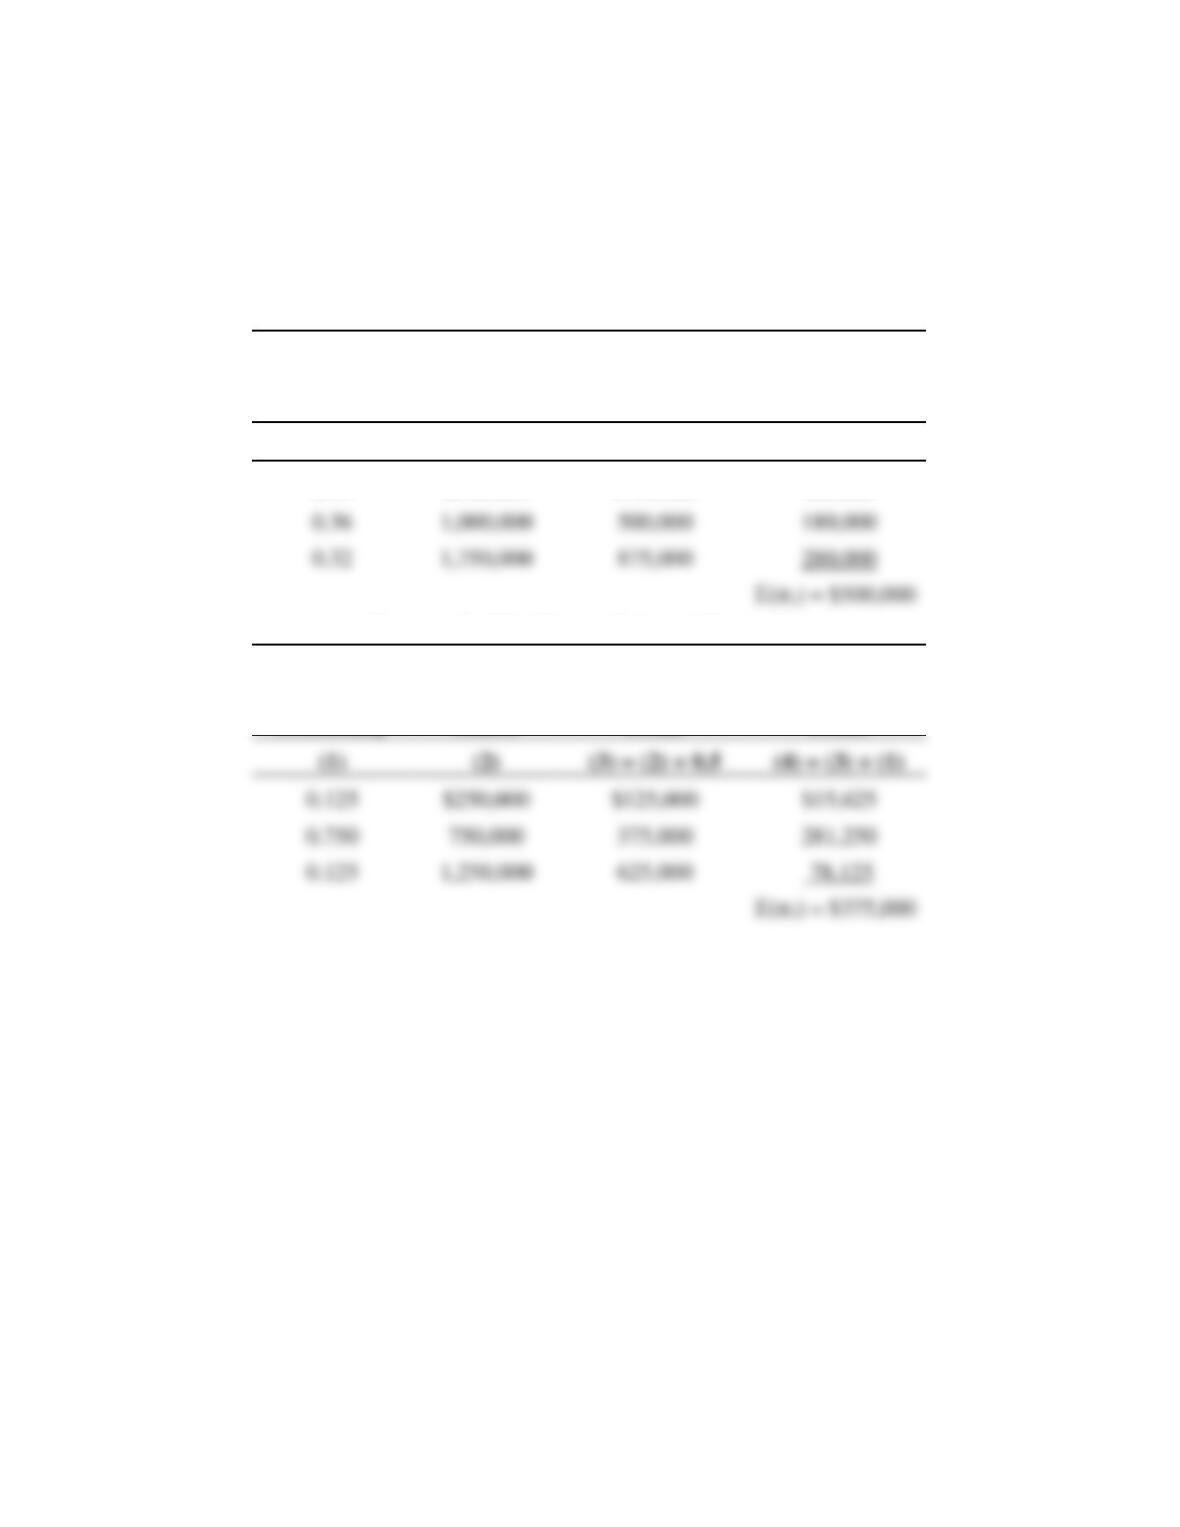
Strategy 1: Consumer-Oriented Promotion
Probability
Outcomes
(Sales)
Profit
Expected
Profit
(1)
(2)
(3) = (2) × 0.5
(4) = (3) × (1)
0.32
$250,000
$125,000
$40,000
Strategy 2: Distributor-Oriented Promotion
Probability
Outcomes
(Sales)
Profit
Expected
Profit
(1)
(2)
(3) = (2) × 0.5
(4) = (3) × (1)
Risk Analysis 515
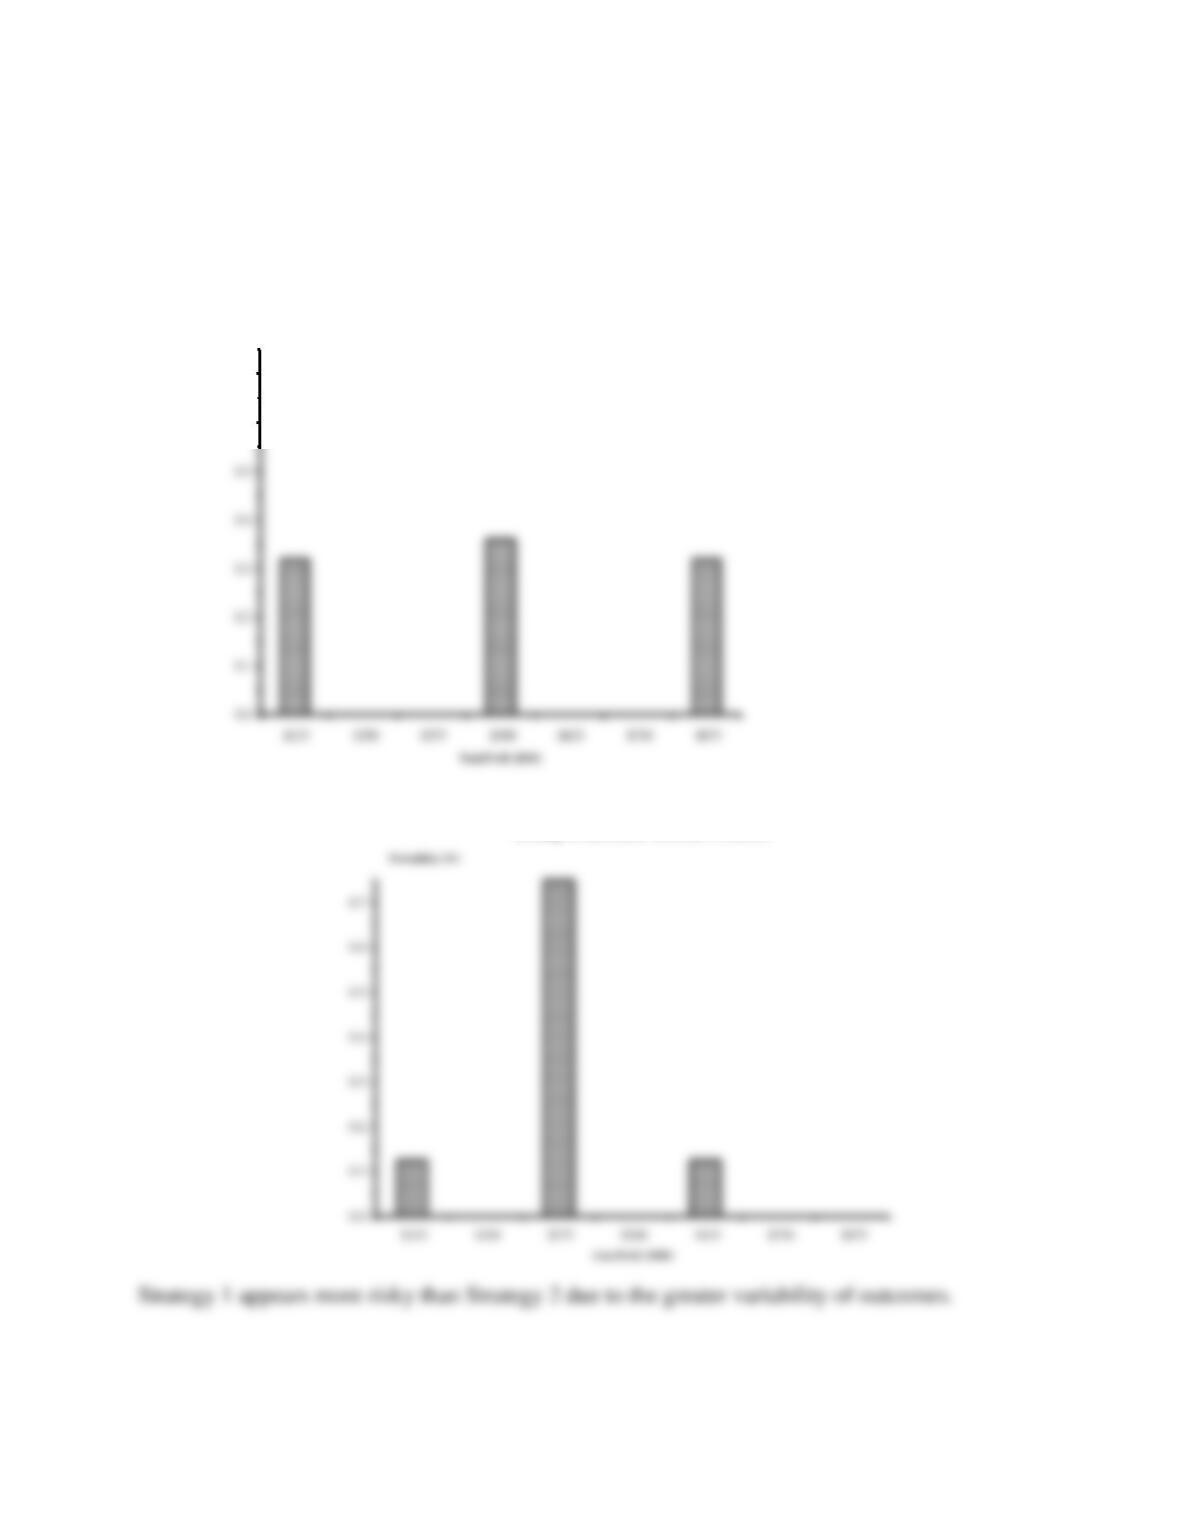
B.
Strategy 1: Consumer Television Promotion
0.6
0.7
Probability (Pr)
Strategy 2: Distributor Oriented Promotion
516 Chapter 16
C.
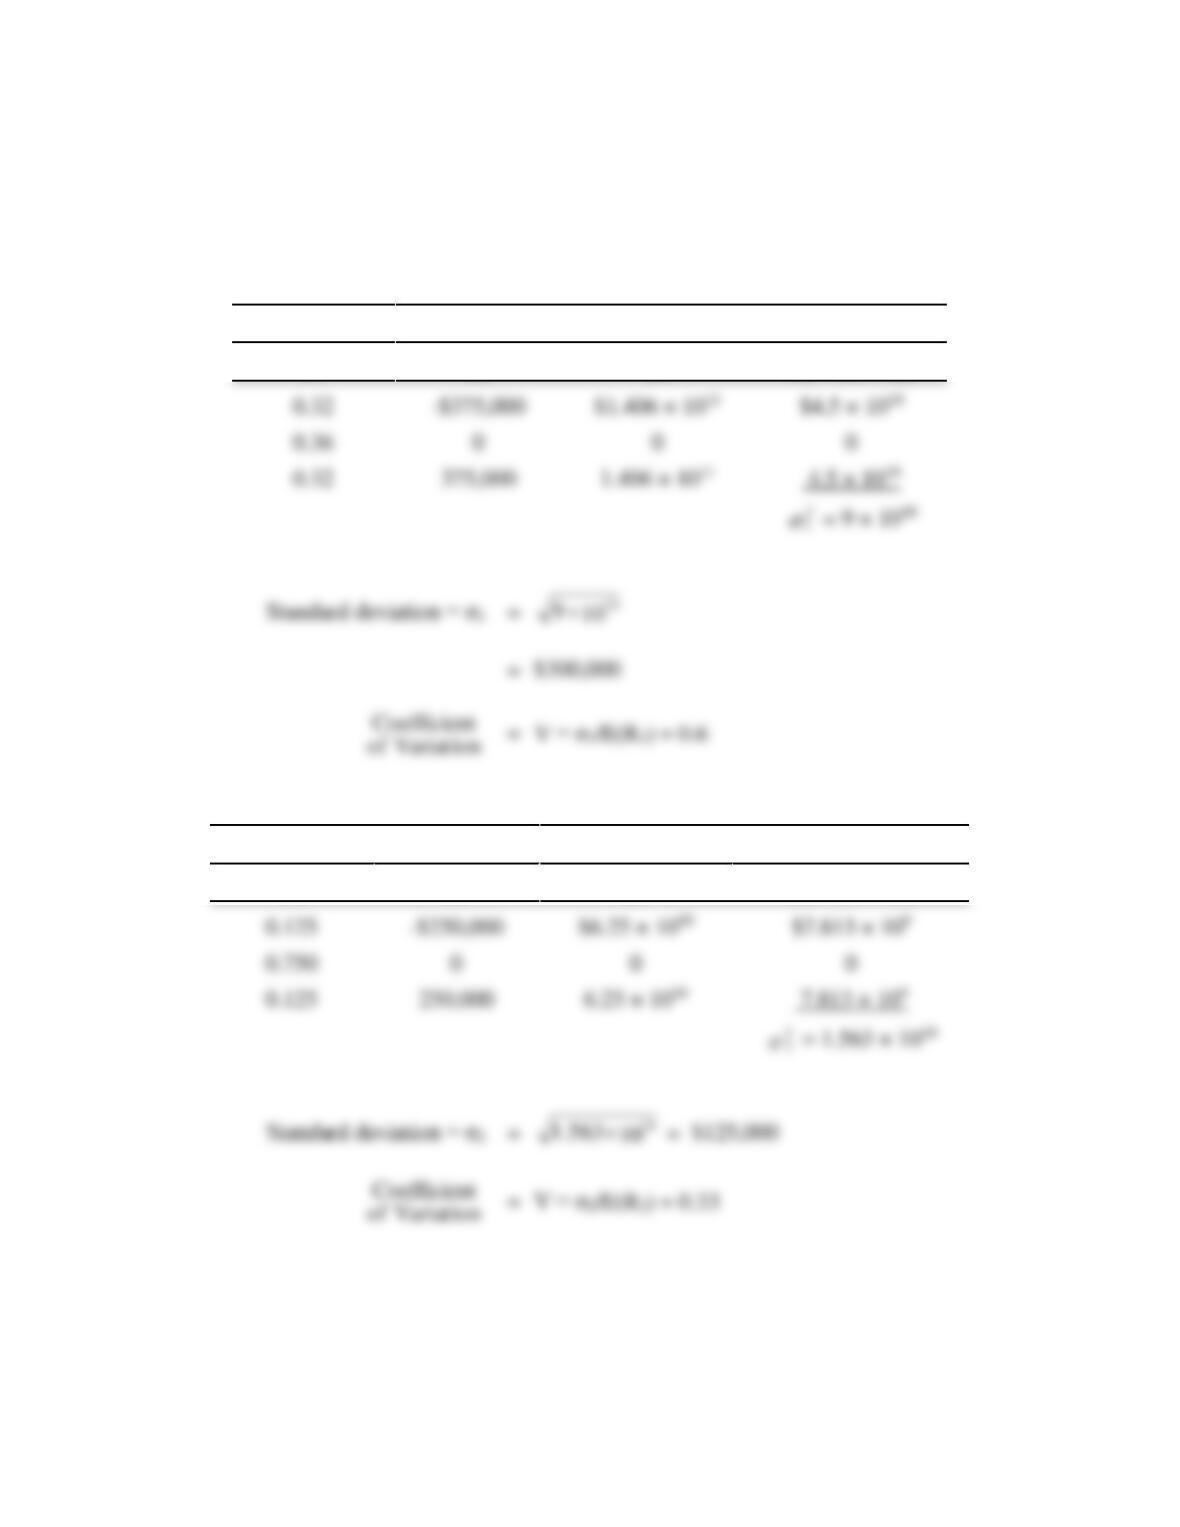
Strategy 1
Probability
Deviations
(Deviations)2
Variance
(1)
(2)
(3)
(4) = (1) × (3)
Strategy 2
Probability
Deviations
(Deviations)2
Variance
(1)
(2)
(3)
(4) = (1) × (3)
A comparison of the standard deviations and coefficients of variation for each
strategy confirms that Strategy 1 is the more risky promotional strategy.
Risk Analysis 517
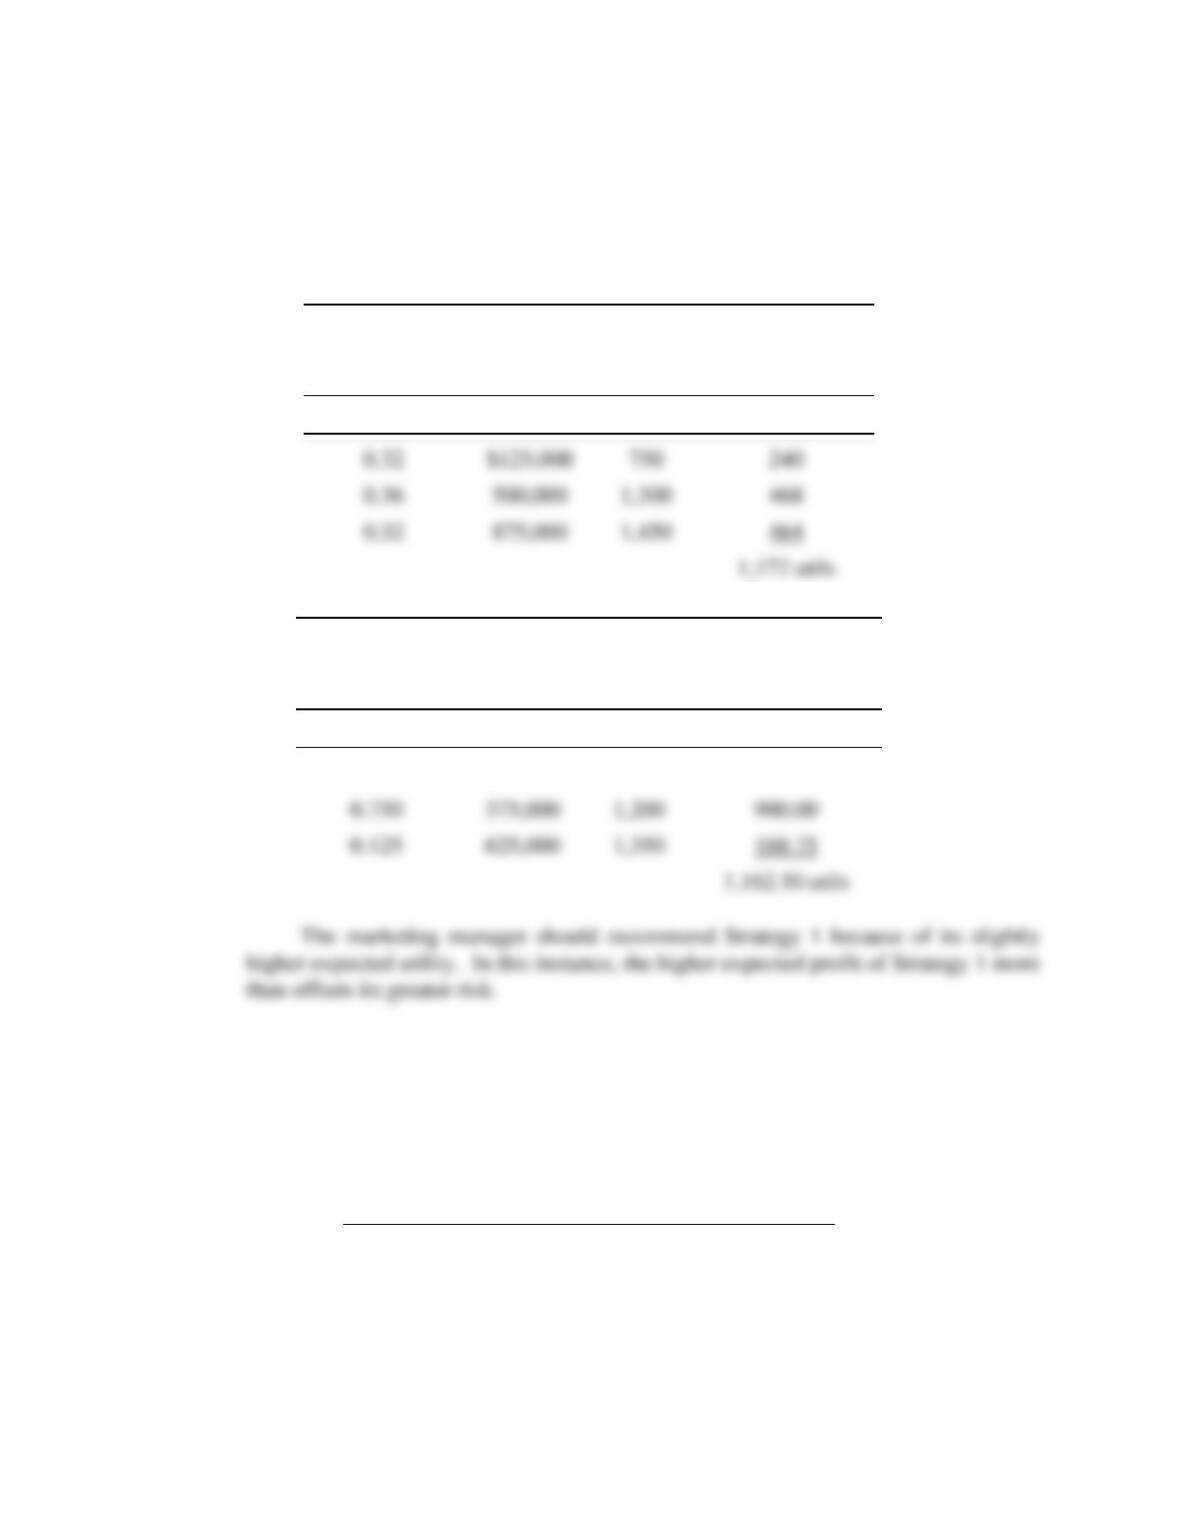
D.
Strategy 1
Probability
Profits
Utils
Expected
Utility
(1)
(2)
(3)
(4) = (3) × (1)
Strategy 2
Probability
Profits
Utils
Expected
Utility
(1)
(2)
(3)
(4) = (3) × (1)
0.125
$125,000
750
93.75
P16.6 Risk-Adjusted Discount Rates. One-Hour Dryclean, Inc., is replacing an obsolete dry
cleaning machine with one of two innovative pieces of equipment. Alternative 1 requires
a current investment outlay of $25,373, whereas alternative 2 requires an outlay of
$24,199. The following cash flows (cost savings) will be generated each year over the
new machines’ four-year lives:
Probability
Cash Flow
Alternative 1
0.18
$5,000
0.64
10,000
0.18
15,000
Alternative 2
0.125
$8,000
$125,000
750
240
518 Chapter 16
0.75
10,000
0.125
12,000
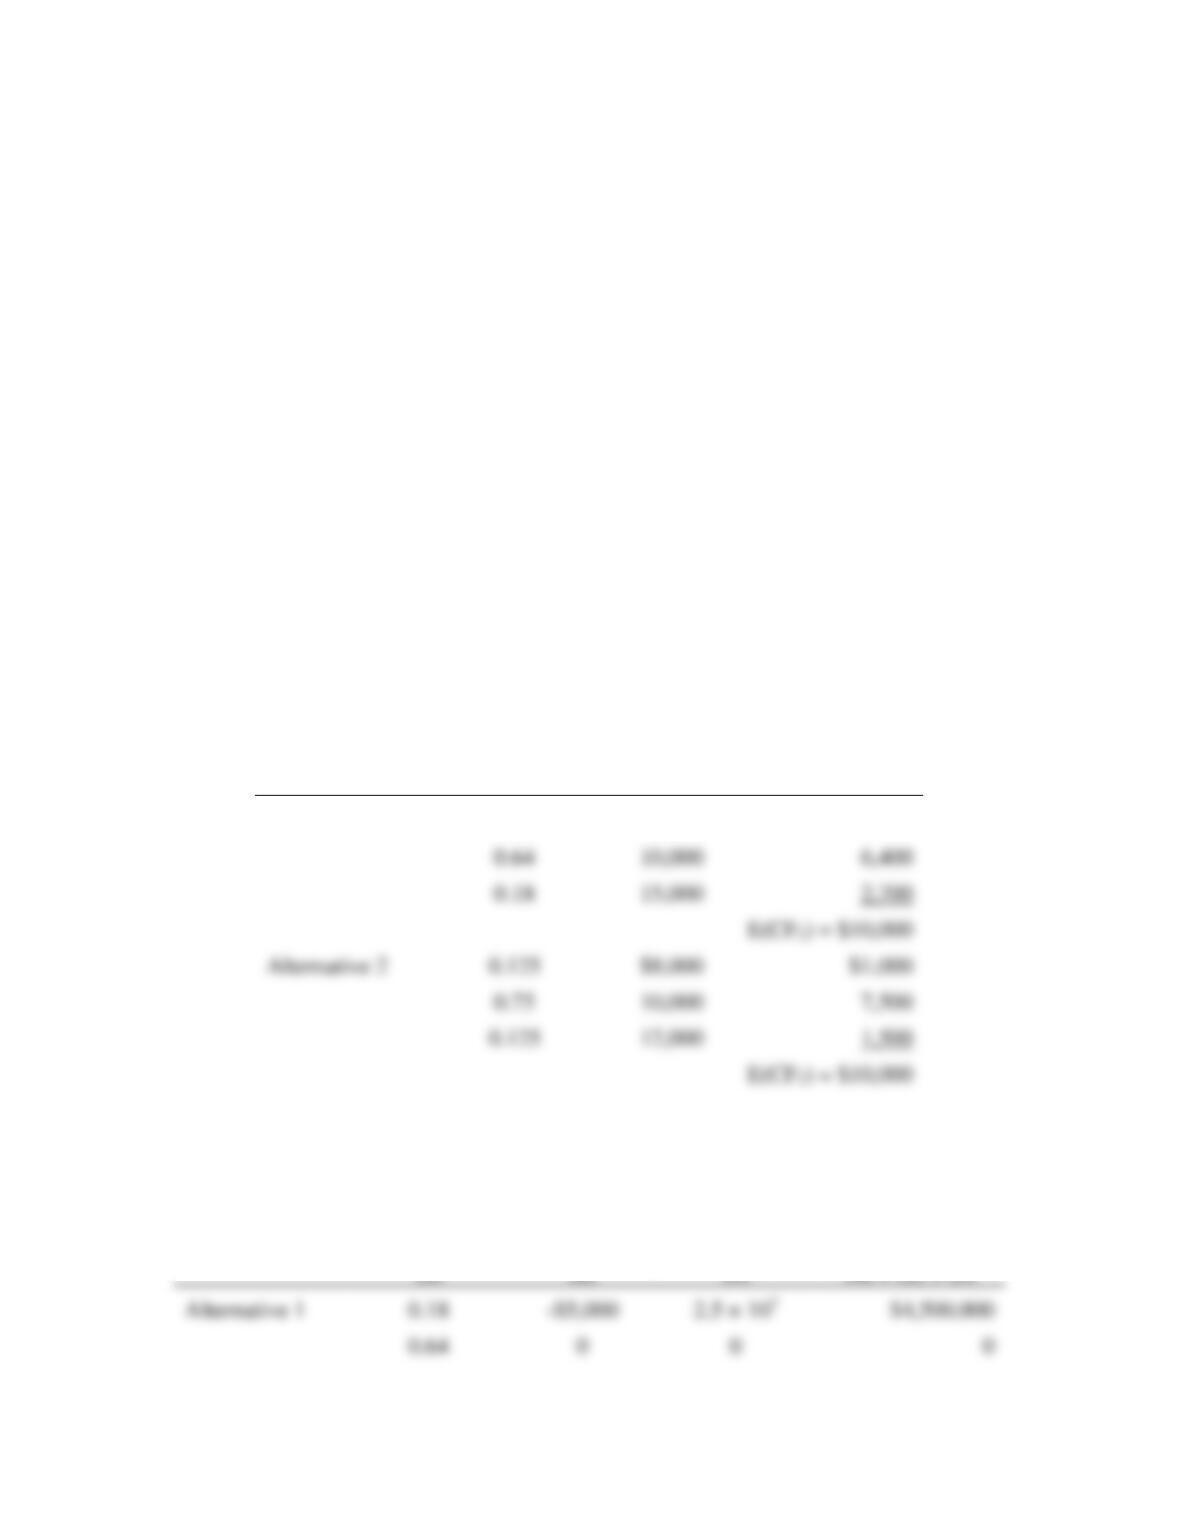
A. Calculate the expected cash flow for each investment alternative.
B. Calculate the standard deviation of cash flows (risk) for each investment
alternative.
C. The firm will use a discount rate of 12 percent for the cash flows with a higher
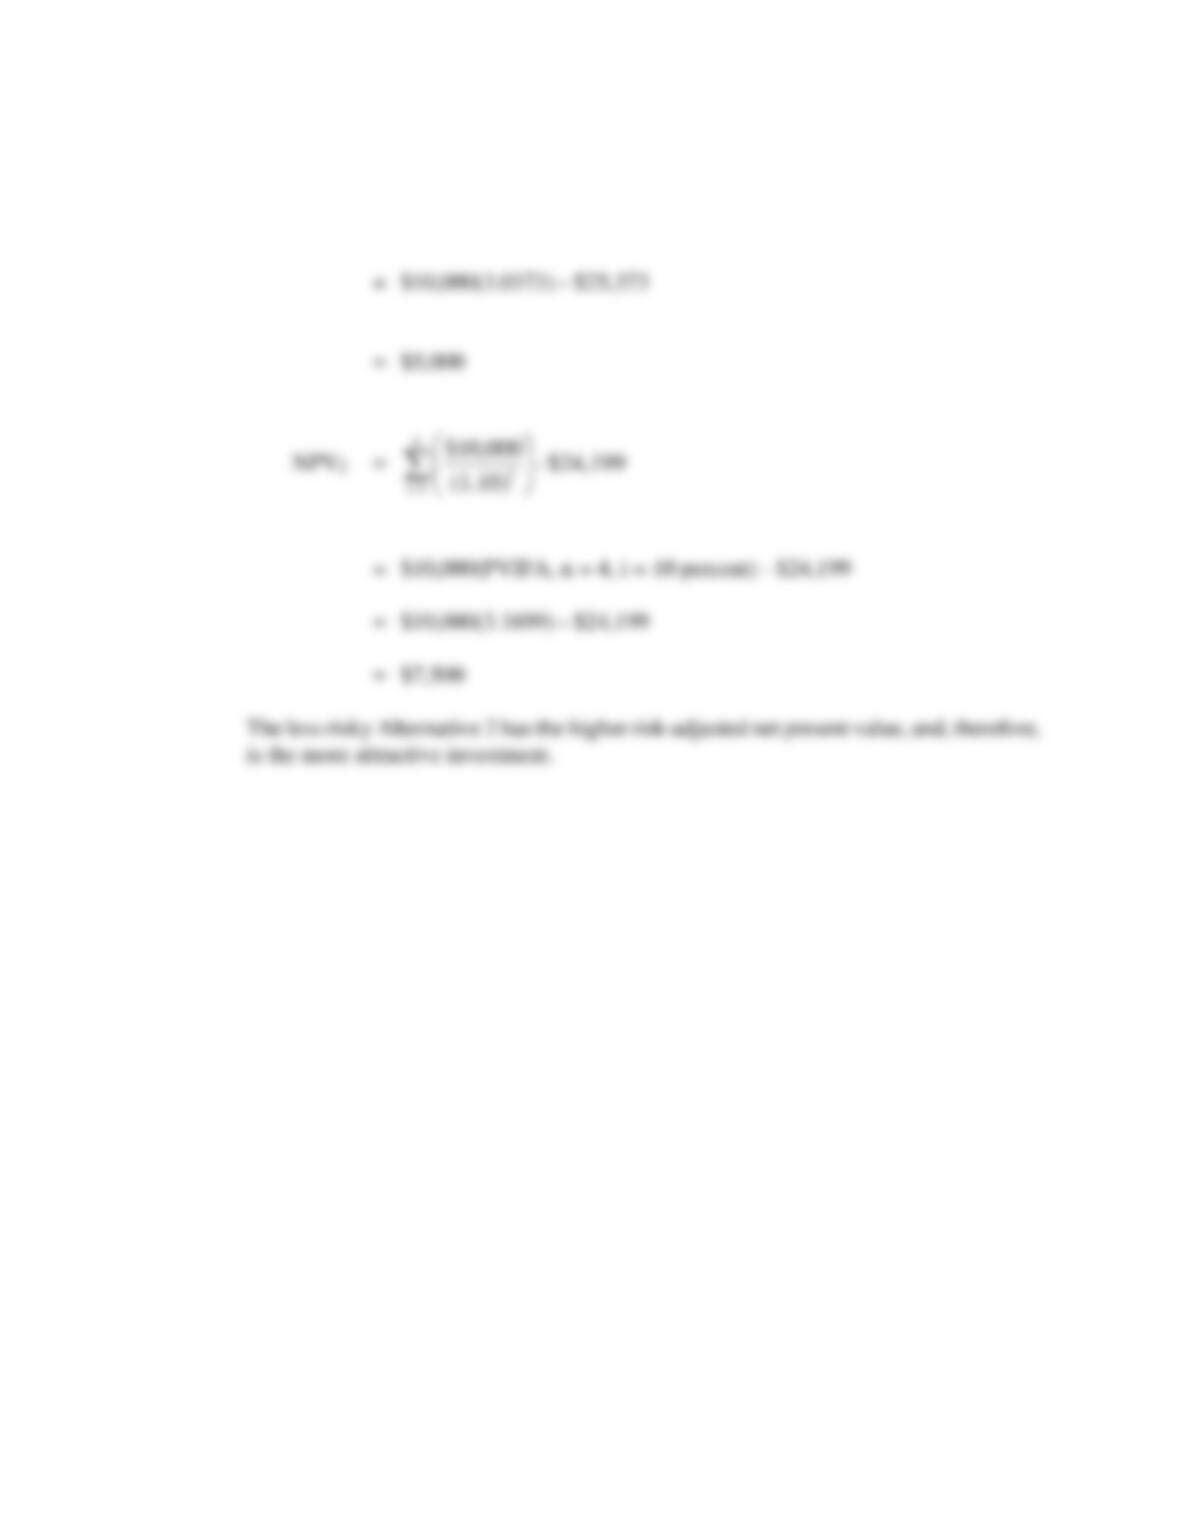
degree of dispersion and a 10 percent rate for the less risky cash flows. Calculate
the expected net present value for each investment. Which alternative should be
chosen?
P16.6 SOLUTION
A. Expected values of cash flows
Probability
(1)
Cash Flow
(2)
(3) = (1) × (2)
Alternative 1
0.18
$5,000
$900
B. The relevant standard deviations of cash flows are:
Probability
(1)
Deviation
(2)
Deviation2
(3)
(4) = (1) × (3)
Alternative 1
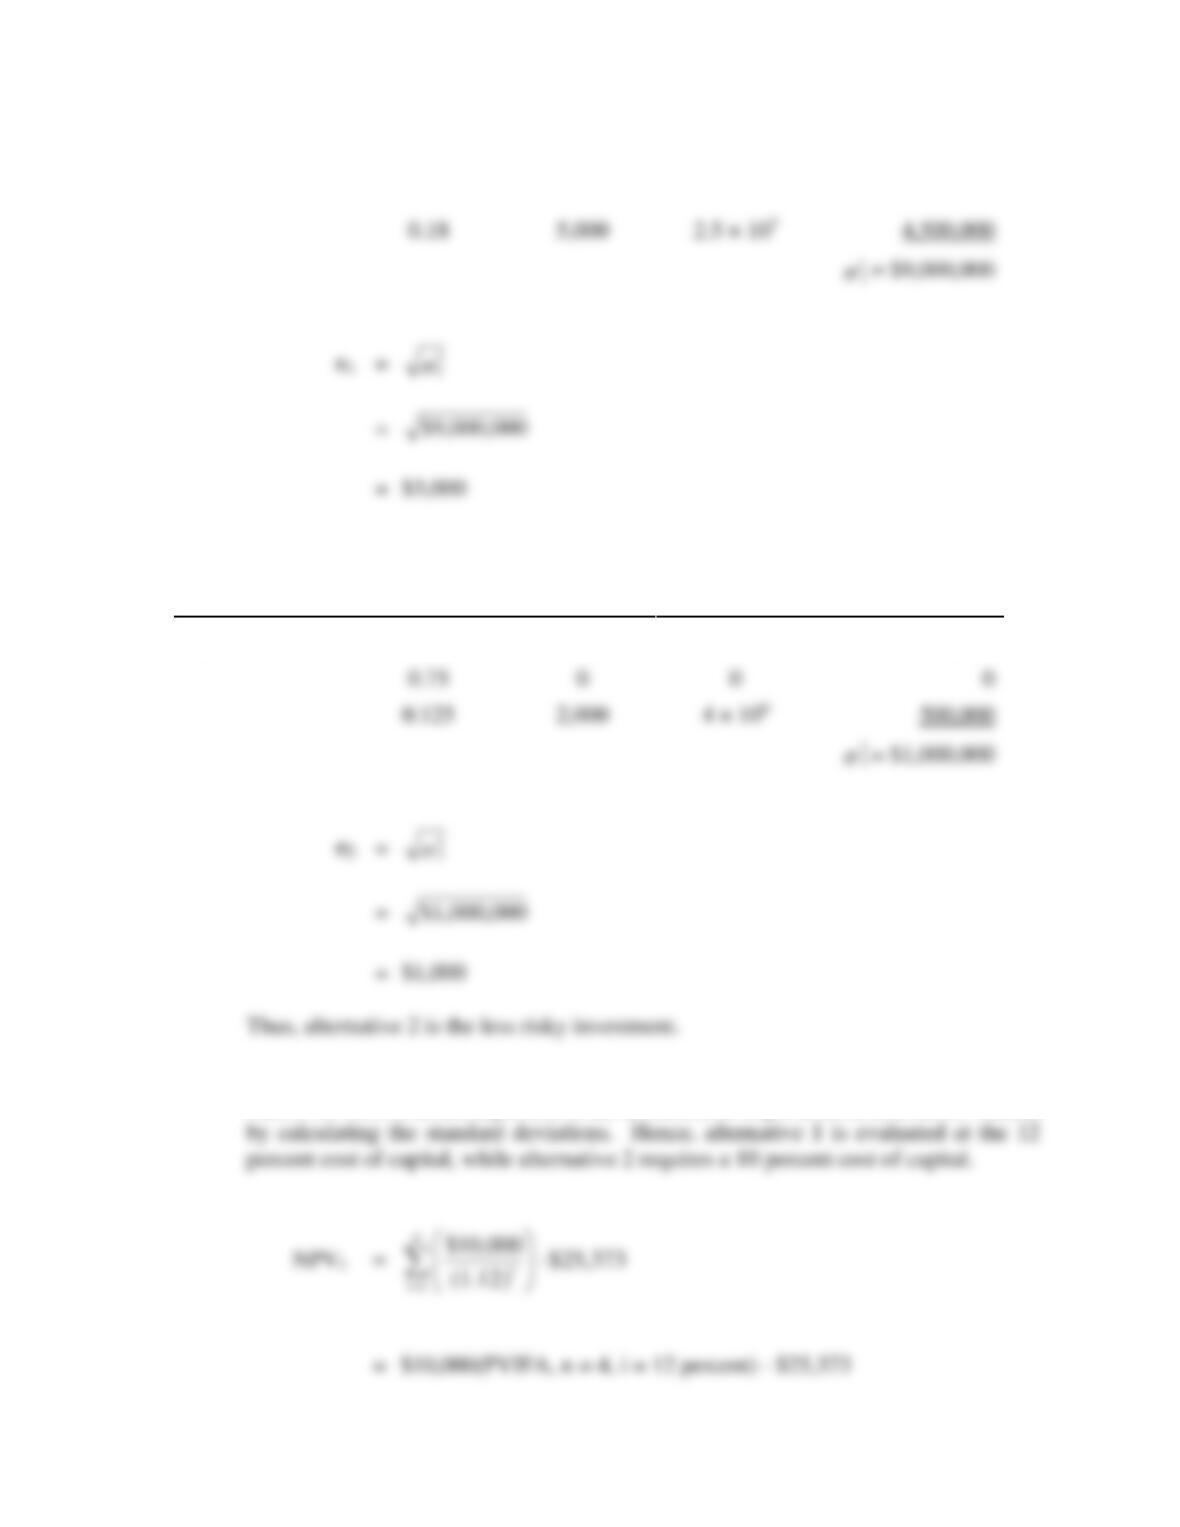
Risk Analysis 519
Probability
(1)
Deviation
(2)
Deviation2
(3)
(4) = (1) × (3)
Alternative 2
0.125
-$2,000
4 × 10⁶
$500,000
C. Alternative 1 is riskier because it has the greater variability in its probable cash flows.
This is obvious from an inspection of the distributions of possible returns and is verified
520 Chapter 16
P16.7 Certainty Equivalents. Recently, the housing market suffered the worst slump in nearly
two decades. Hot housing markets like Boston, Ft. Lauderdale Florida, and Washington
DC cooled as rising interest rates and tightened lending standards eliminated lots of
potential buyers. With job losses in the auto industry, the housing downturn was
especially serious in Detroit and surrounding areas. Suppose a real estate speculator
seeking to profit from the downturn bought a pool of home mortgages for $1 million on
the expectation of quickly selling them to out-of-town investors for $1.5 million. If the
deal falls through, the speculator would be able to just as quickly dump the pool of home
mortgages in the secondary market for $800,000.
A. Calculate the speculator’s expected payoff if there is a 50/50 chance of successfully
selling the pool of home mortgages to out-of-town investors.
B. Calculate the certainty equivalent adjustment factor for this investment. Is the
speculator’s decision to buy the pool of home mortgages consistent with risk
adverse behavior?
P16.7 SOLUTION
A. If there is a 50/50 chance of successfully selling the bundle of home mortgages to out-
of-town investors, the speculator’s expected payoff is:
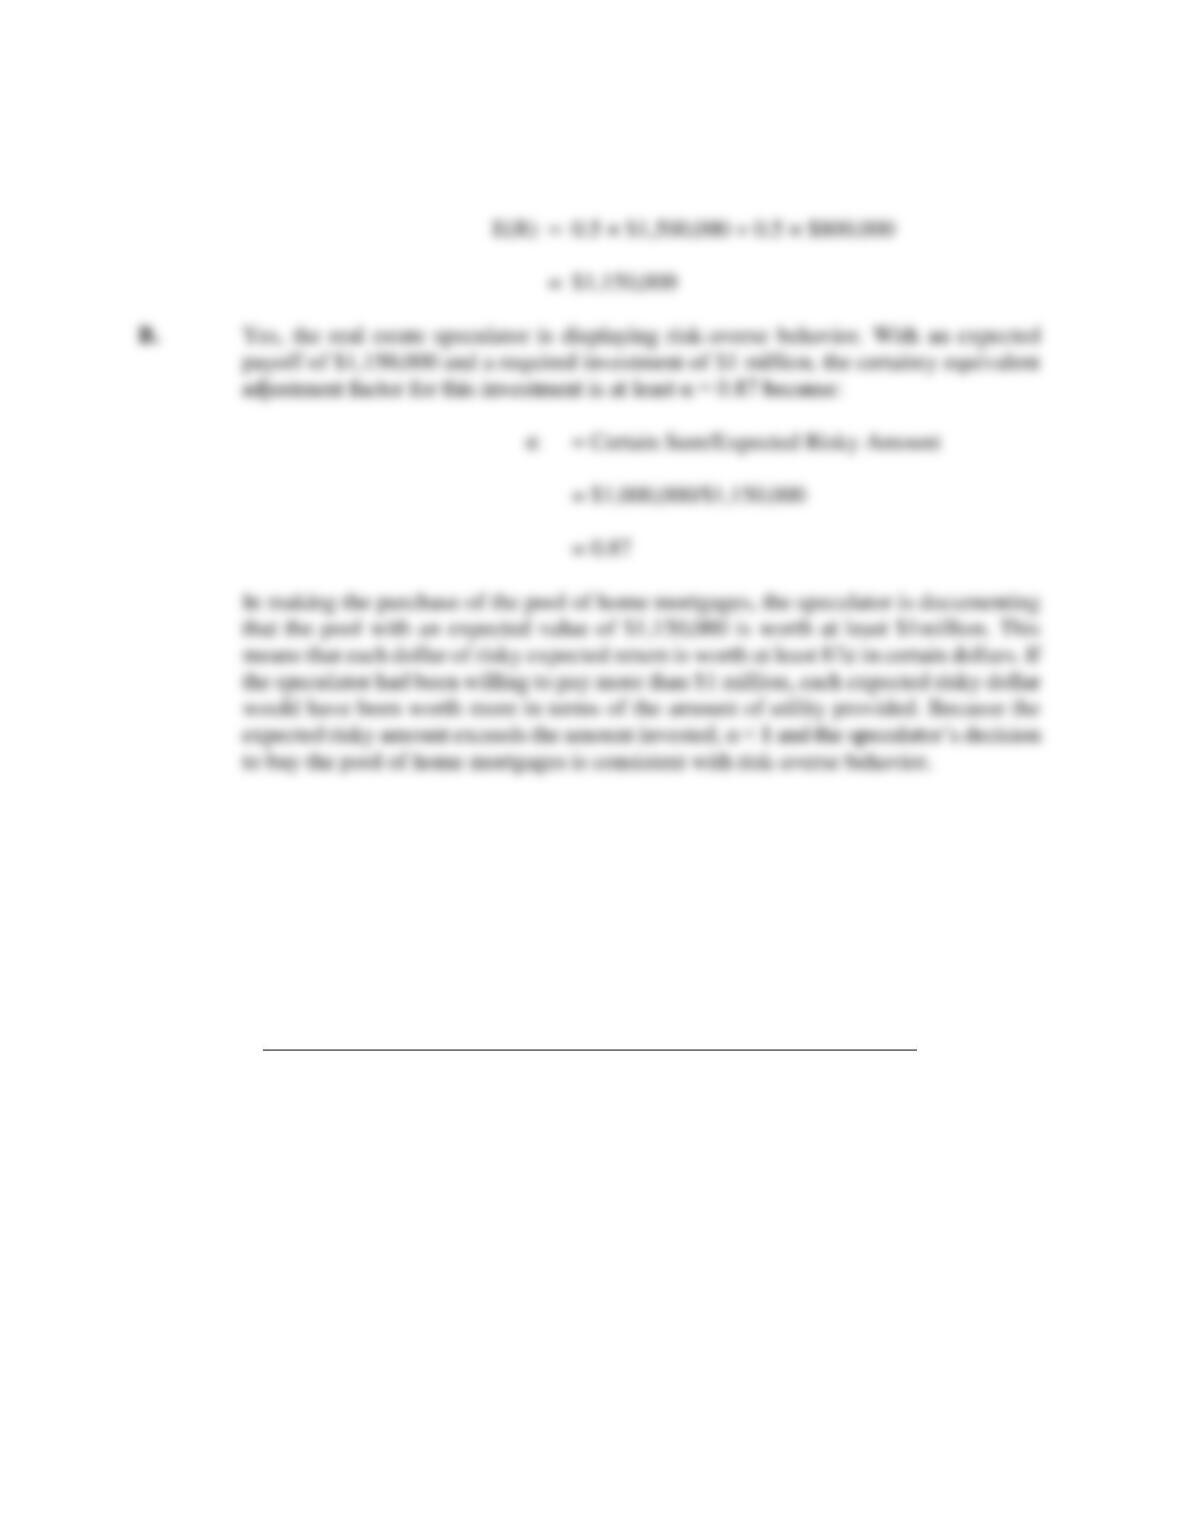
Risk Analysis 521
P16.8 Certainty Equivalent Method. Tex-Mex, Inc., is a rapidly growing chain of Mexican
food restaurants. The company has a limited amount of capital for expansion and must
carefully weigh available alternatives. Currently, the company is considering opening
restaurants in Santa Fe or Albuquerque, New Mexico. Projections for the two potential
outlets are as follows:
City
Outcome
Annual Profit
Contribution
Probability
Albuquerque
Failure
$100,000
0.5
Success
200,000
0.5
Santa Fe
Failure
$60,000
0.5
Success
340,000
0.5
Each restaurant would require a capital expenditure of $1.4 million, plus land
acquisition costs of $1million for Albuquerque and $2 million for Santa Fe. The
company uses the 5 percent yield on risk-free U.S. Treasury bills to calculate the risk-
free annual opportunity cost of investment capital.
522 Chapter 16
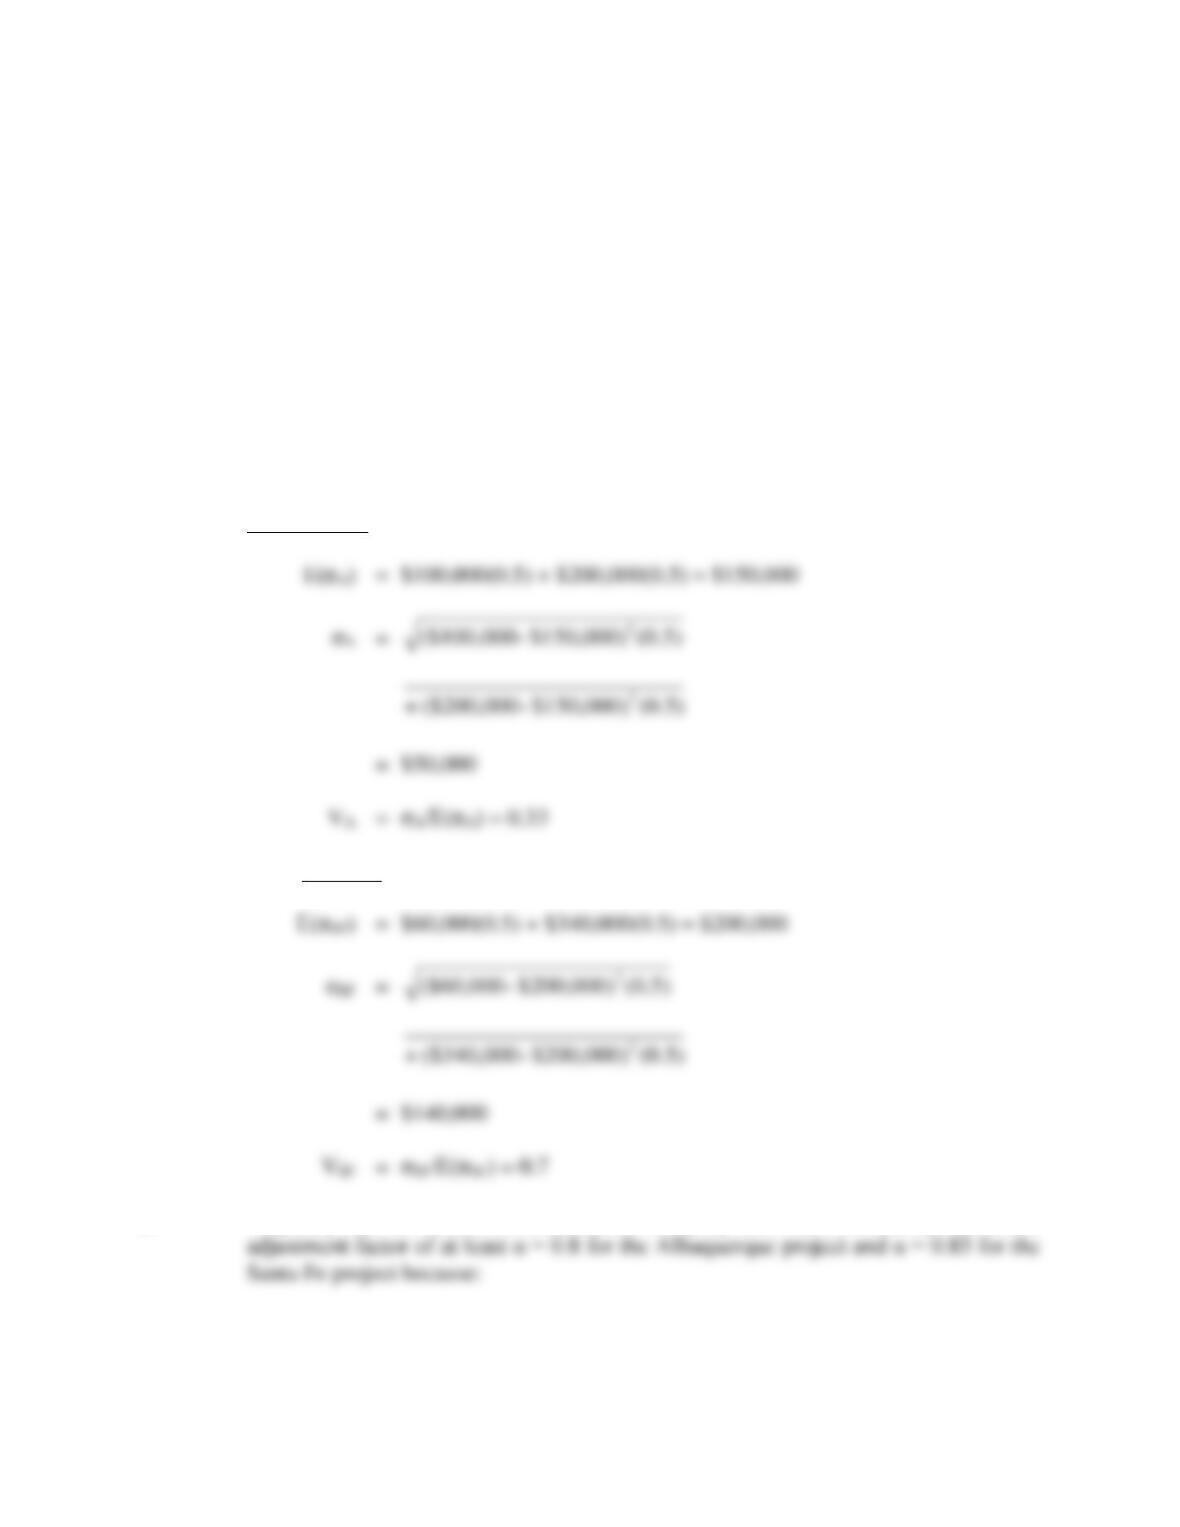
A. Calculate the expected value, standard deviation, and coefficient of variation for
each outlet’s profit contribution.
B. Calculate the minimum certainty equivalent adjustment factor for each
restaurant’s cash flows that would justify investment in each outlet.
C. Assuming that the management of Tex-Mex is risk averse and uses the certainty
equivalent method in decision making, which is the more attractive outlet? Why?
P16.8 SOLUTION
A. Albuquerque
Santa Fe
B. To justify each investment alternative, the company must have a certainty equivalent
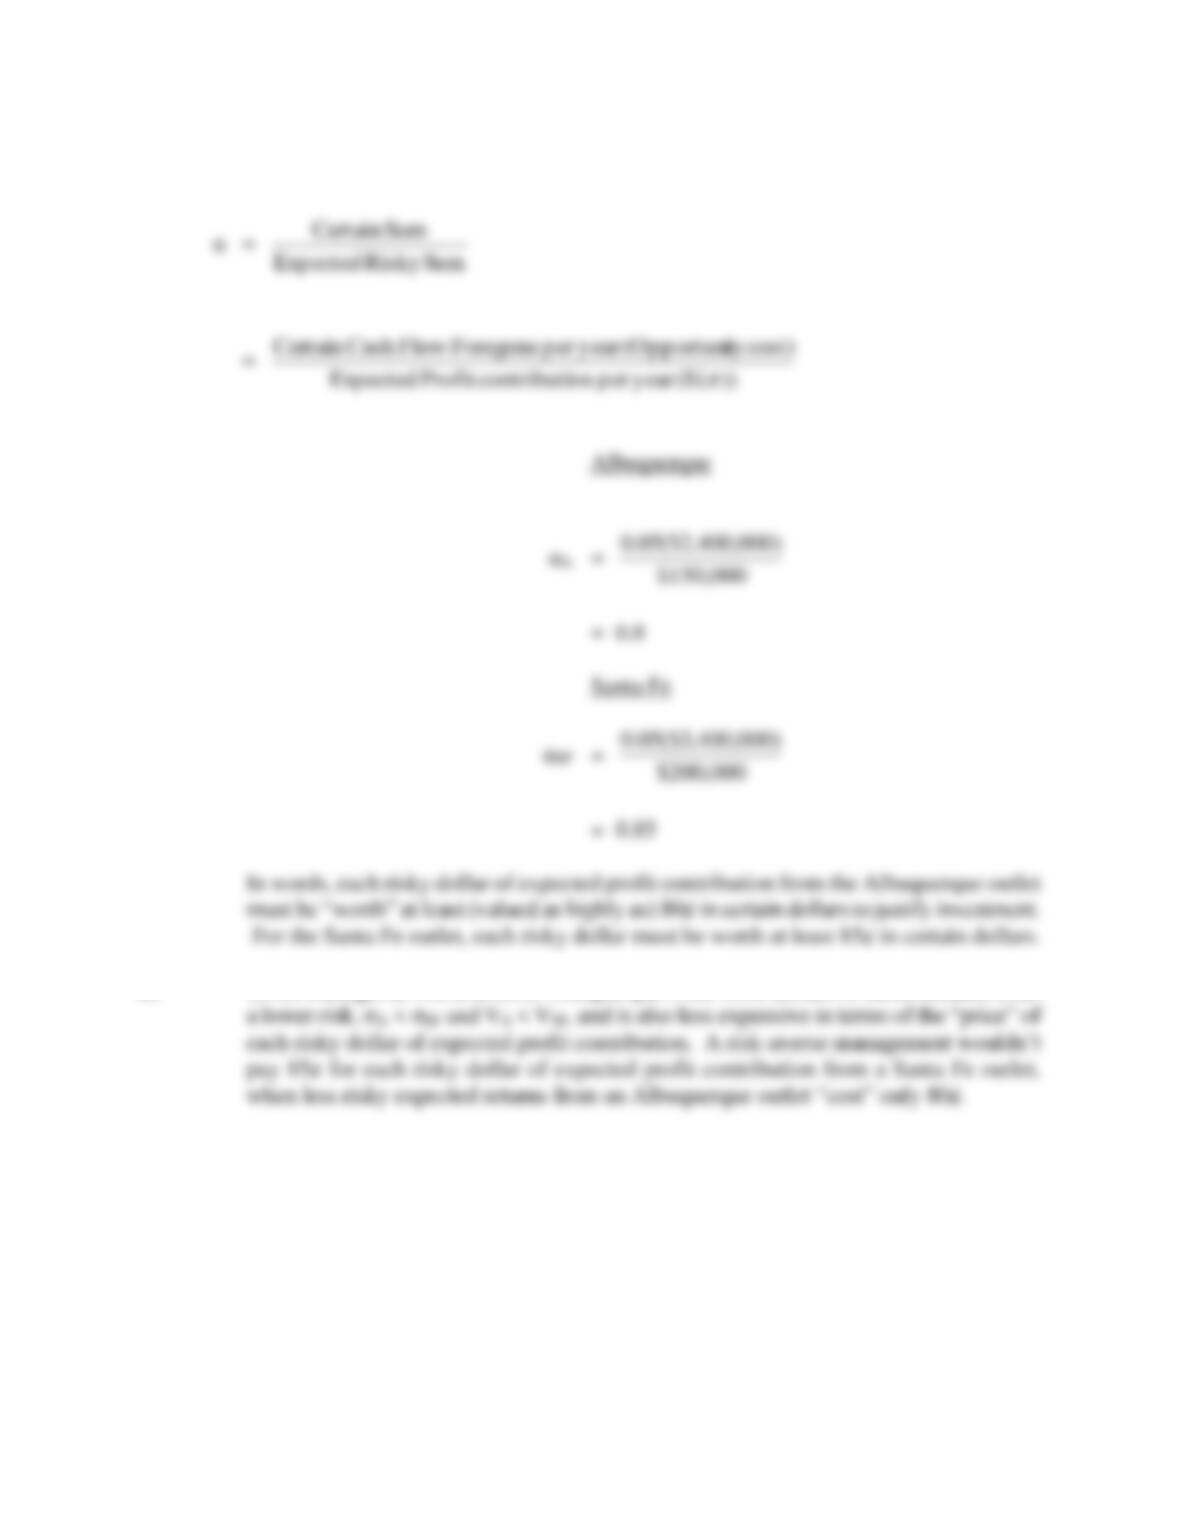
Risk Analysis 523
C. Given managerial risk aversion, Albuquerque is the more attractive outlet because it has
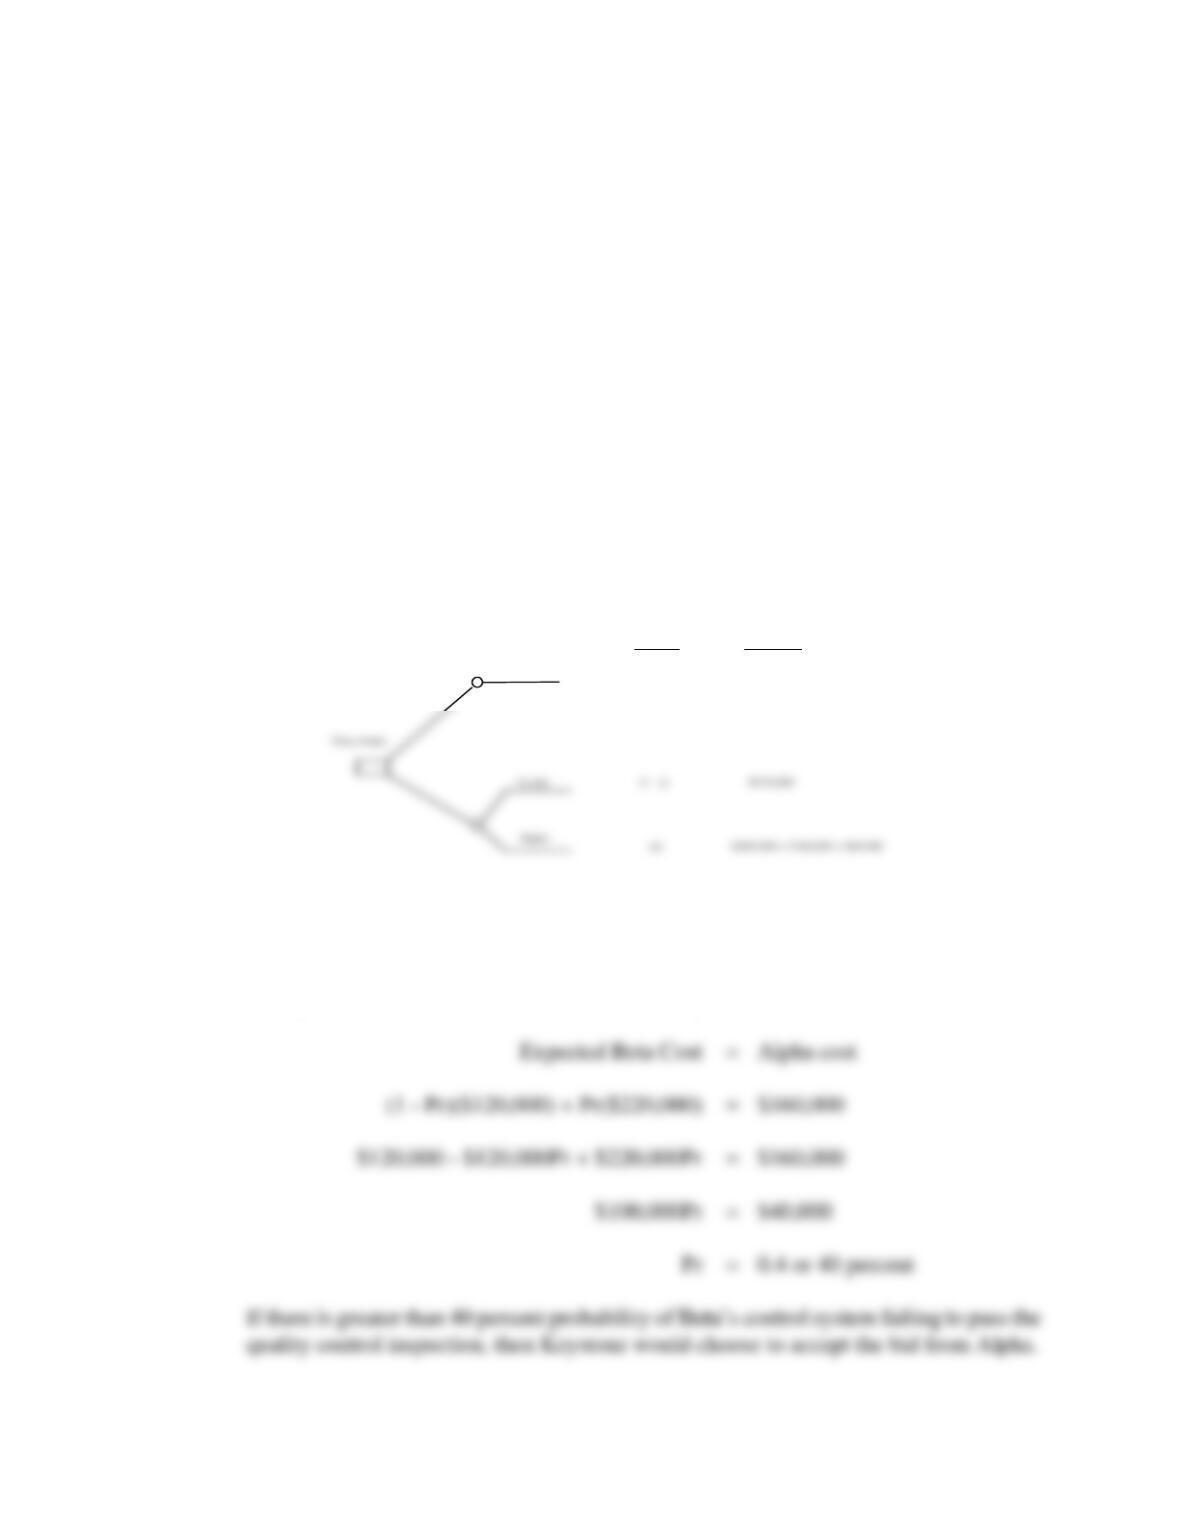
P16.9 Decision Trees. Keystone Manufacturing, Inc., is analyzing a new bid to supply the
company with electronic control systems. Alpha Corporation has been supplying the
systems and Keystone is satisfied with its performance. However, a bid has just been
received from Beta Controls, Ltd., a firm that is aggressively marketing its products.
Beta has offered to supply systems for a price of $120,000. The price for the Alpha
system is $160,000. In addition to an attractive price, Beta offers a money-back
guarantee. That is, if Beta’s systems do not match Alpha’s quality, Keystone can reject
and return them for a full refund. However, if it must reject the machines and return
them to Beta, Keystone will suffer a delay costing the firm $60,000.
524 Chapter 16
A. Construct a decision tree for this problem and determine the maximum probability
that Keystone could assign to rejection of the Beta system before it would reject
that firm’s offer, assuming that it decides on the basis of minimizing expected
costs.
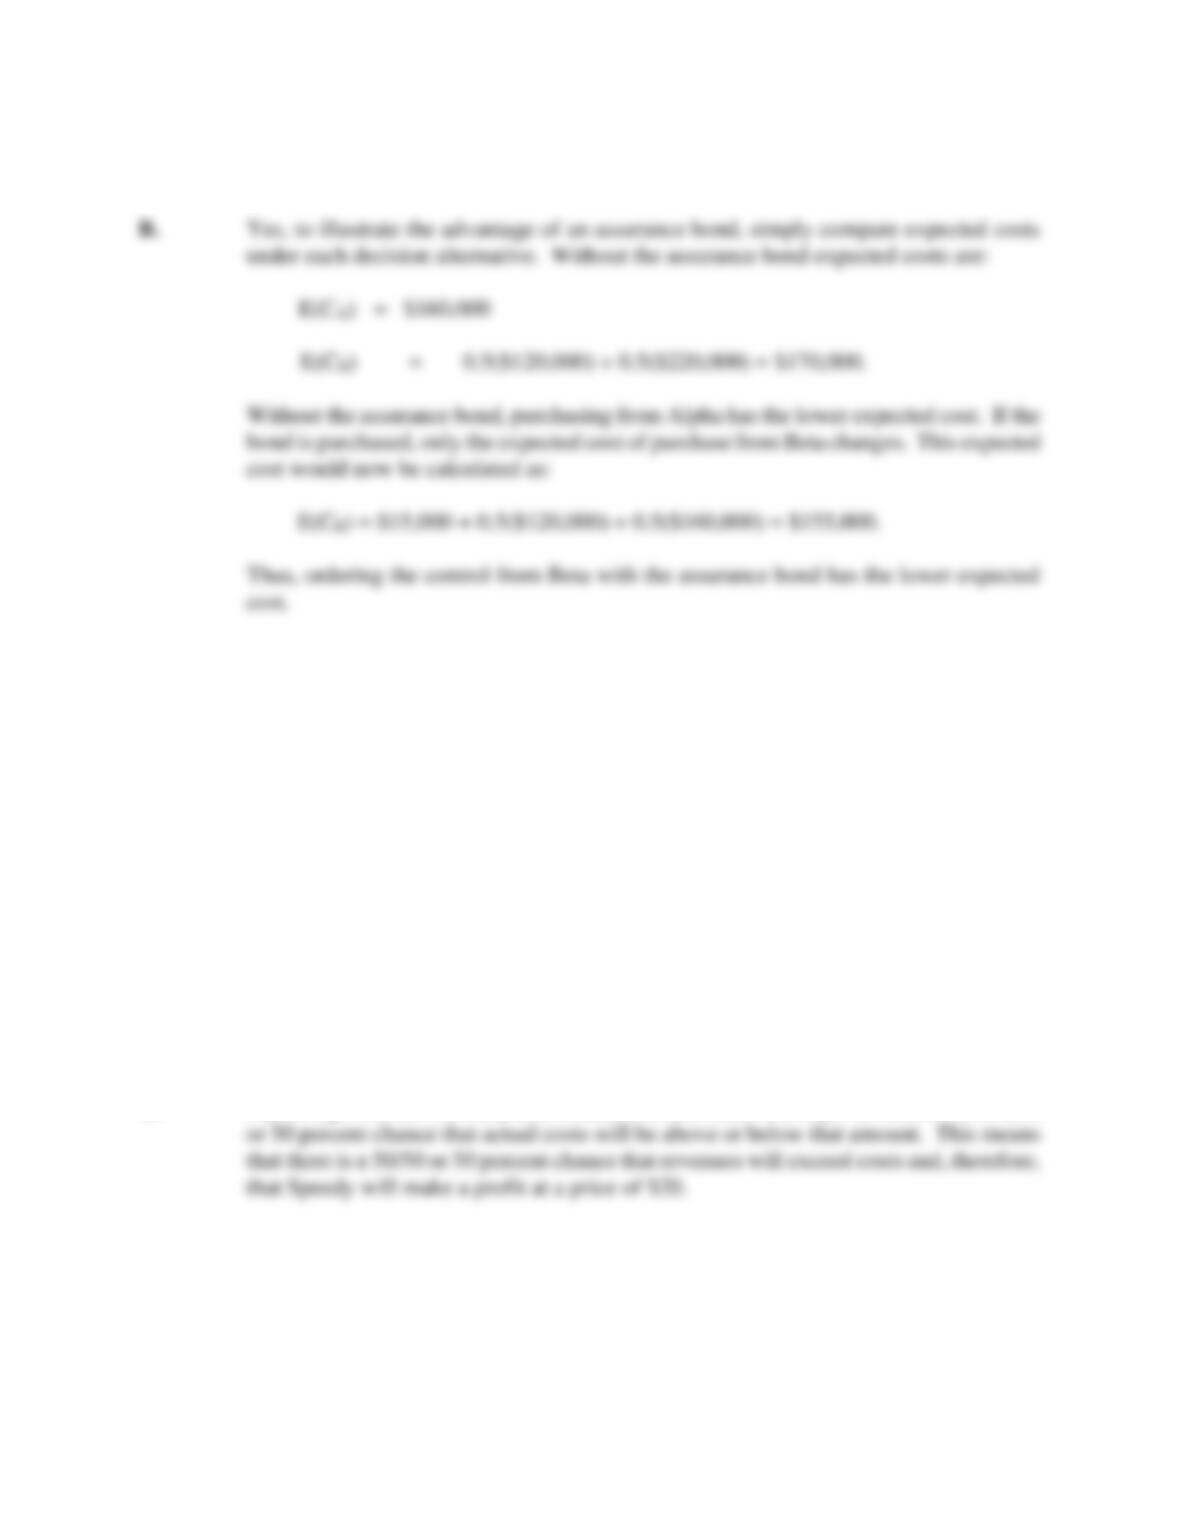
B. Assume that Keystone assigns a 50 percent probability of rejection to Beta
Controls. Would Keystone be willing to pay $15,000 for an assurance bond that
would pay $60,000 in the event that Beta Controls fails the quality check? (Use
the same objective as in part A.) Explain.
P16.9 SOLUTION
A. The decision tree for this decision problem is as follows:
Accept
Probabilit
System Cost
1.0
$160,000
The maximum probability of rejection that could be assigned to the Beta control system
is the probability that makes the expected cost equal for the two alternatives.
Risk Analysis 525
P16.10 Standard Normal Concept. Speedy Business Cards, Inc., supplies customized business
cards to commercial and individual customers. The company is preparing a bid to
supply cards to the Nationwide Realty Company, a large association of independent real
estate agents. Because paper, ink, and other costs cannot be determined precisely,
Speedy anticipates that costs will be normally distributed around a mean of $20 per unit
(each 500-card order) with a standard deviation of $2 per unit.
A. What is the probability that Speedy will make a profit at a price of $20 per unit?
B. Calculate the unit price necessary to give Speedy a 95 percent chance of making a
profit on the order.
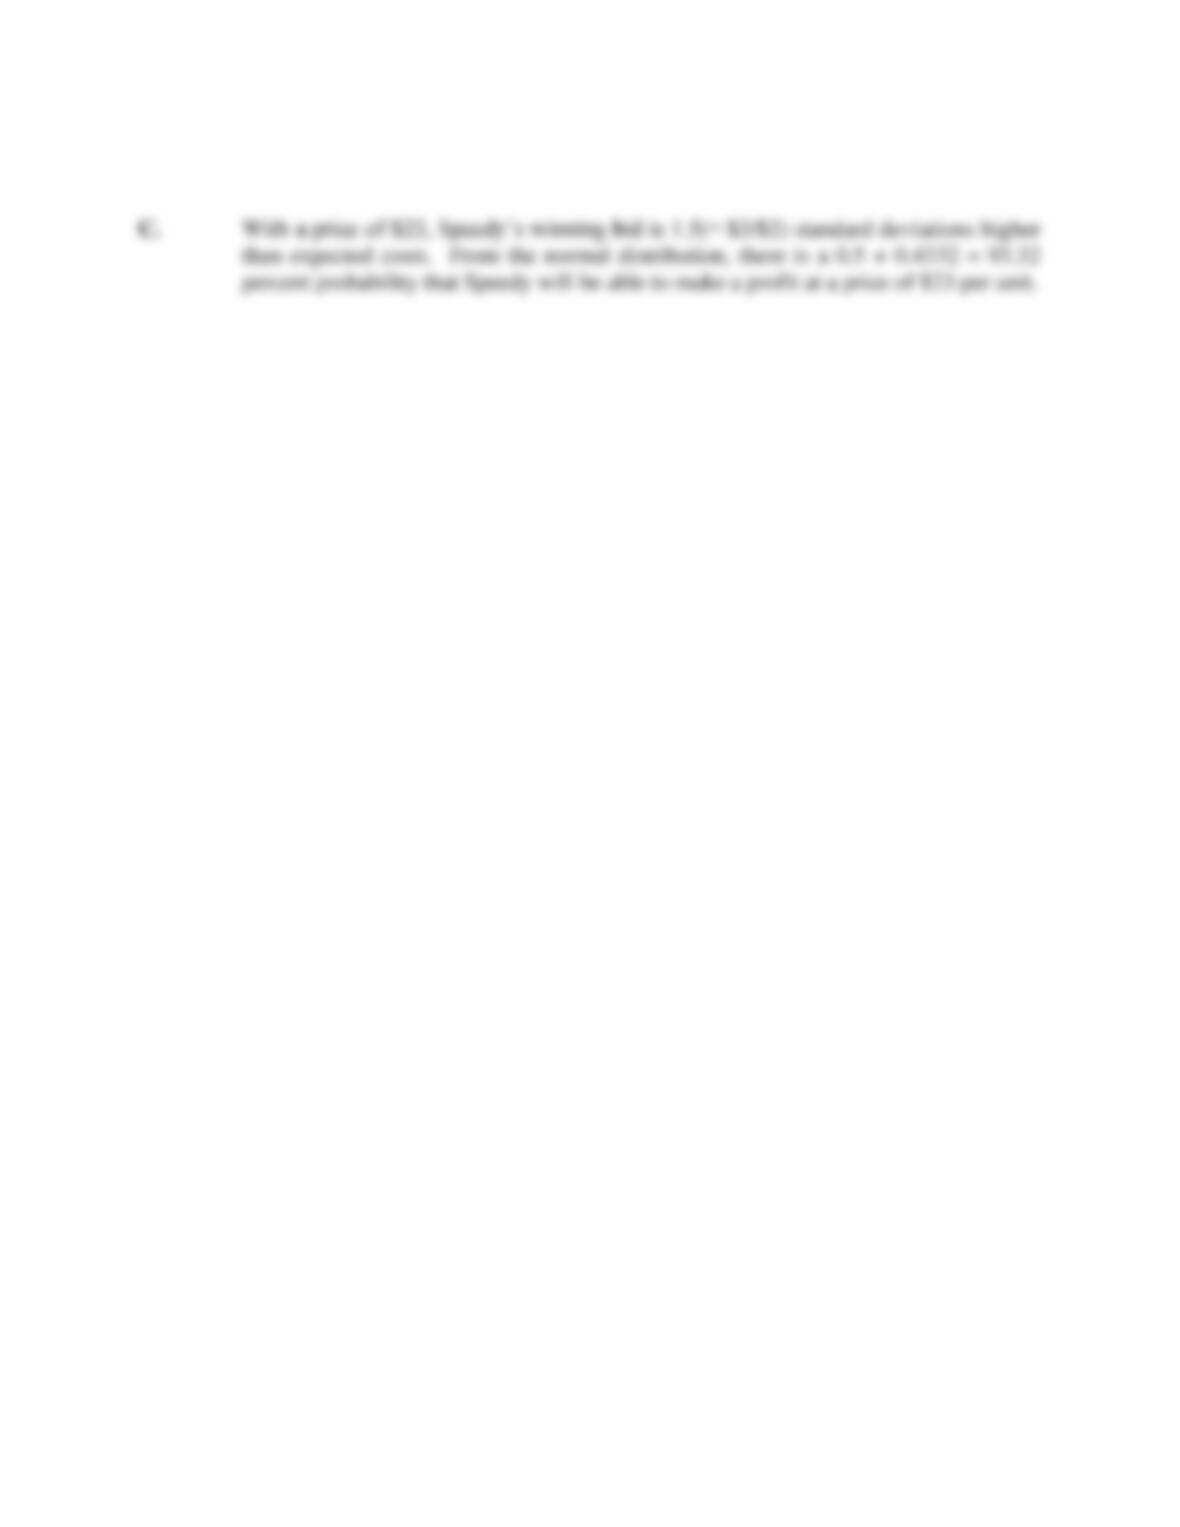
C. If Speedy submits a successful bid of $23 per unit, what is the probability that it
will make a profit?
P16.10 SOLUTION
A. If printing costs are normally distributed around a mean of $20 per unit, there is a 50/50
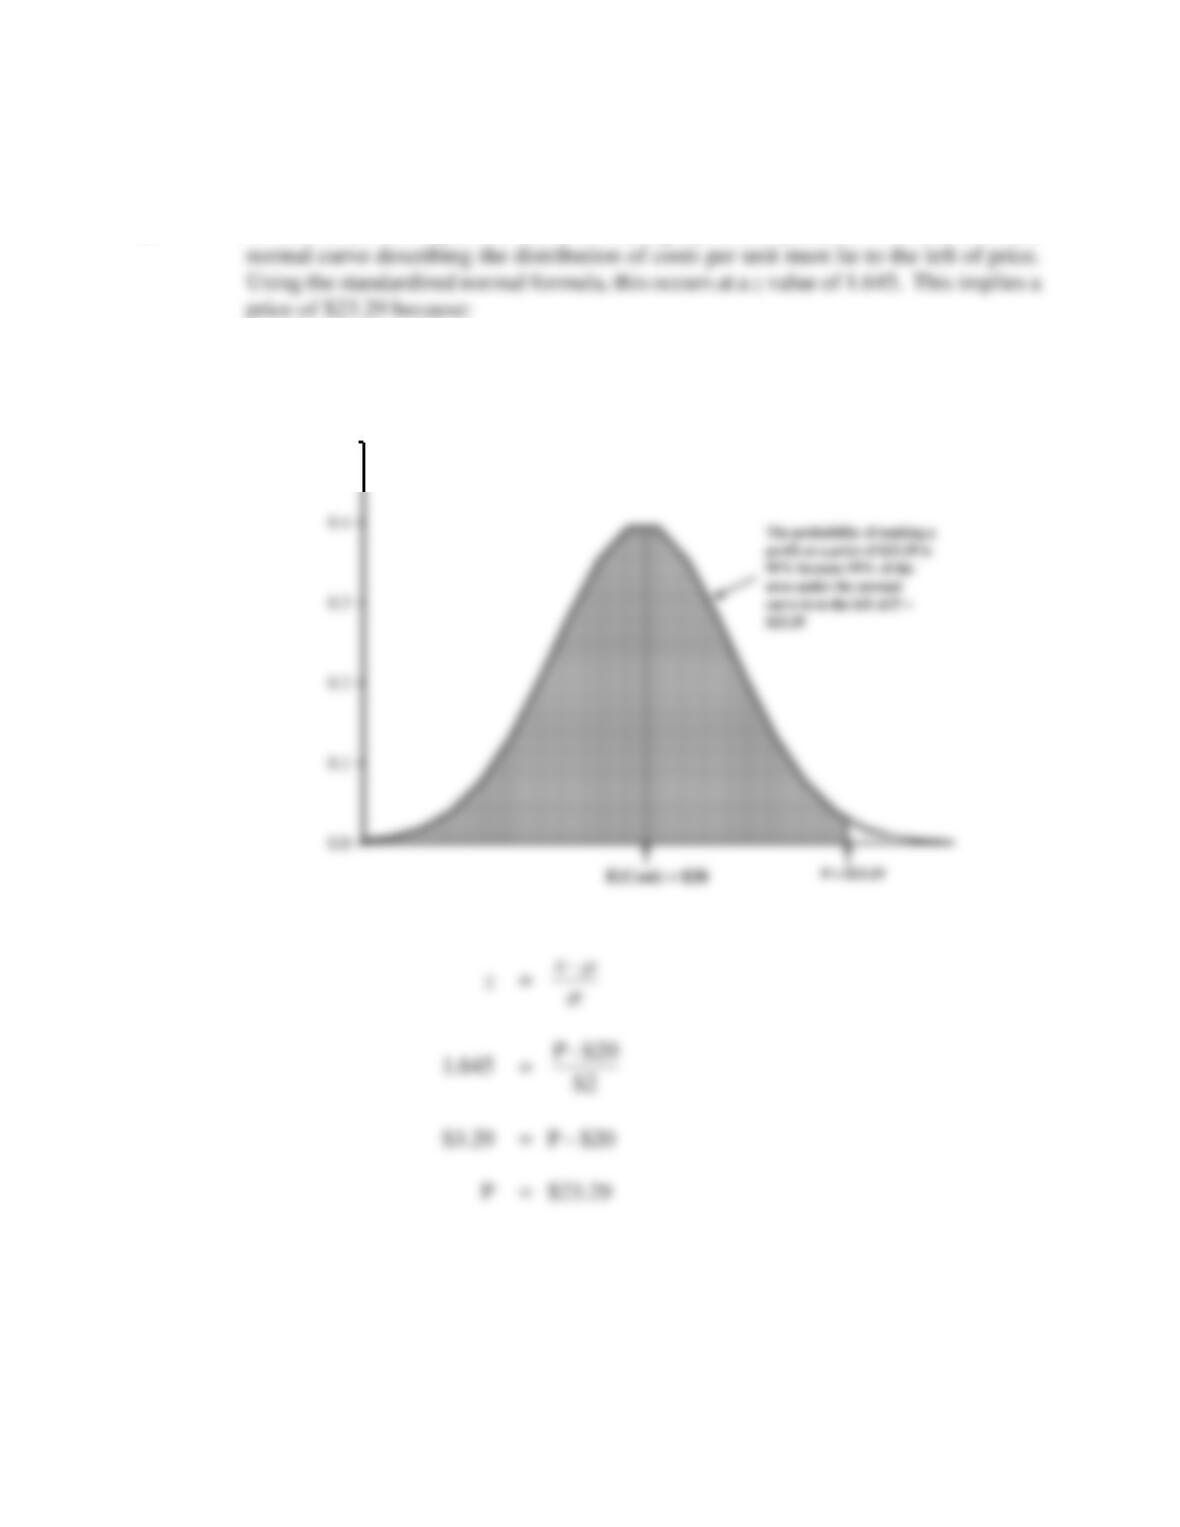
526 Chapter 16
B. In order to have a 95 percent chance of making a profit, 95 percent of the area under the
A Normal Distribution of Unit Costs
for Speedy Business Cards, Inc.
0.5
Probability (Pr)
Risk Analysis 527
528 Chapter 16
CASE STUDY FOR CHAPTER 16
Stock-Price Beta Estimation for Google, Inc.
Statisticians use the Greek letter beta to signify the slope coefficient in a linear relation. Financial
economists use this same Greek letter β to signify stock-price risk because betas are the slope
where Rit is the rate of return on an individual security i during period t, the intercept term is
described by the Greek letter α (alpha), the slope coefficient is the Greek letter β (beta) and signifies
systematic risk (as before), and the random disturbance or error term is depicted by the Greek letter
ε (epsilon). At any point in time, the random disturbance term ε has an expected value of zero, and
capital market, the CAPM asserts that investor rates of return would be solely determined by
systematic risk and both alpha and epsilon would equal zero, α = ε = 0.
As shown in Figure 16.8, managers and investors can estimate beta for individual stocks by
using a simple ordinary least-squares regression model. In this simple regression model, the
dependent Y-variable is the rate of return on an individual stock, and the independent X-variable is
than the Nasdaq market during this period. During a week when the Nasdaq market rose by 1
percent, GOOG rose by 0.9588 percent; during a week when the Nasdaq market fell by 1 percent,
Risk Analysis 529
GOOG fell by 0. 9588 percent. The slope coefficient β = 0.9588 is statistically significant (t = 5.32).
This means that returns on GOOG stock had a statistically significant relationship to returns for
the Nasdaq market during this period.
In the case of GOOG, the usefulness of beta as risk measures is undermined by the fact that
the simple linear model used to estimate stock-price beta fails to include other important systematic
influences on stock market volatility. In the case of GOOG, for example, R2 information shown in
Figure 16.8 indicates that only 36.1 percent of the total variation in GOOG returns can be explained
by variation in the Nasdaq market. This means that 63.9 percent of the variation in weekly returns
for GOOG stock is unexplained by such a simple regression model.
A. Describe some of the attributes of an ideal risk indicator for stock market investors.
B. On the Internet, go to Yahoo! Finance (or msnMoney) and download weekly price
CASE STUDY SOLUTION
A. An ideal measure of stock market risk would be simple to derive, accurate and consistent
from one year to another. With an ideal risk measure, investors are able to control the
risk exposure faced during volatile markets with well-targeted and well-timed investment
buy/sell decisions. For example, suppose an elderly investor wants to maintain an
530 Chapter 16
B. It will be a real eye-opener to students when they estimate stock-price beta for GOOG
over a more recent time period using weekly returns and compare those results with the
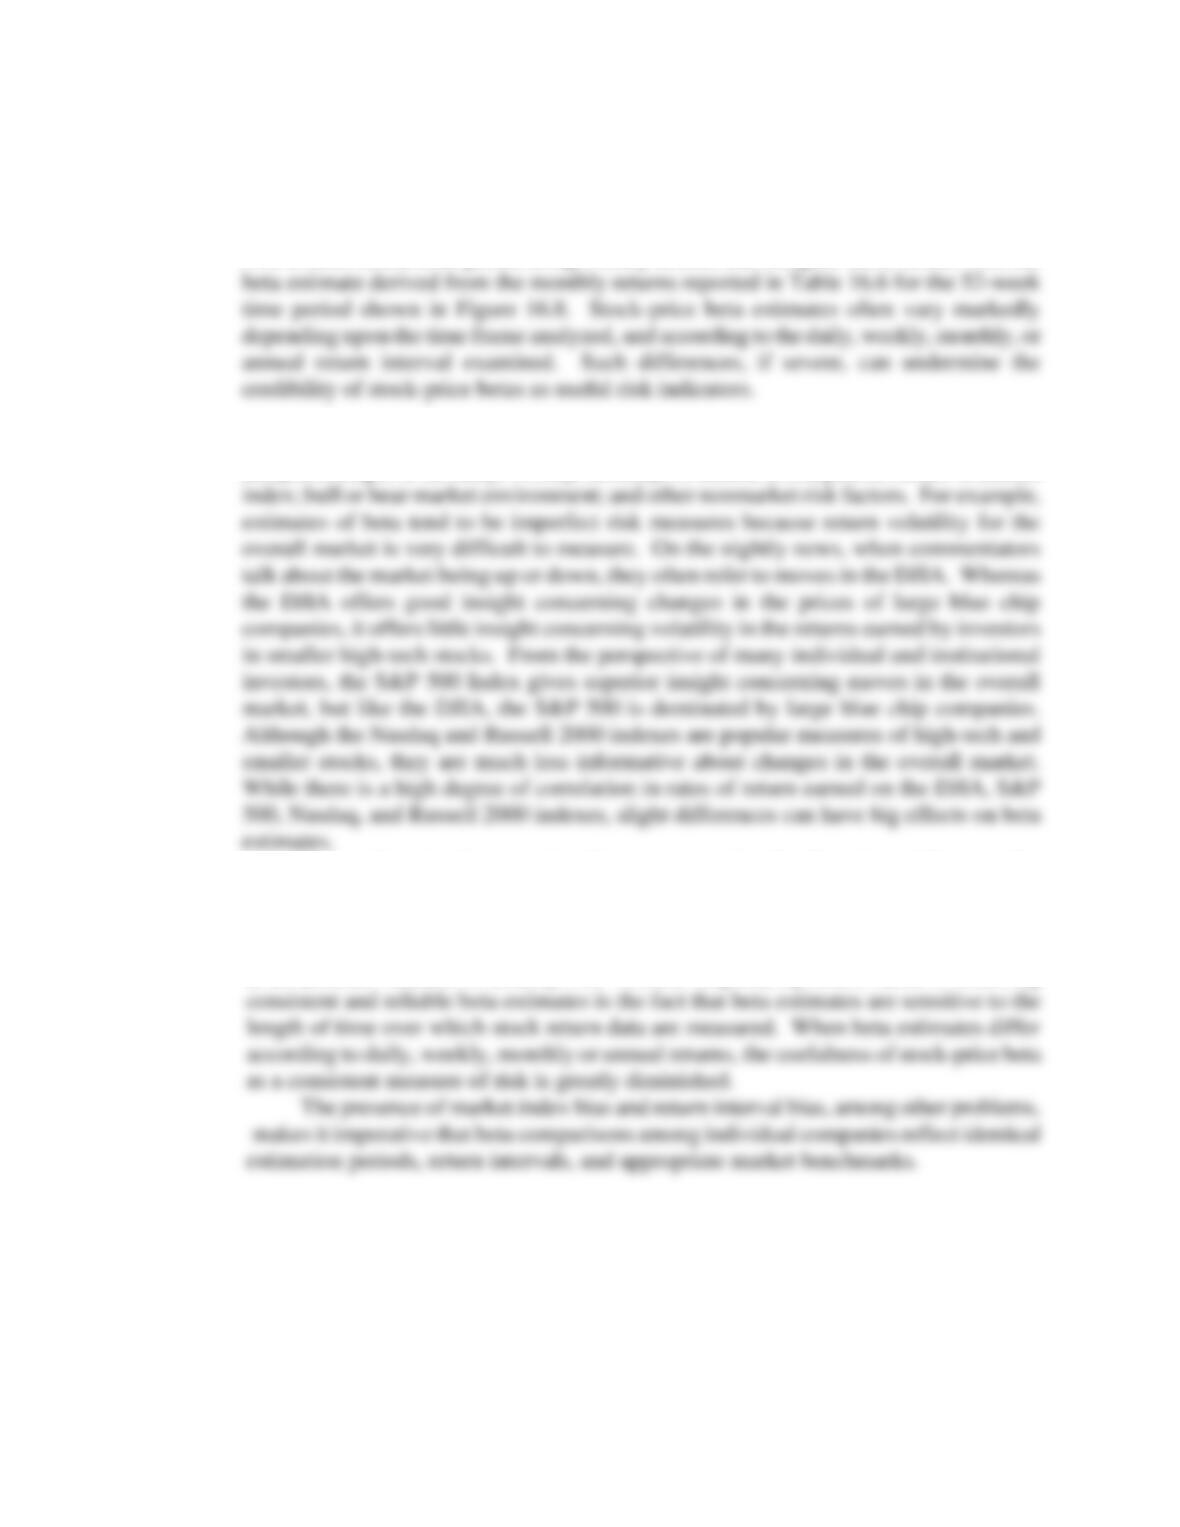
C. Empirical estimates of stock-price beta are known to vary according to the time frame
analyzed; length of the daily, weekly, monthly, or annual return period; choice of market
From a theoretical perspective, the most appropriate benchmark would be a market
index that included all capital assets, including stocks, bonds, real estate, collectibles,
and so on. Unfortunately, no such market index is available. To greater or lesser
degree, this affects the accuracy of all beta estimates and undermines confidence in beta
as an accurate measure of security risk. Another important problem faced in obtaining