periods of time is going to look more equal than
income as mea sured at any one specific point in
time.
7. The Earned Income Tax Credit creates the stron-
gest incentives to work because it is the only one
Study Prob lems
1. a. Wages in construction would likely be lower
b. Left– handed workers would make more than
right– handed workers because they would have
an expanded set of employment opportunities,
and having more opportunities generally
allows workers to find more lucrative
employment. In addition, the supply of labor
will be higher in the construction sector (right–
and left– handed workers converge. Because
labor supply in nonconstruction jobs would
increase, we would see wages in those jobs
decrease. In contrast, because labor supply in
construction would decrease, we would see
wages in those jobs increase.
Hints and Common Errors: The situation
described here is an example of occupational
Questions for Review
1. Because of the nature of garbage, it’s more
unpleasant to lift garbage into a truck than it is to
lift furniture into a truck. Therefore, in order to
entice people to work as garbage collectors, a posi-
librium wage that employers purposely pay to
workers. Some employers are willing to pay effi-
ciency wages because they think that paying
these wages increases their profit. This could be
3. Wage discrimination can be difficult to observe
and quantify because discrimination can be con-
founded with other explanations for differences
in wages. Some of these other explanations
include differences in education, differences in
human capital, differences in the type of jobs
family reasons (leading to fewer years of work
experience) and are less likely to put in as many
hours at work. Third, women tend to leave the
labor force for longer periods of time than men,
which affects their levels of human capital and,
in turn, their wages.
5. Income in equality tends to be higher in the
Solutions to Chapterfi15 Text Prob lems
it doesn’t take away the incentive to work either.
Overall, whether plan a or plan c is best
depends on whether low- income people are
unable to find work or are choosing not to work.
If the prob lem is the former, then option a will
prob ably do the most to help the poor. If the
pursuing their dreams. As discussed in the text, the
winner– take- all phenomenon can also explain why
they would drop out of college. Being in the top
oftheir respected fields, it’s pos si ble that they
knewtheir time could be better spent doing some-
thing they truly believed in and were passionate
b. Supposing that the demand curves for labor in
the markets for lifeguarding and garbage col-
lection are comparable, the labor supply curve
for labor for lifeguards will sit much farther
right than the supply curve for garbage collec–
tors. We know what that means for wages: gar–
bage collectors will earn higher wages than
lifeguards.
13. Suppose there are 100 workers. Then the 25 low–
In percentage terms, the low- income
workers earn $0.75M { $6M “ 12.5% of the total
income earned, and the middle– income workers
income of the top 20% of house holds by the
income of the bottom 20% of house holds, we get
the following numbers:
Middletown:
Top 20%: 2 w $60,000 “ $120,000
Bottom 20%: 2 w $40,000 “ $80,000
4. Because the United States is attractive to many
immigrants, it can selectively allow the most pro–
ductive of them to gain residency. These workers
have high marginal revenue products of labor
(specifically, marginal revenue products that are
well above average in the United States) and
Hints and Common Errors: It’s worth
noting that this answer considers only the direct
effect of skilled immigration. Follow-on effects
could also occur, where the skilled immigrants
create opportunities for other workers, and this
could potentially change the above answer.
6. A much higher minimum wage would seem like a
good bet to reduce income in equality. However,
you must be careful. The answer depends on how
8. Plan b is the least attractive among the three, as
each dollar earned working is matched by a dollar
reduction in benefits, so
there is no net monetary
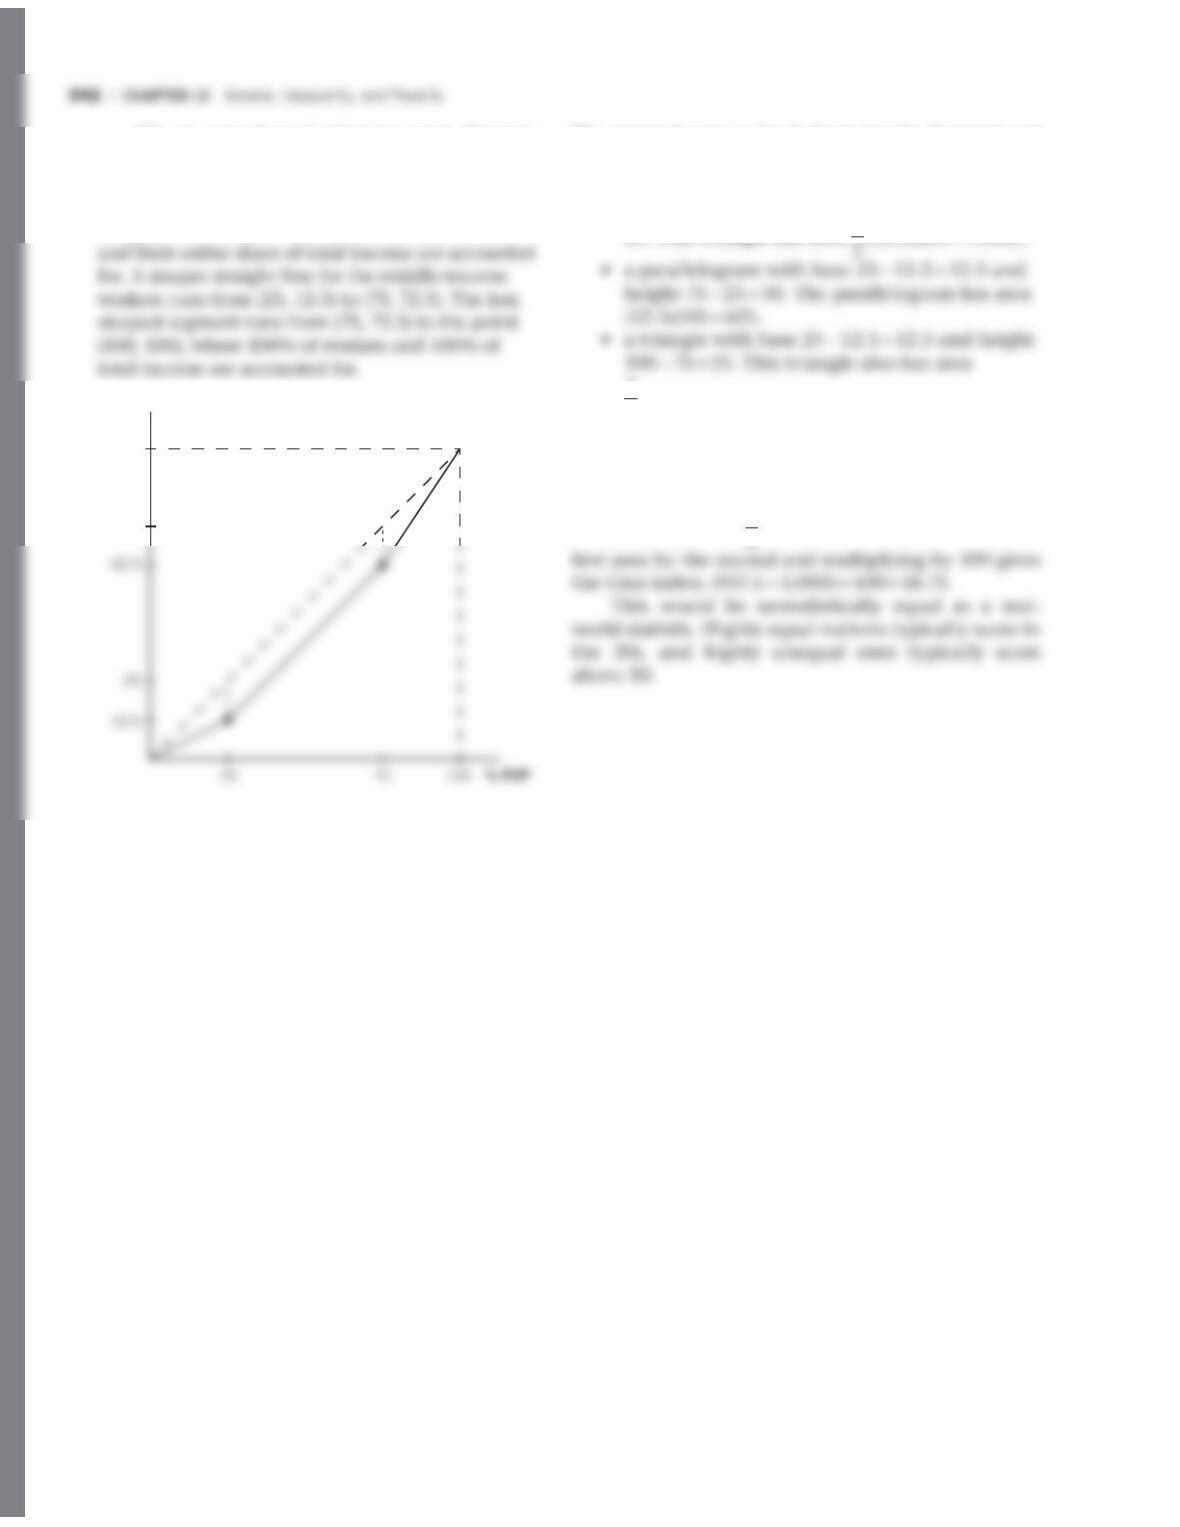
The region between the dashed straight diagonal and
the Lorenz curve has three parts:
• a triangle with base 25 12.5 “ 12.5 and height
1
2(12.5)(25) =156.25.
The total area between the dashed straight diagonal
and the Lorenz curve is therefore 156.25 625
156.25 “ 937.5. The total area below the dashed
straight diagonal is 1
We can now draw the Lorenz curve. Starting
at the low– income end and adding workers one
at a time gradually accounts for more and more
income, in a straight line that runs from (0, 0) to
the point (25, 12.5), where all low- income workers
% Income
100
75