A n s w e r s t o t h e R e v i e w Q u i z z e s
Page 378
1. Describe the situation in the market for a good or service that the United States imports.
The goods and services the United States will import are those in which the United States has a higher
2. Describe the situation in the market for a good or service that the United States exports.
The goods and services the United States will export are those in which the United States has a lower
Page 379
1. How is the gain from imports distributed between consumers and domestic producers?
2. How is the gain from exports distributed between consumers and domestic producers?
3. Why is the net gain from international trade positive?
The net gain from international trade is positive because the gain to the winners exceeds the losses to
Page 385
1. What are the tools that a country can use to restrict international trade?
2. Explain the effects of a tariff on domestic production, the quantity bought, and the price.
3. Explain who gains and who loses from a tariff and why the losses exceed the gains.
Domestic consumers lose from the tariff. Domestic producers gain from the tariff. The government
also gains revenue from the tariff. But the gain to producers plus the gain in government revenue is less
15
INTERNATIONAL
TRADE POLICY
C h a p t e r
4. Explain the effects of an import quota on domestic production, consumption, and price.
5. Explain who gains and who loses from an import quota and why the losses exceed the gains.
Domestic consumers lose from the import quota. Domestic producers gain from the import quota. The
importers also gain additional profit from the import quota. But the gain to producers plus the
Page 389
1. What are the infant industry and dumping arguments for protection? Are they correct?
The attempt to stimulate the growth of new industries is the infant-industry argument for protection,
which states that it is necessary to protect a new industry from import competition to facilitate the
growth of that industry, making it competitive in the world markets. This argument is based on the
concept of dynamic competitive advantage. Learning-by-doing is a powerful engine of productivity
2. Can protection save jobs and the environment and prevent workers in developing countries from
being exploited?
There are many myths about trade restrictions. The problem mentions three of them, all false reasons
often offered as reasons to restrict international trade. These arguments are:
Trade restrictions save domestic jobs: This argument ignores the fact that, under free trade,
consumers in the importing country will have greater disposable income and citizens in the
Trade restrictions penalize lax environmental standards: Not all developing countries have lax
environmental standards. Also, a clean environment is a normal good. Countries that are relatively
I N T E R N A T I O N A L T R A D E P O L I C Y 1 9 7
Trade restrictions prevent rich countries from exploiting poorer countries: Importing goods made in
3. What is offshore outsourcing? Who benefits from it and who loses?
Offshore outsourcing occurs when a firm in the United States buys finished goods, components, or
4. What are the main reasons for imposing a tariff?
5. Why don’t the winners from free trade win the political argument?
Trade restrictions are enacted despite the inherent inefficiency because of the political actions of rent
1 9 8 C H A P T E R 1 5
A n s w e rs t o t h e S t u dy P l a n Pr o b l e m s an d Ap p l ic at io n s
Use the following data to work Problems 1 to 3.
Wholesalers buy and sell roses in containers that
hold 120 stems. The table provides information
about the wholesale market for roses in the
United States. The demand schedule is the
wholesalers’ demand and the supply schedule is
the U.S. rose growers’ supply. Wholesalers can
buy roses at auction in Aalsmeer, Holland, for
$125 per container.
1. a. Without international trade, what would
be the price of a container of roses and how many containers of roses a year would be bought
and sold in the United States?
b. At the price in your answer to part (a), does the United States or the rest of the world have a
comparative advantage in producing roses?
2. If U.S. wholesalers buy roses at the lowest possible price, how many do they buy from U.S.
growers and how many do they import?
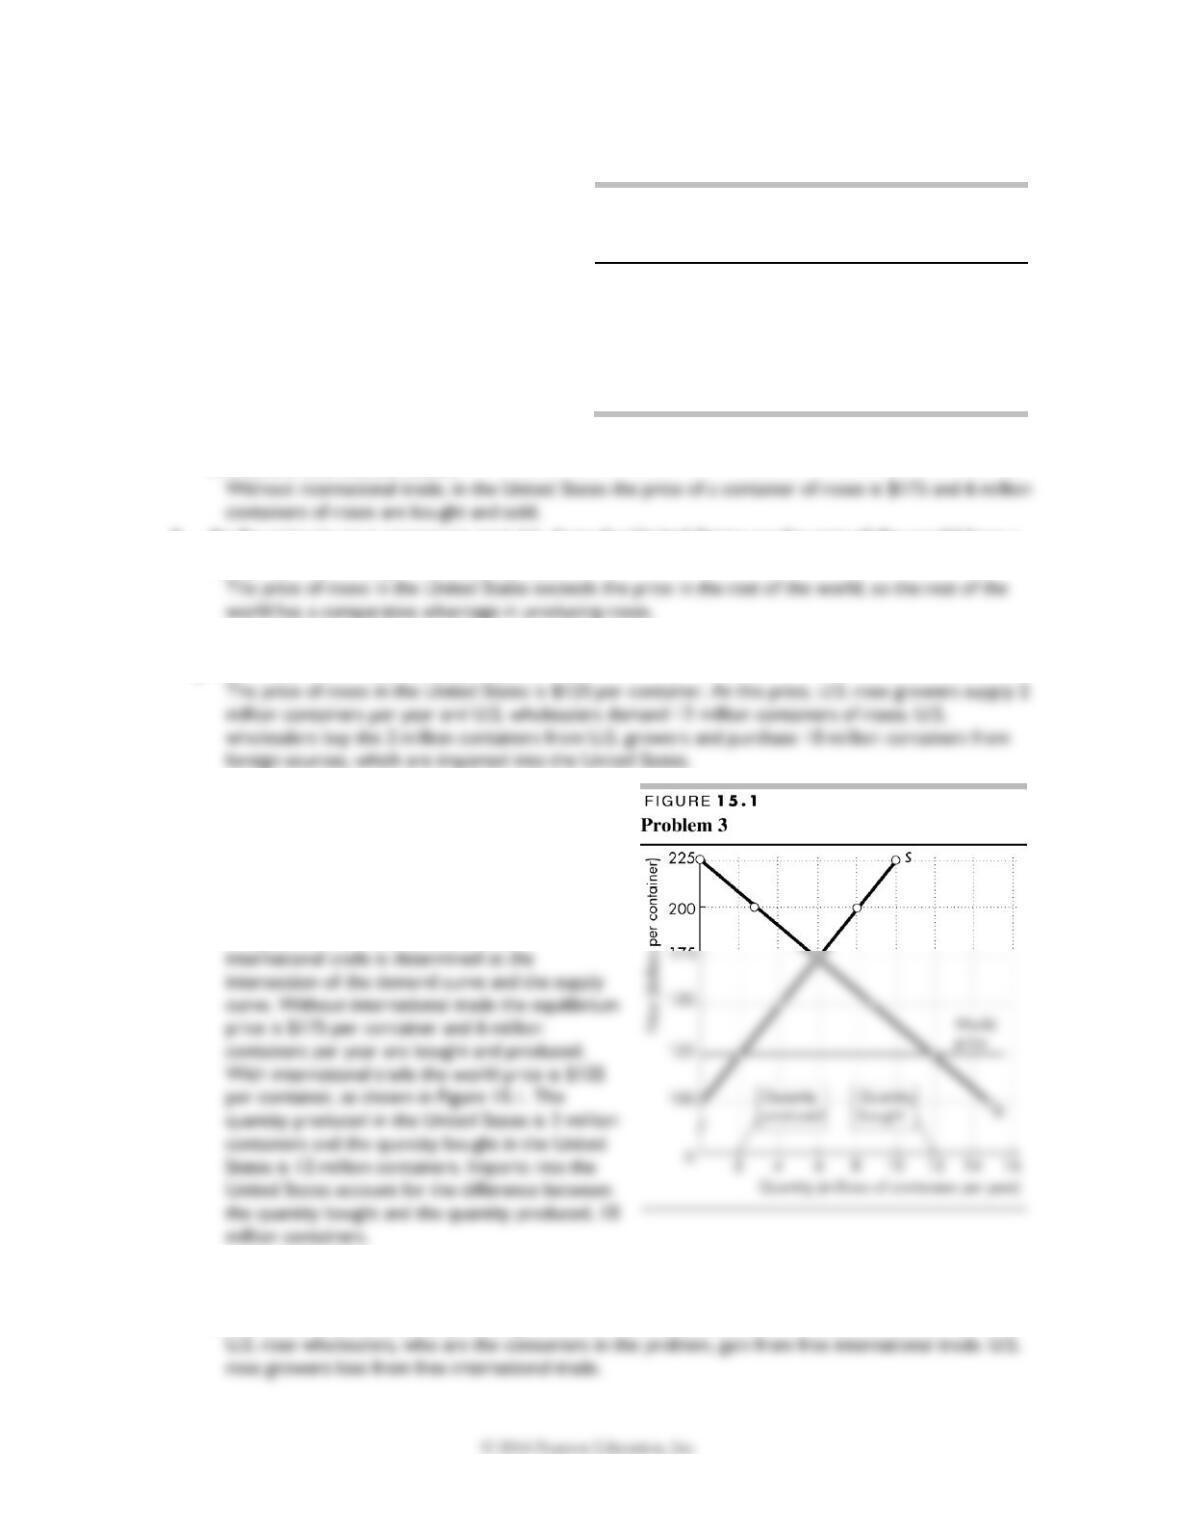
3. Draw a graph to illustrate the U.S. wholesale
market for roses. Show the equilibrium in that
market with no international trade and the
equilibrium with free trade. Mark the quantity of
roses produced in the United States, the quantity
imported, and the total quantity bought.
In Figure 15.1, the equilibrium without
4. Use the information on the U.S. wholesale market for roses in Problem 1 to
a. Explain who gains and who loses from free international trade in roses compared to a situation
in which Americans buy only roses grown in the United States.
Price
(dollars per
container)
Quantity
demanded
Quantity
supplied
(millions of containers per year)
100
15
0
125
12
2
150
9
4
175
6
6
200
3
8
225
0
10
I N T E R N A T I O N A L T R A D E P O L I C Y 1 9 9
b. Calculate the value of the roses imported into the United States.
Use the information on the U.S. wholesale market for roses in Problem 1 to work Problems 5 to 10.
5. If the United States puts a tariff of $25 per container on imports of roses, explain how the U.S.
price of roses, the quantity of roses bought, the quantity produced in the United States, and the
quantity imported changed.
The U.S. price of roses rises from $125 per container (the price with free trade) to $150 per container.
6. Who gains and who loses from this tariff?
7. Draw a graph of the U.S. market for roses to illustrate the gains and losses from the tariff and on
the graph identify the gains and losses, and the tariff revenue.
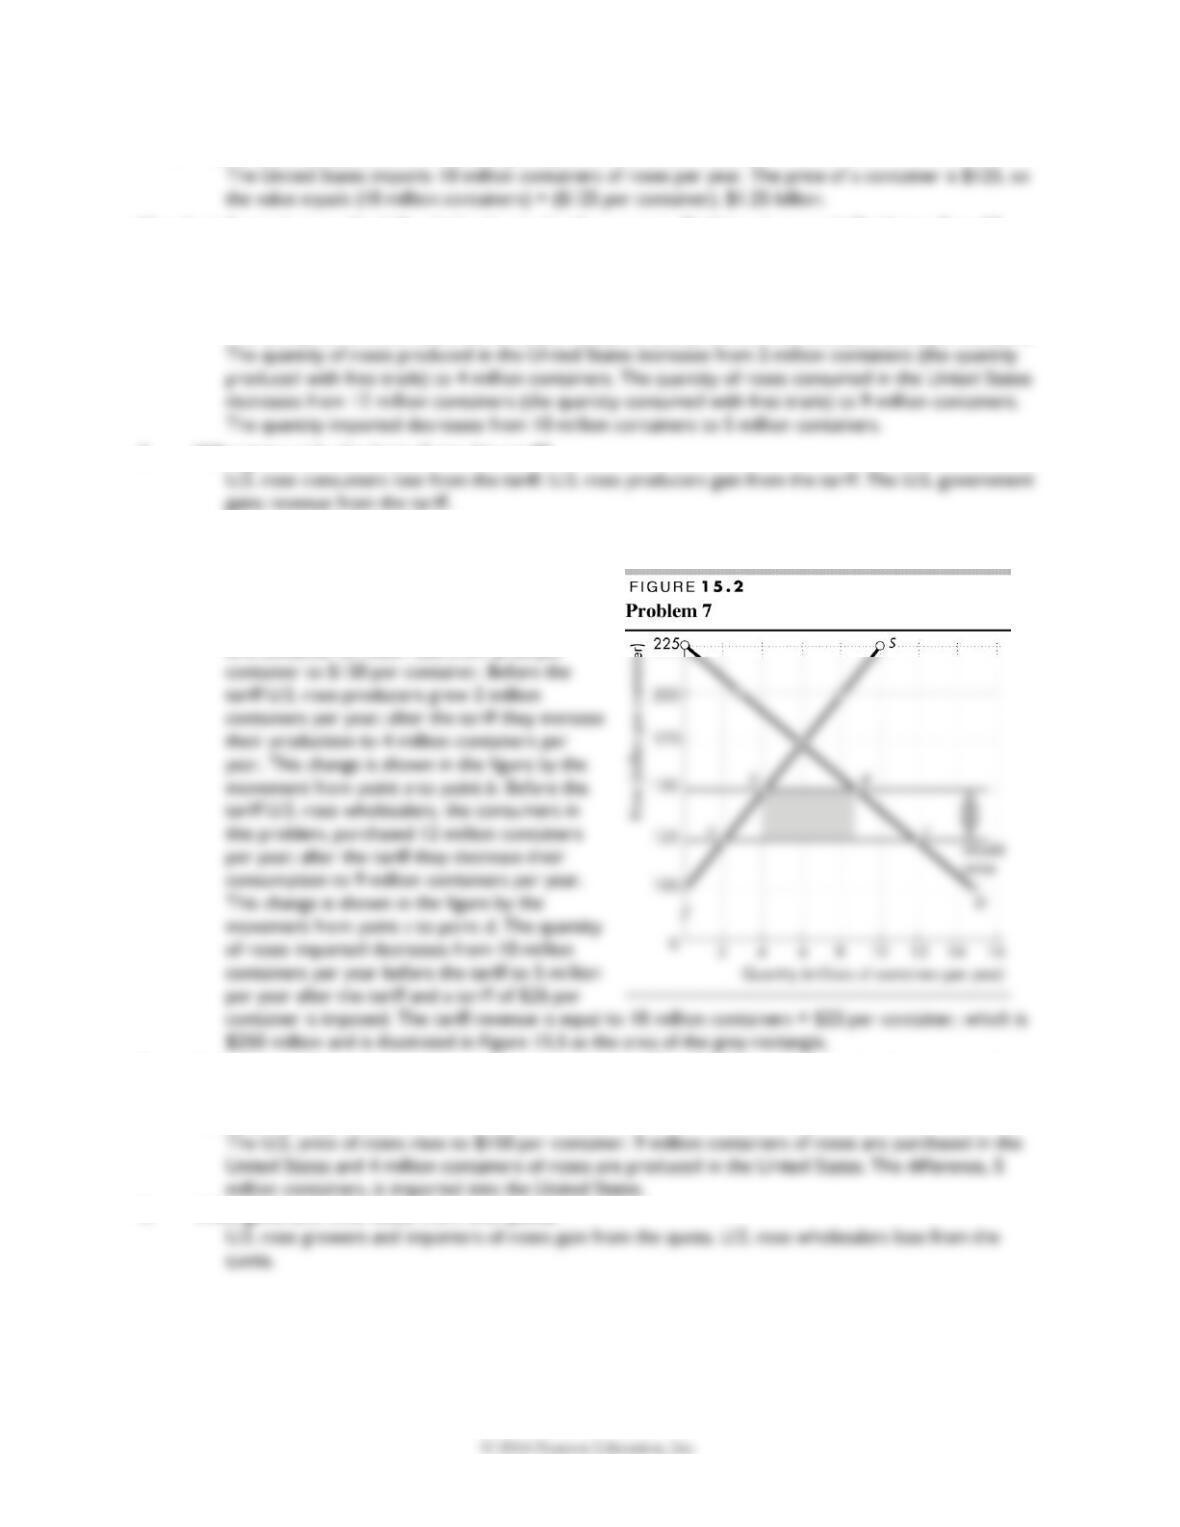
Figure 15.2 shows the effect of the tariff. The
amount of the tariff is equal to the height of the
light gray arrow. In the United States, the price
of a container of roses rises from $125 per
8. If the United States puts an import quota on roses of 5 million containers, what happens to the
U.S. price of roses, the quantity of roses bought, the quantity produced in the United States, and
the quantity imported?
9. Who gains and who loses from this quota?
10. Draw a graph to illustrate the gains and losses from the import quota and on the graph identify
the gains and losses, and the importers’ profit.
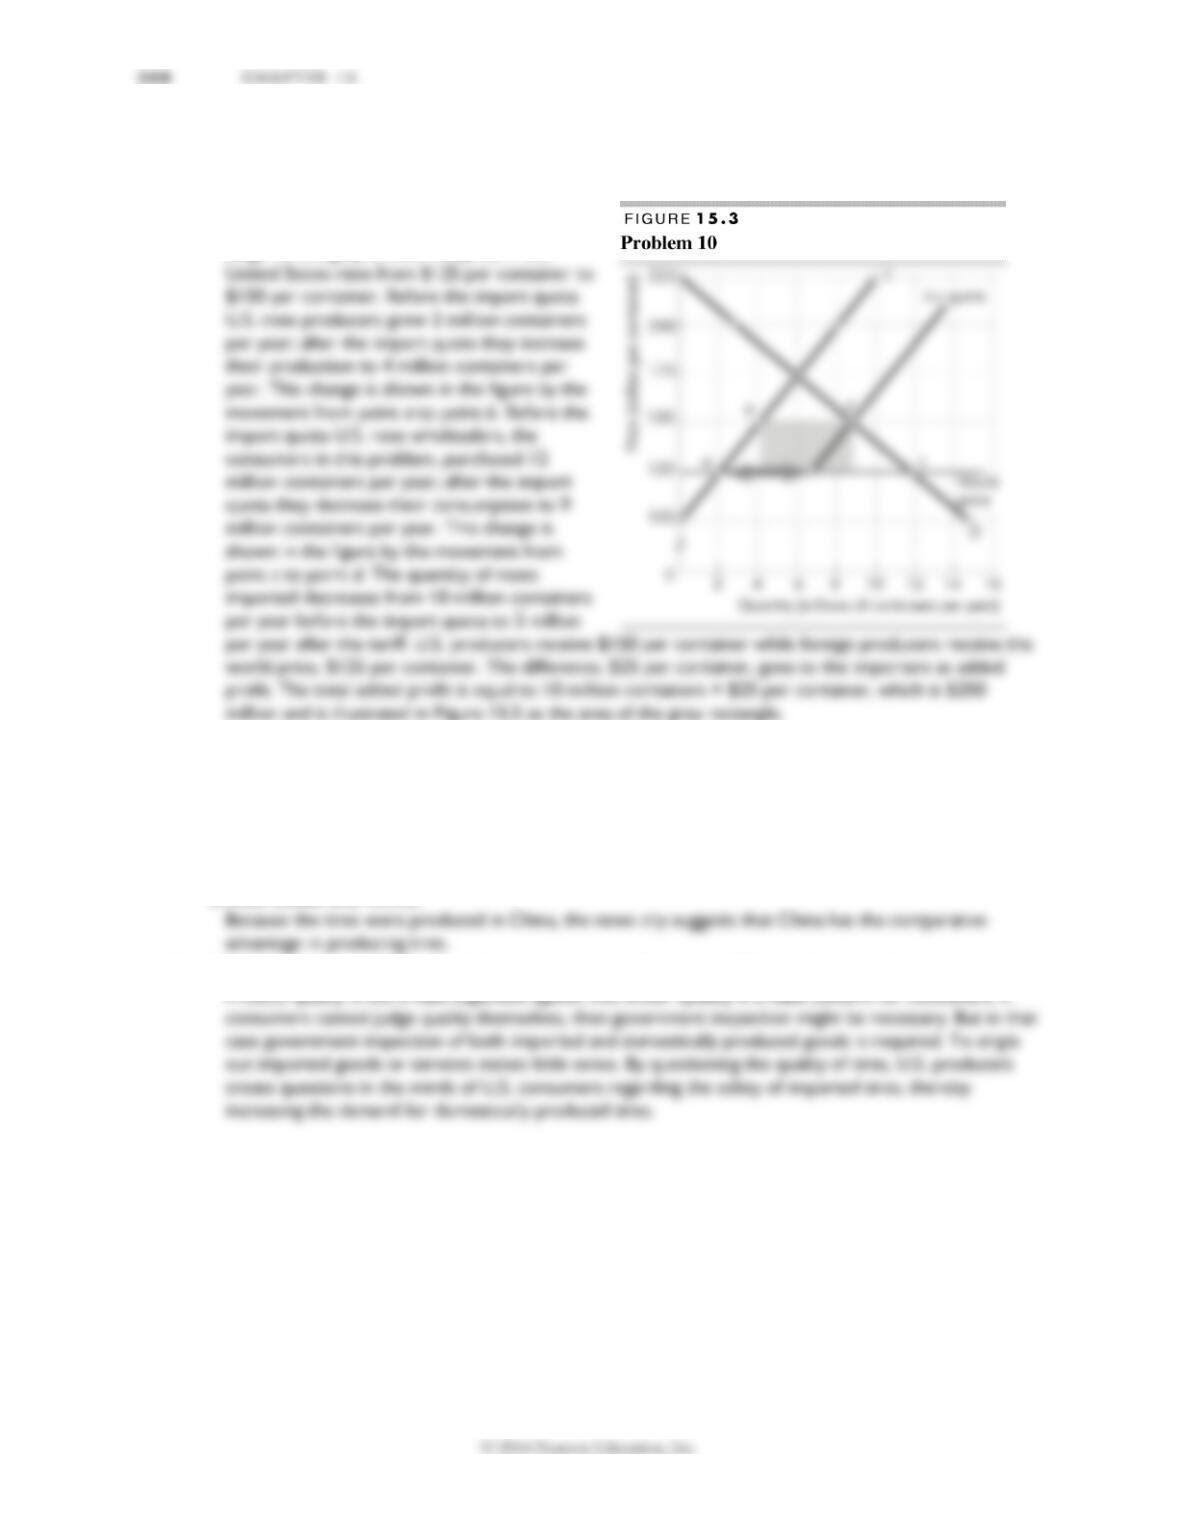
Figure 15.3 shows the effect of the import
quota. The amount of the quota is equal to the
length of the grey arrow. The price in the
11. Chinese Tire Maker Rejects Charge of Defects
U.S. regulators ordered the recall of more than 450,000 faulty tires. The Chinese producer of the
tires disputed the allegations and hinted that the recall might be an effort to hamper Chinese
exports to the United States.
Source: International Herald Tribune, June 26, 2007
a. What does the news clip imply about the comparative advantage of producing tires in the
United States and China?
b. Could product quality be a valid argument against free trade? If it could, explain how.
I N T E R N A T I O N A L T R A D E P O L I C Y 2 0 1
Answers to Additional Problems and Applications
12. Suppose that the world price of sugar is 10 cents a pound, the United States does not trade
internationally, and the equilibrium price of sugar in the United States is 20 cents a pound. The
United States then begins to trade internationally.
a. How does the price of sugar in the United States change?
b. Do U.S. consumers buy more or less sugar?
c. Do U.S. sugar growers produce more or less sugar?
d. Does the United States export or import sugar and why?
13. Suppose that the world price of steel is $100 a ton, India does not trade internationally, and the
equilibrium price of steel in India is $60 a ton. India then begins to trade internationally.
a. How does the price of steel in India change?
b. How does the quantity of steel produced in India change?
c. How does the quantity of steel bought by India change?
d. Does India export or import steel and why?
14. A semiconductor is a key component in your
laptop, cell phone, and iPod. The table
provides information about the market for
semiconductors in the United States.
Producers of semiconductors can get $18 a
unit on the world market.
a. With no international trade, what would be
the price of a semiconductor and how many
semiconductors a year would be bought and
sold in the United States?
b. Does the United States have a comparative advantage in producing semiconductors?
Price
(dollars per
unit)
Quantity
demanded
Quantity
supplied
(billions of units per year)
10
25
0
12
20
20
14
15
40
16
10
60
18
5
80
20
0
100
15. Act Now, Eat Later
The hunger crisis in poor countries has its roots in U.S. and European policies of subsidizing the
diversion of food crops to produce biofuels like corn-based ethanol. That is, doling out subsidies
to put the world’s dinner into the gas tank.
Source: Time, May 5, 2008
a. What is the effect on the world price of corn of the increased use of corn to produce ethanol in
the United States and Europe?
b. How does the change in the world price of corn affect the quantity of corn produced in a poor
developing country with a comparative advantage in producing corn, the quantity it consumes,
and the quantity that it either exports or imports?
The higher world price of corn decreases the consumption of corn and increases the production of
16. Draw a graph of the market for corn in the
poor developing country in Problem 15(b) to
show the changes in the price of corn, the
quantity produced, and the quantity
consumed by people in that country.
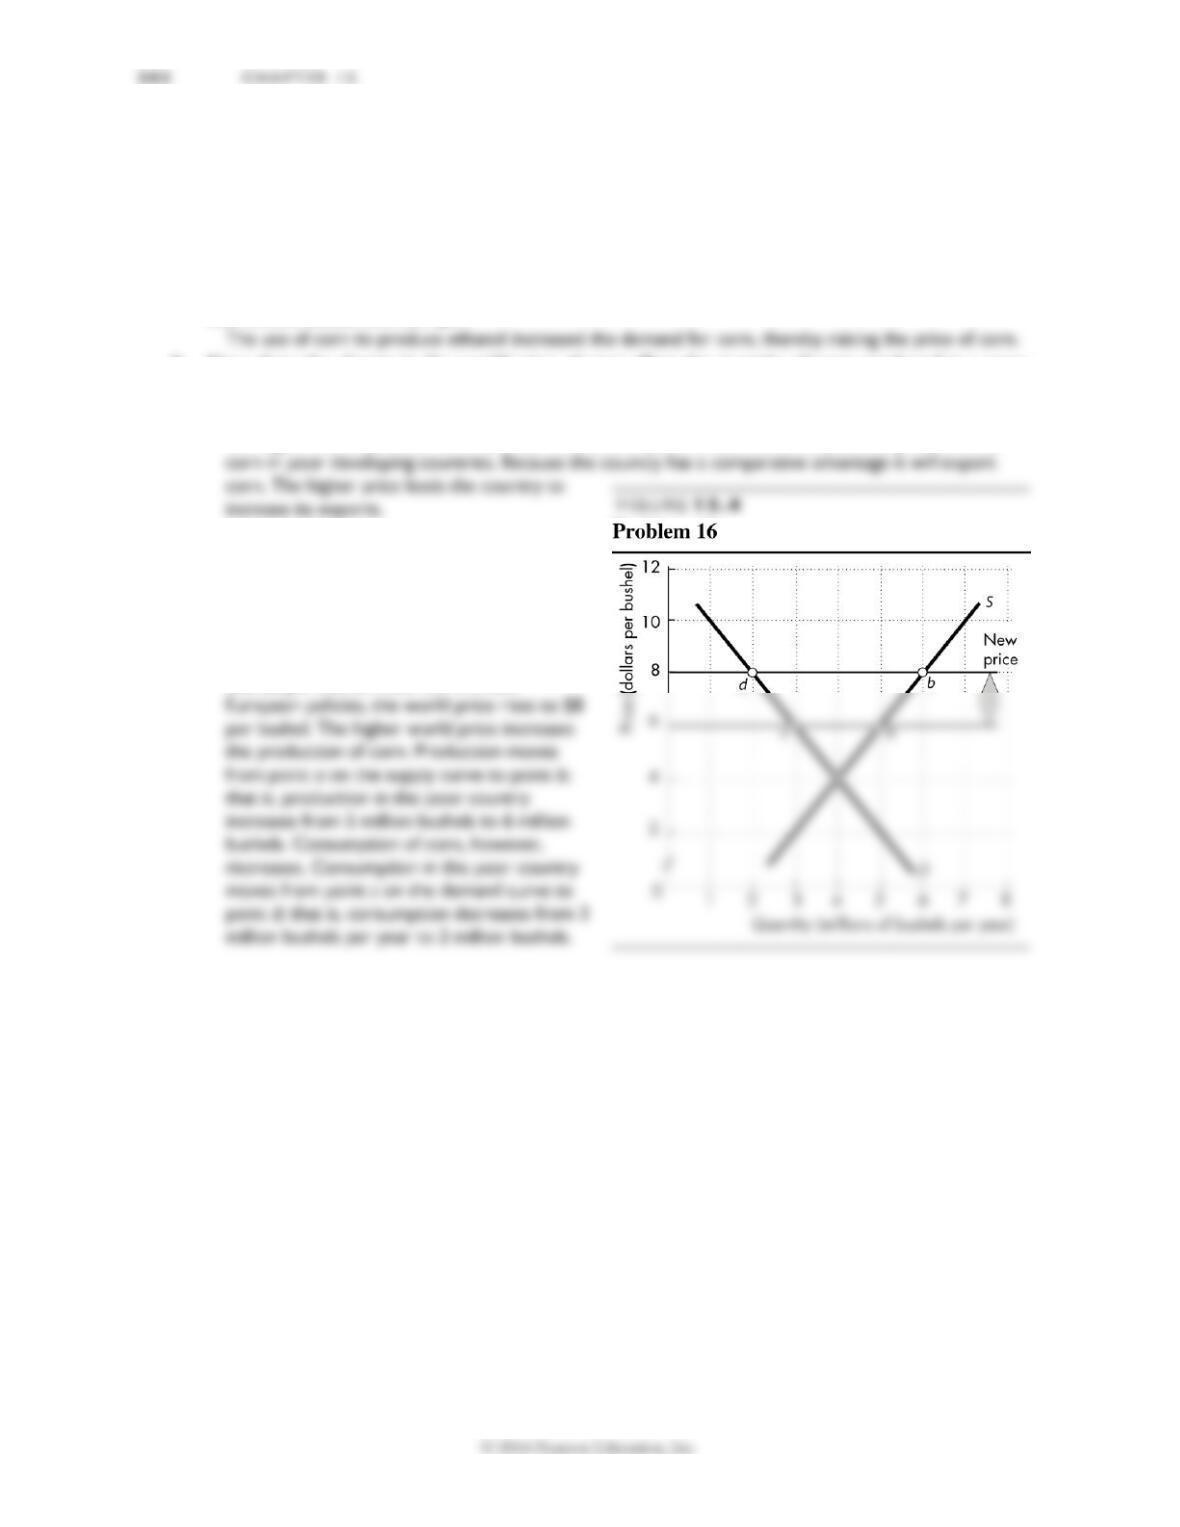
In Figure 15.4, the initial world price of corn
was $6 per bushel. After the U.S. and
I N T E R N A T I O N A L T R A D E P O L I C Y 2 0 3
Use the following news clip to work Problems 27 and 28.
South Korea to Resume U.S. Beef Imports
South Korea will reopen its market to most U.S. beef. South Korea banned imports of U.S. beef in 2003
amid concerns over a case of mad cow disease in the United States. The ban closed what was then the
third-largest market for U.S. beef exporters.
Source: CNN, May 29, 2008
17. a. Explain how South Korea’s import ban on U.S. beef affected beef producers and consumers in
South Korea.
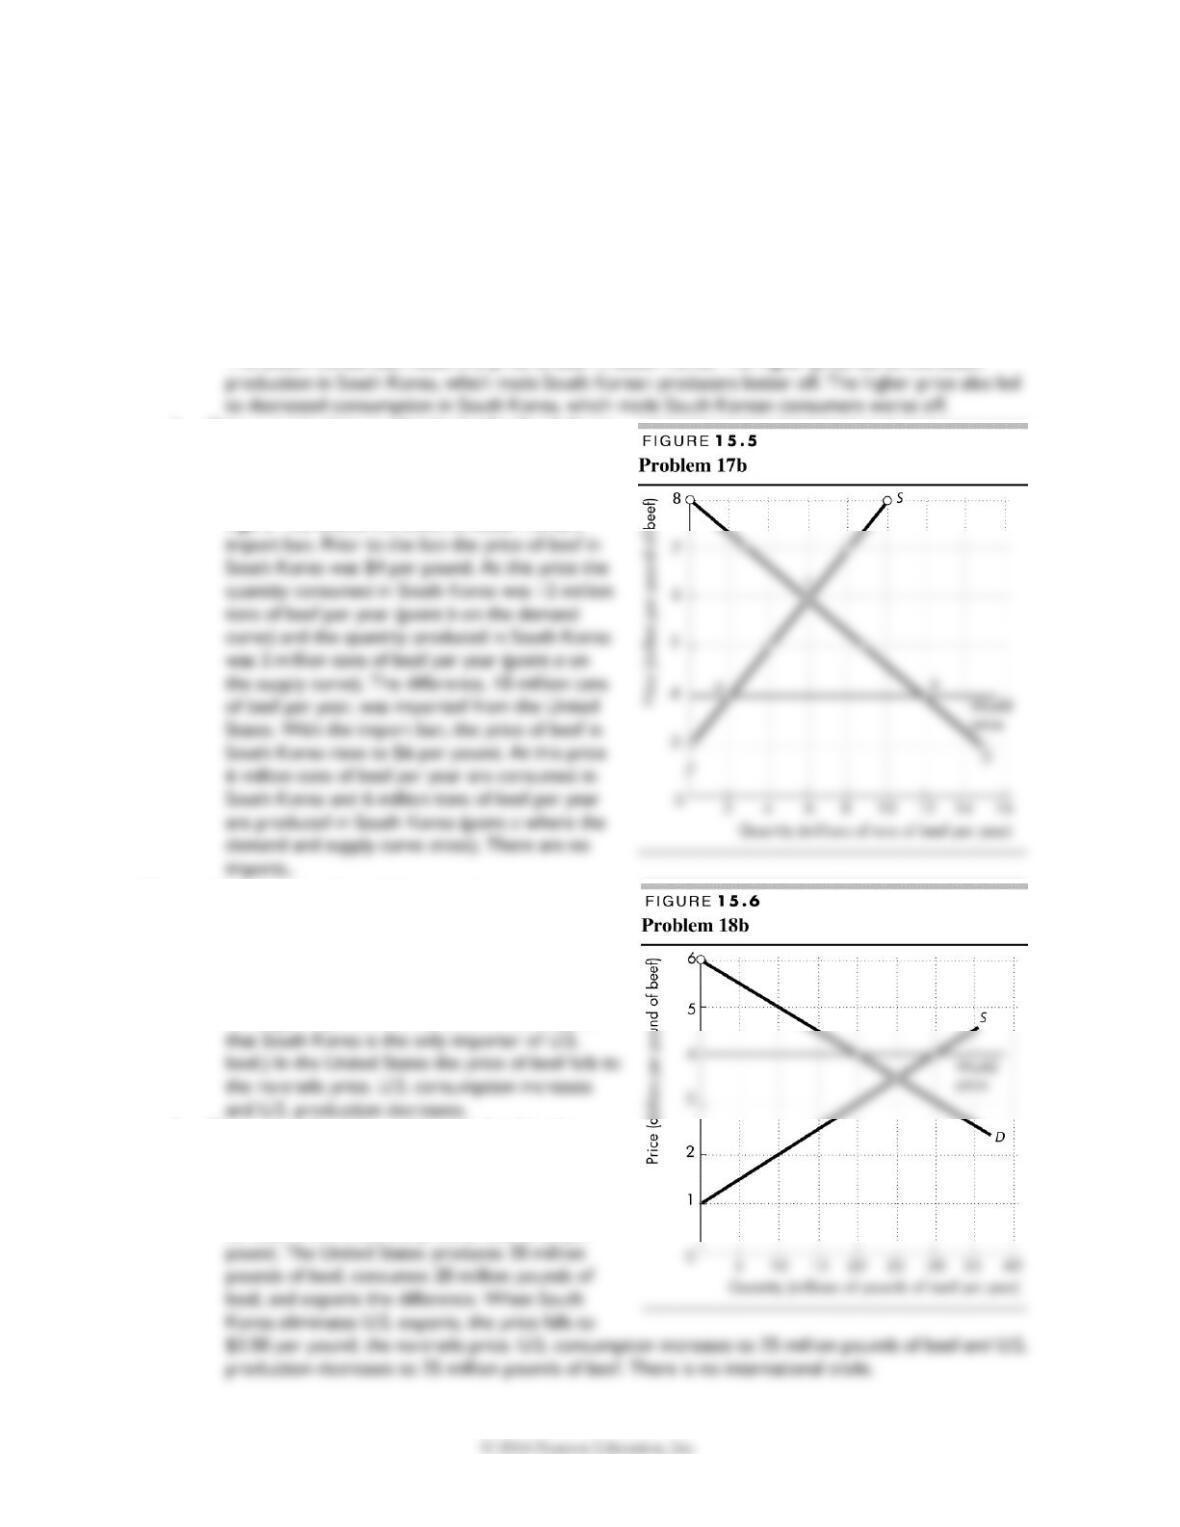
The South Korean ban raised the price of beef in South Korea. The higher price led to increased
b. Draw a graph of the market for beef in South Korea
to illustrate your answer to part (a). Identify the
changes in the price of beef, the quantity produced,
the quantity consumed, and the quantity imported.
Figure 15.8 shows the effect of South Korea’s
18. a. Assuming that South Korea is the only importer
of U.S. beef, explain how South Korea’s import
ban on U.S. beef affected beef producers and
consumers in the United States.
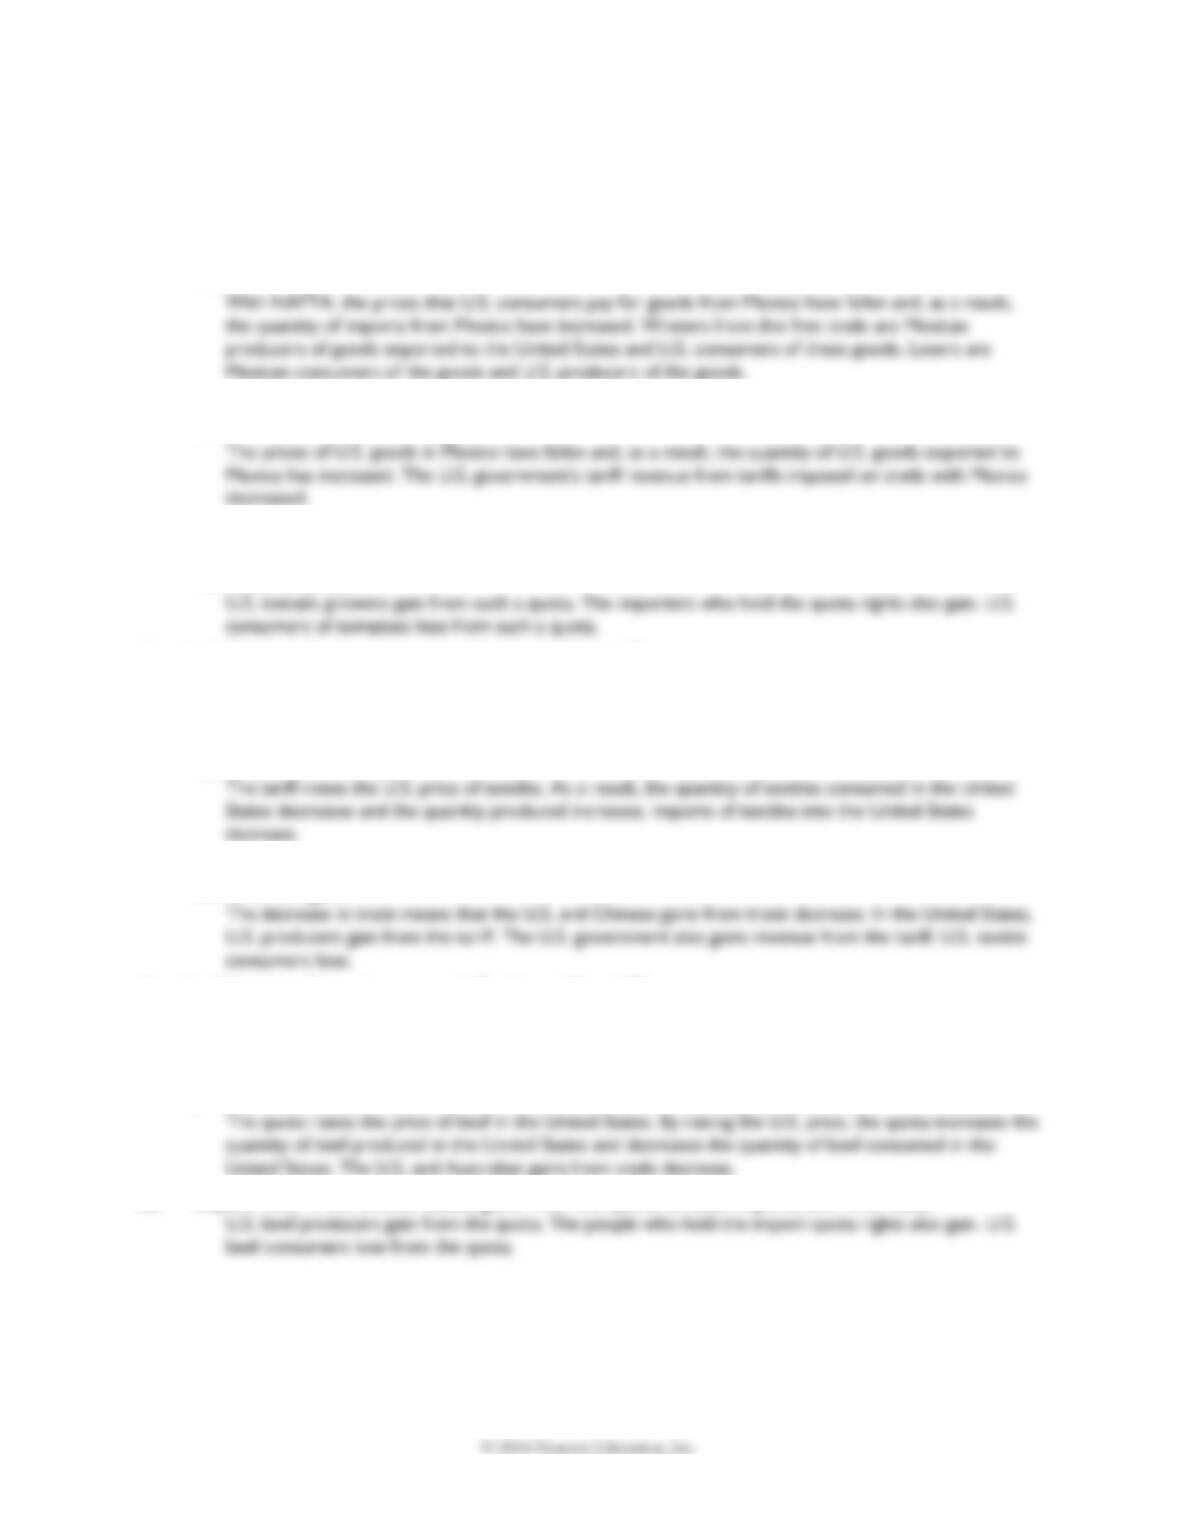
South Korea’s ban meant that the United States
no longer exported beef. (Recall the assumption
b. Draw a graph of the market for beef in the
United States to illustrate your answer to part
(a).
Figure 15.9 shows the situation in the U.S. market
for beef. With trade the price of beef is $4 per
2 0 4 C H A P T E R 1 5
Use the following information to work Problems 19 to 21.
Before 1995, trade between the United States and Mexico was subject to tariffs. In 1995, Mexico joined
NAFTA and all U.S. and Mexican tariffs have gradually been removed.
19. Explain how the price that U.S. consumers pay for goods from Mexico and the quantity of U.S.
imports from Mexico have changed. Who are the winners and who are the losers from this free
trade?
20. Explain how the quantity of U.S. exports to Mexico and the U.S. government’s tariff revenue from
trade with Mexico have changed.
21. Suppose that in 2015 tomato growers in Florida lobby the U.S. government to impose an import
quota on Mexican tomatoes. Explain who in the United States would gain and who would lose
from such a quota.
Use the following information to work Problems 22 and 23.
Suppose that in response to huge job losses in the U.S. textile industry, Congress imposes a 100 percent
tariff on imports of textiles from China.
22. Explain how the tariff on textiles will change the price that U.S. buyers pay for textiles, the
quantity of textiles imported, and the quantity of textiles produced in the United States.
23. Explain how the U.S. and Chinese gains from trade will change. Who in the United States will lose
and who will gain?
Use the following information to work Problems 24 and 25.
With free trade between Australia and the United States, Australia would export beef to the United
States. But the United States imposes an import quota on Australian beef.
24. Explain how this quota influences the price that U.S. consumers pay for beef, the quantity of beef
produced in the United States, and the U.S. and the Australian gains from trade.
25. Explain who in the United States gains from the quota on beef imports and who loses.
26. Trading Up
The cost of protecting jobs in uncompetitive sectors through tariffs is high: Saving a job in the
sugar industry costs American consumers $826,000 in higher prices a year; saving a dairy industry
job costs $685,000 per year; and saving a job in the manufacturing of women’s handbags costs
$263,000.
Source: The New York Times, June 26, 2006
a. What are the arguments for saving the jobs mentioned in this news clip? Explain why these
arguments are faulty.
The arguments for saving these jobs are (explicitly) the argument that protection saves jobs and
b. Is there any merit to saving these jobs?
Economics in the News
Economics in the News
27. After you have studied Economics in the News on pp. 390–391, answer the following questions.
b. Who in the United States would benefit and who would lose from a successful TPP?
U.S. exporters of goods whose tariffs are reduced and U.S. consumers of imported goods whose tariffs
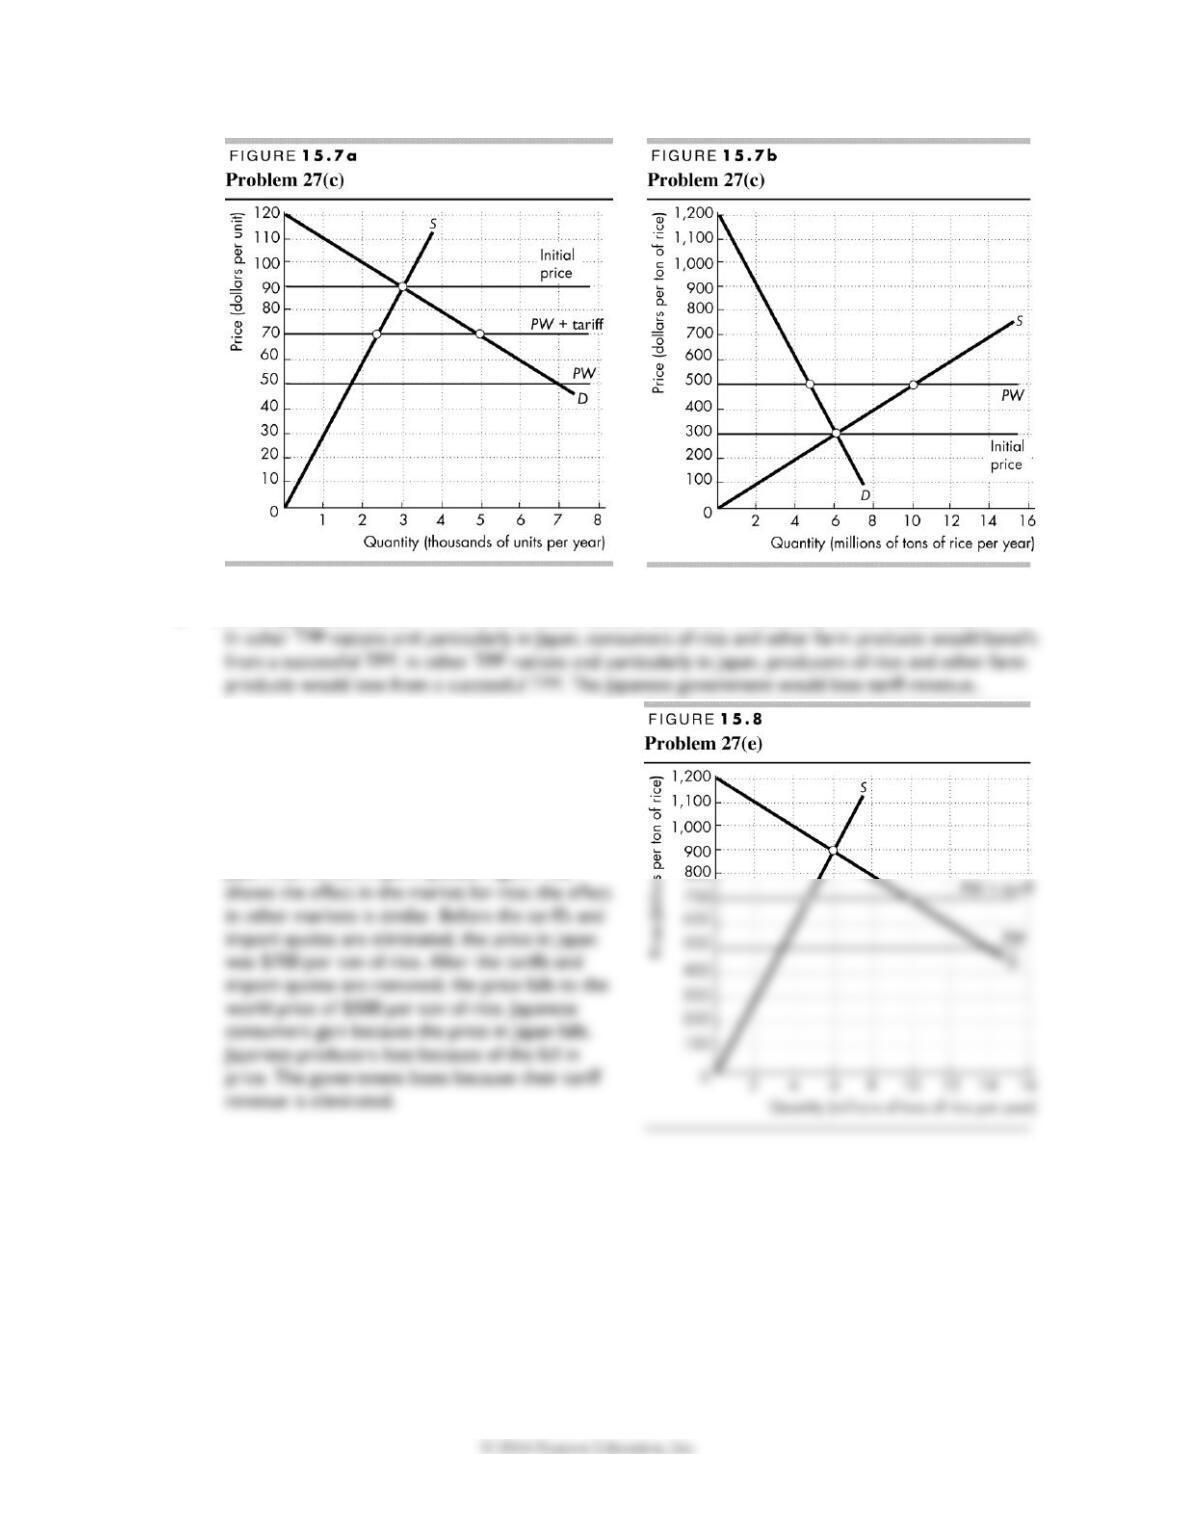
c. Illustrate your answer to part (b) with an appropriate graphical analysis assuming that tariffs are
not completely eliminated.
Figure 15.7a (on the next page) shows the effect in the United States of lowering the U.S. tariff on a
good. Initially the price in the United States was $90 per unit. When the tariff is lowered, the price in
2 0 6 C H A P T E R 1 5
d. Who in Japan and other TPP nations would benefit and who would lose from a successful TPP?
e. Illustrate with an appropriate graphical analysis
who in Japan would benefit and who would lose
from a successful TPP assuming that all Japan’s
import quotas and tariffs are completely
eliminated.
Figure 15.8 shows the effect in Japan of eliminating
Japan’s tariffs and import quotas. Figure 15.8
28. E.U. Agrees to Trade Deal with South Korea
Italy has dropped its resistance to a E.U. trade agreement with South Korea, which will wipe out
$2 billion in annual duties on E.U. exports. Italians argued that the agreement, which eliminates
E.U. duties on South Korean cars, would put undue pressure on its own automakers.
Source: The Financial Times, September 16, 2010
a. What is a free trade agreement? What is its aim?
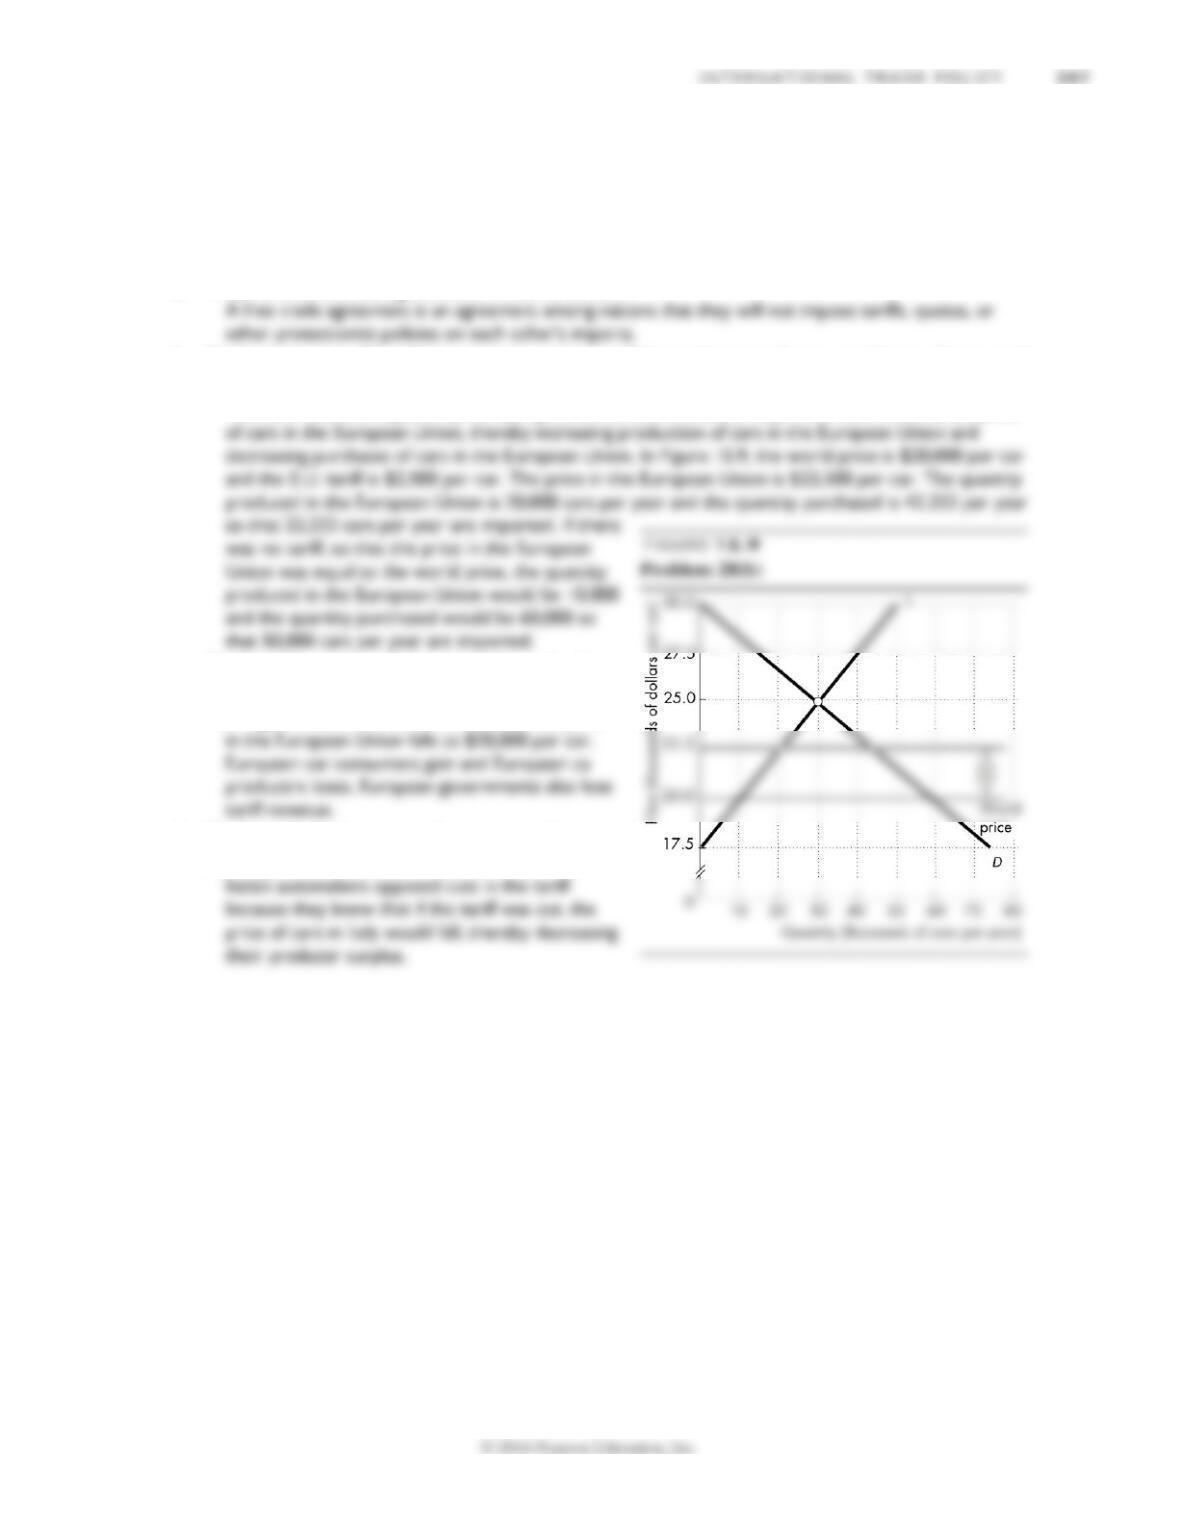
b. Explain how a tariff on E.U. car imports changes E.U. production of cars, purchases of cars, and
imports of cars. Illustrate your answer with an appropriate graphical analysis.
The tariff that was imposed by the European Union decreased E.U. imports of cars. It raised the price
c. Explain who gains and who loses from this free-
trade deal in cars.
In Figure 15.9, if the tariff is eliminated, the price
d. Explain why Italian automakers opposed cuts in
car import tariffs.