Chapter 15
Simulation-Based Estimation and Inference and
Random Parameter Models
◼ Exercises
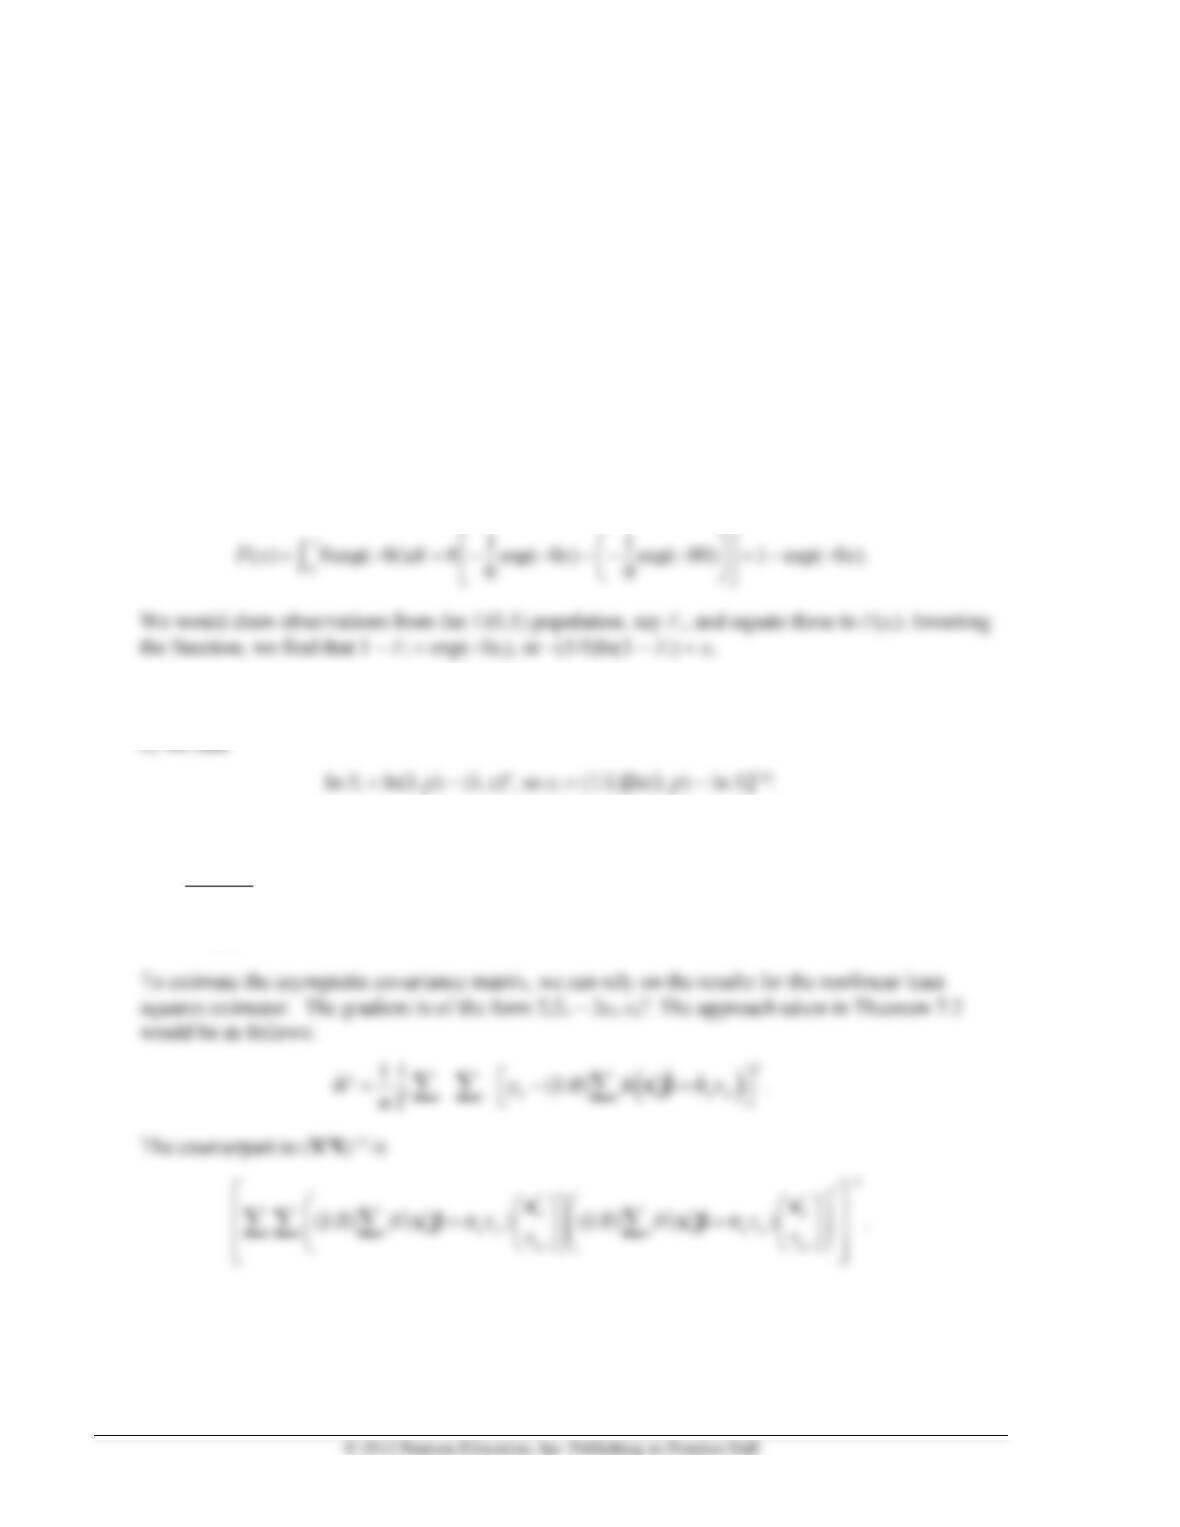
1. Exponential: The pdf is f(x) = exp(−x). The CDF is
2. Weibull. If the survival function is S(x) = pexp[−( x)p], then we may equate random draws from the
uniform distribution, Si to this function (a draw of Si is the same as a draw of Fi = 1 − Si). Solving for
3. The derivative of the simulated sum of squares is
( , ) 2 (1 / ) ( ) (1/ ) ( ) .
it
it it u ir it u ir
i t r r
ir
Sy R h v R h v v
= − − + +
x
xx
Chapter 15 Simulation-Based Estimation and Inference and Random Parameter Models 127
Applications
?================================================================
? Application 15.1. Monte Carlo Simulation
?================================================================
? Set seed of RNG for replicability
Calc ; Ran(123579) $
? Sample size is 50. Generate x(i) and z(i) held fixed
Sample ; 1 – 50 $
?****************************************************************
? Procedure studies the LM statistic
?****************************************************************
Proc = LM (c) $
? Three kinds of disturbances
Create ?; Eps = Rnt(5) ? Nonnormal distribution
?****************************************************************
? Procedure studies the Wald statistic
?****************************************************************
Proc = Wald(c) $
Create ; if(type=1)Eps = Rnn(0,1) ? Standard normal distribution
; if(type=2)vi=exp(.2*xi) ? eps = vi*rnn(0,1) ? Heteroscedasticity
; if(type=3)eps= Rnt(5) ? Nonnormal distribution
; y = 0 + xi + c*zi +eps $
Calc ; List ; Type1 = xbr(reject) ; pwr = 1-Type1 $
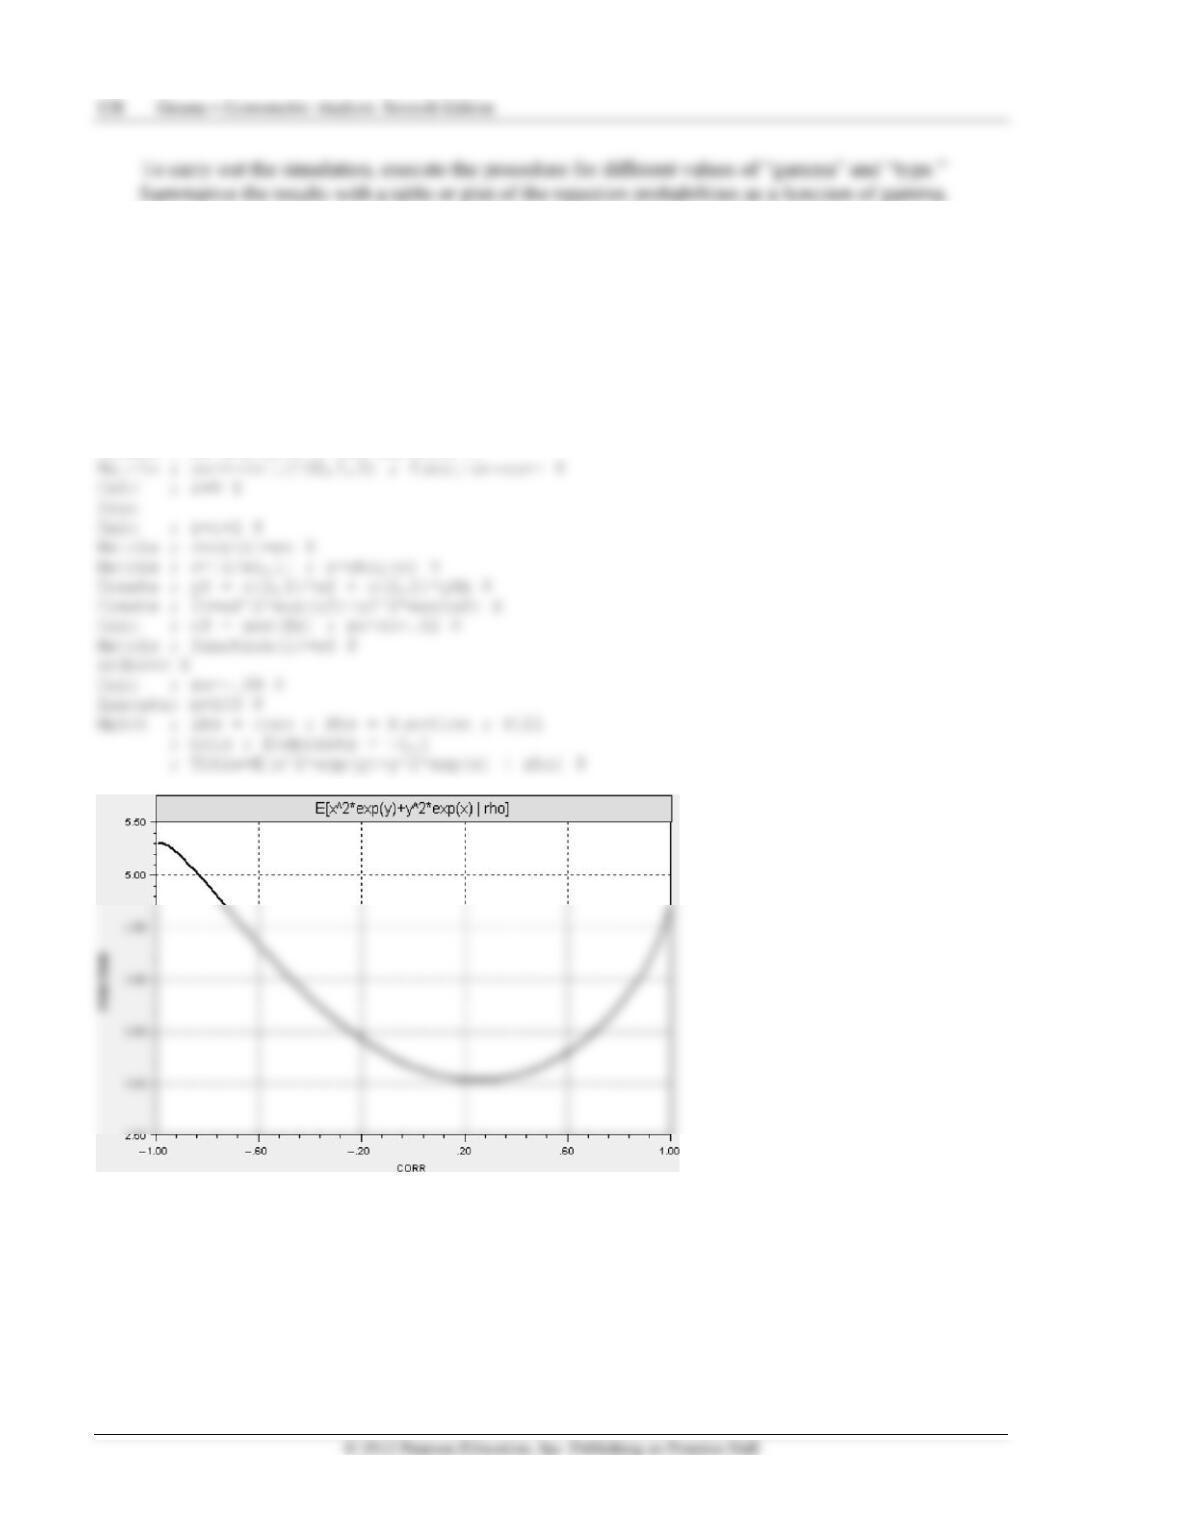
2. We will need a bivariate sample on x and y to compute the random variable, then average the draws on it.
The precise method of using a Gibbs sampler to draw this bivariate sample is shown in Example 18.5.
Once the bivariate sample of (x, y) is drawn, a large number of observations on [x2exp(y) + y2exp(x)]
is computed and averaged. As noted there, the Gibbs sampler is not much of a simplification for this
particular problem. It is simple to draw a sample directly from a bivariate normal distribution. Here is
a program that does the simulation and plots the estimate of the function.
Calc ; Ran(12345) $
Sample ; 1-1000$
Create ; xf=rnn(0,1) ; yfb=rnn(0,1) $