224
WHAT’S NEW IN THE EIGHTH EDITION:
One new question was added to the Problems and Applications section.
LEARNING OBJECTIVES:
By the end of this chapter, students should understand:
➢ what characteristics make a market competitive.
➢ how competitive firms decide how much output to produce.
➢ how competitive firms decide when to shut down production temporarily.
➢ how competitive firms decide whether to exit or enter a market.
➢ how firm behavior determines a market’s short-run and long-run supply curves.
CONTEXT AND PURPOSE:
Chapter 14 is the second chapter in a five-chapter sequence dealing with firm behavior and the
organization of industry. Chapter 13 developed the cost curves on which firm behavior is based. These
cost curves are employed in Chapter 14 to show how a competitive firm responds to changes in market
KEY POINTS:
• Because a competitive firm is a price taker, its revenue is proportional to the amount of output it
produces. The price of the good equals both the firm’s average revenue and its marginal revenue.
FIRMS IN
COMPETITIVE MARKETS
14
Chapter 14/Firms in Competitive Markets ❖ 225
• In the short run when a firm cannot recover its fixed costs, the firm will choose to shut down
temporarily if the price of the good is less than average variable cost. In the long run when the firm
can recover both fixed and variable costs, it will choose to exit if the price is less than average total
cost.
• In a market with free entry and exit, profit is driven to zero in the long run. In this long-run
equilibrium, all firms produce at the efficient scale, price equals the minimum of average total cost,
and the number of firms adjusts to satisfy the quantity demanded at this price.
CHAPTER OUTLINE:
I. What Is a Competitive Market?
A. The Meaning of Competition
1. Definition of competitive market: a market with many buyers and sellers trading
identical products so that each buyer and seller is a price taker.
2. There are three characteristics of a competitive market (sometimes called a perfectly
competitive market).
a. There are many buyers and sellers.
B. The Revenue of a Competitive Firm
Table 1
Remember that students have a difficult time understanding what a competitive
market is. The use of the word “competition” in economics is much different from
that in sports. This will lead students to often forget that these firms are generally
unconcerned with the actions of their rivals.
To help students understand price-taking behavior, use the example of common
stock. Have your students assume that they inherited 100 shares of stock in a well-
known company. Point out that these 100 shares may seem like a lot, but it is a very
small proportion of the total number of shares outstanding. If the student wanted to
226 ❖ Chapter 14/Firms in Competitive Markets
1. Total revenue from the sale of output is equal to price times quantity.
2. Definition of average revenue: total revenue divided by the quantity sold.
3. Definition of marginal revenue: the change in total revenue from an additional unit
sold.
II. Profit Maximization and the Competitive Firm’s Supply Curve
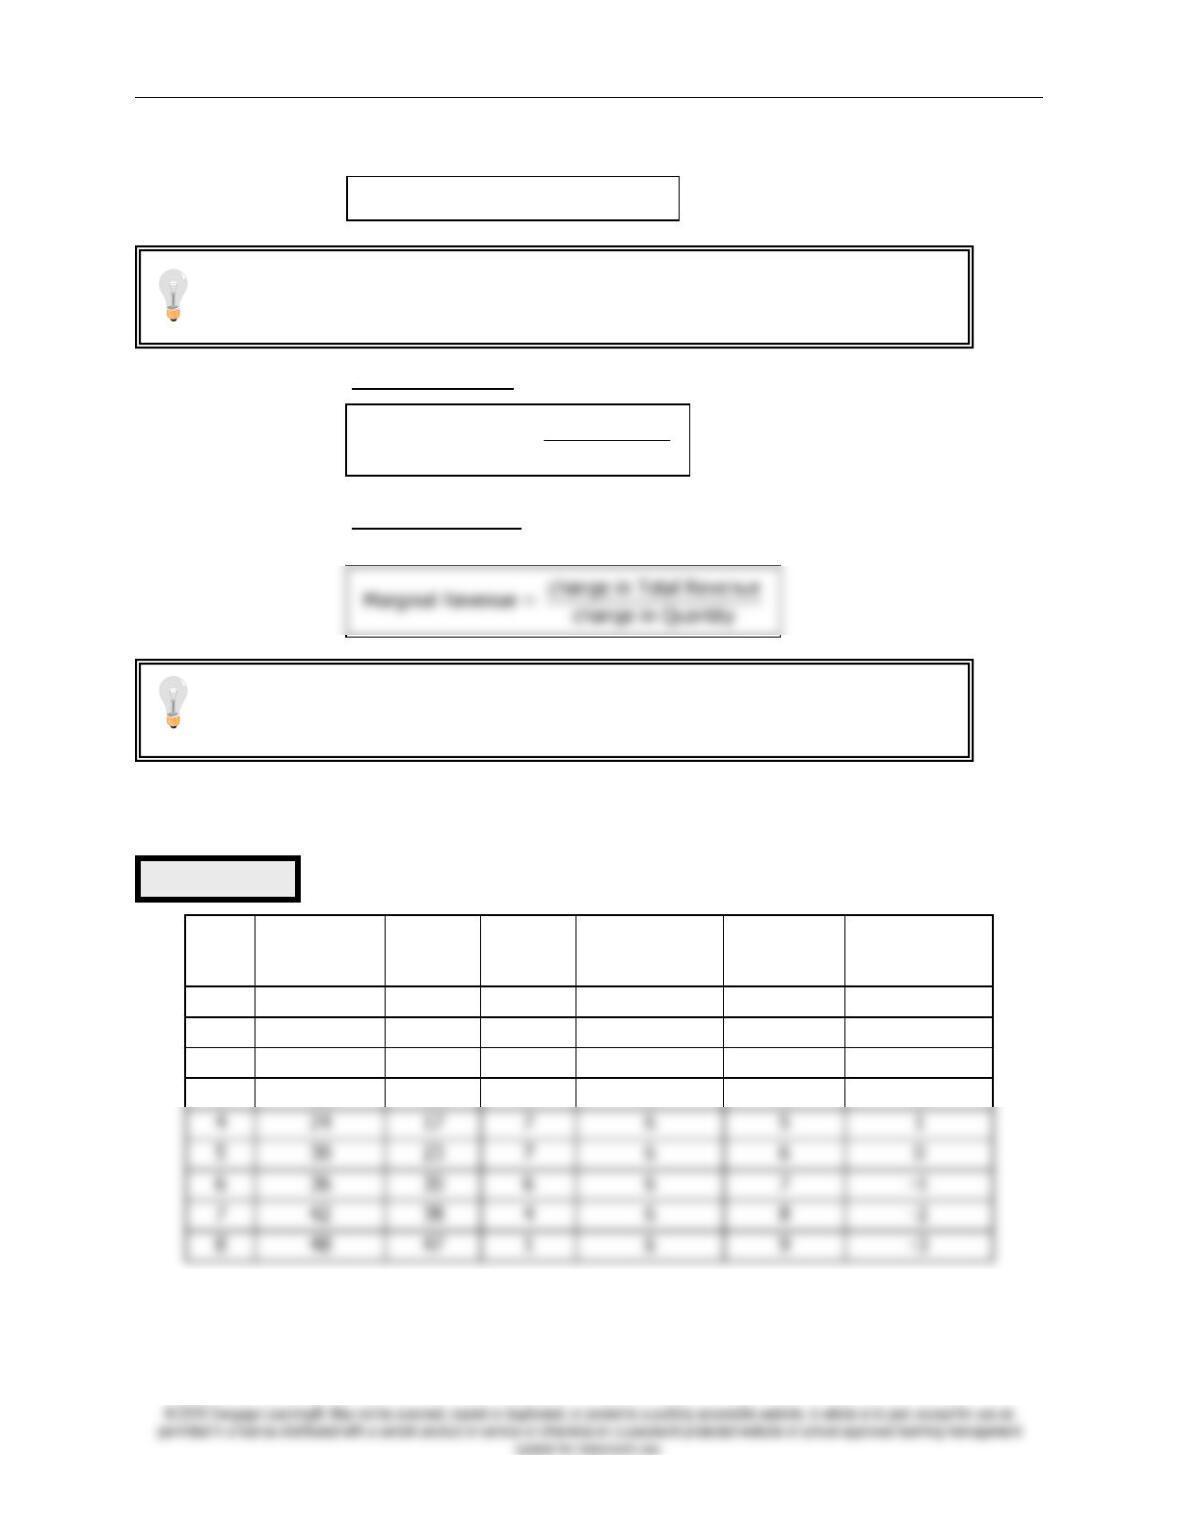
A. A Simple Example of Profit Maximization: The Vaca Family Dairy Farm
(1)
Q
(2)
Total
Revenue
(3)
Total
Cost
(4)
Profit
(5)
Marginal
Revenue
(6)
Marginal
Cost
(7)
Change in
Profit
0
$0
$3
$-3
—-
—-
—-
1
6
5
1
$6
$2
$4
2
12
8
4
6
3
3
3
18
12
6
6
4
2
4
24
17
7
6
5
1
5
30
7
6
6
0
6
36
30
6
6
7
7
42
38
4
6
8
8
48
1
6
9
1. In this example, profit is maximized if the farm produces four or five gallons of milk (see
column 4).
Total Revenue = Price Quantity
Total Revenue
Average Revenue = Quantity
Table 2
Make sure that students realize that firms in perfect competition can only change
their level of total revenue by varying their level of output because they have no
ability to change the price.
You may want to make it clear that, by definition, average revenue is always equal to
price. But marginal revenue is equal to price only for firms that operate in perfectly
competitive markets.
Chapter 14/Firms in Competitive Markets ❖ 227
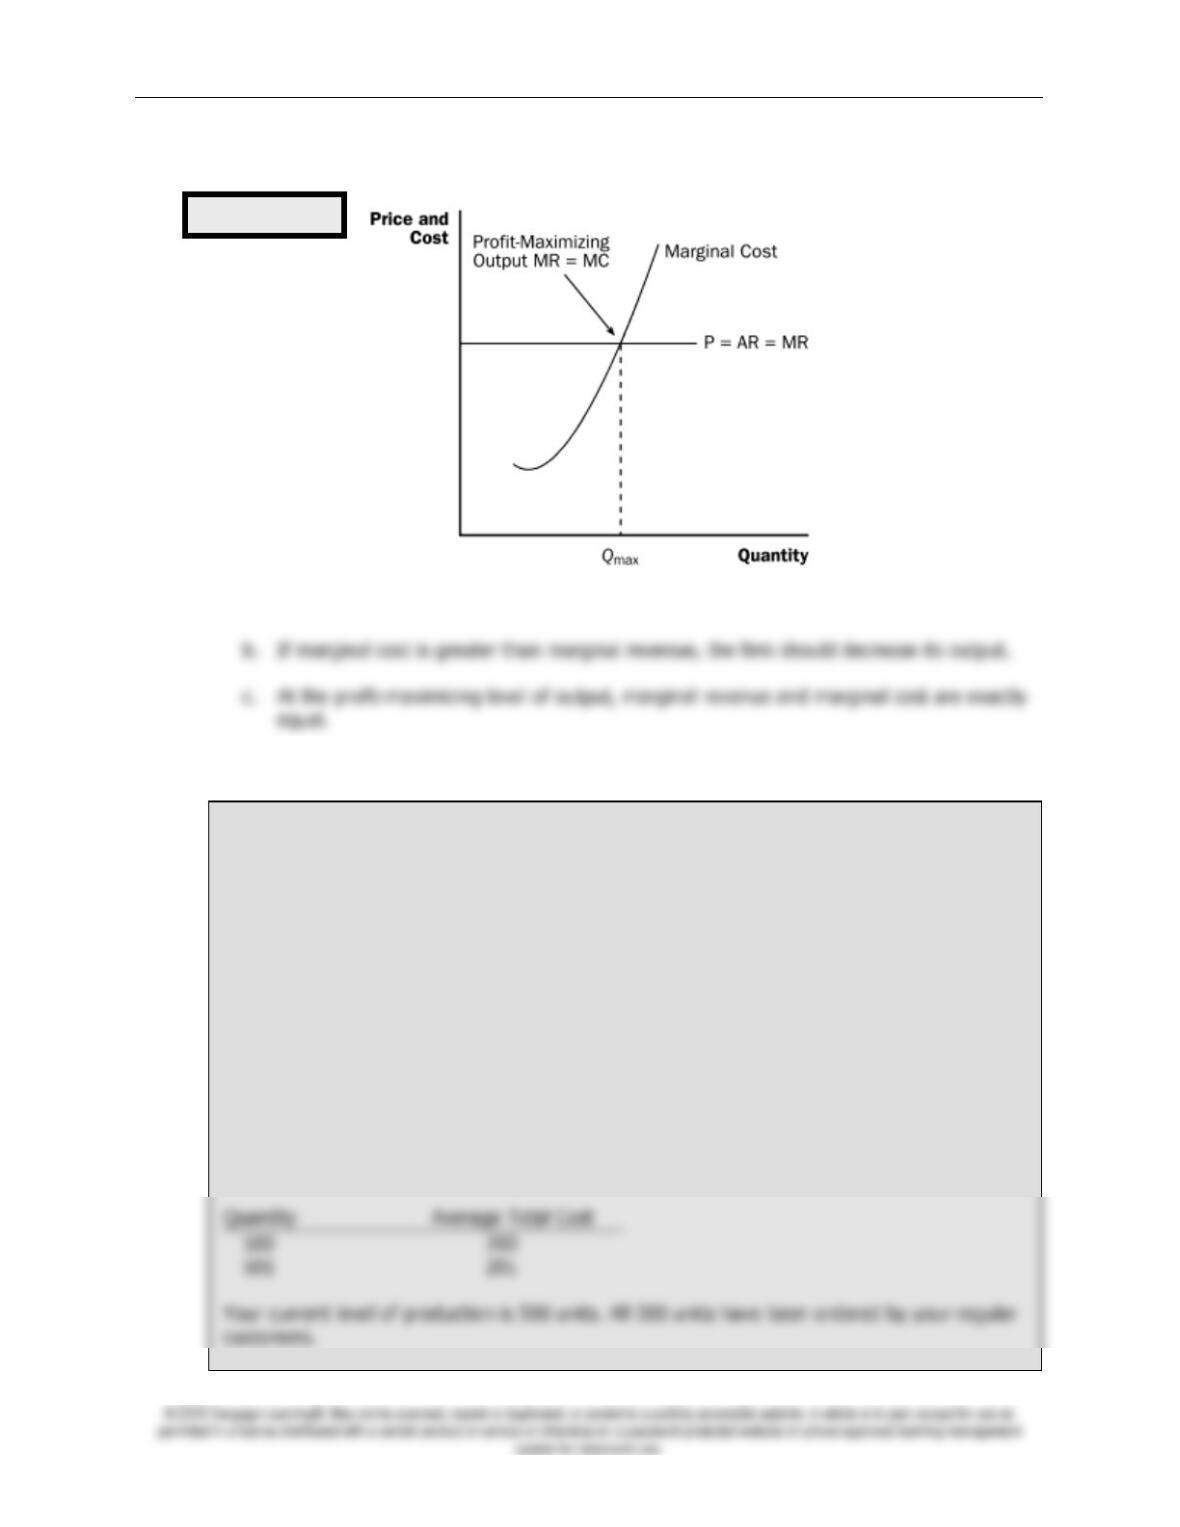
2. The profit-maximizing quantity can also be found by comparing marginal revenue and
marginal cost.
a. As long as marginal revenue exceeds marginal cost, increasing output will raise profit.
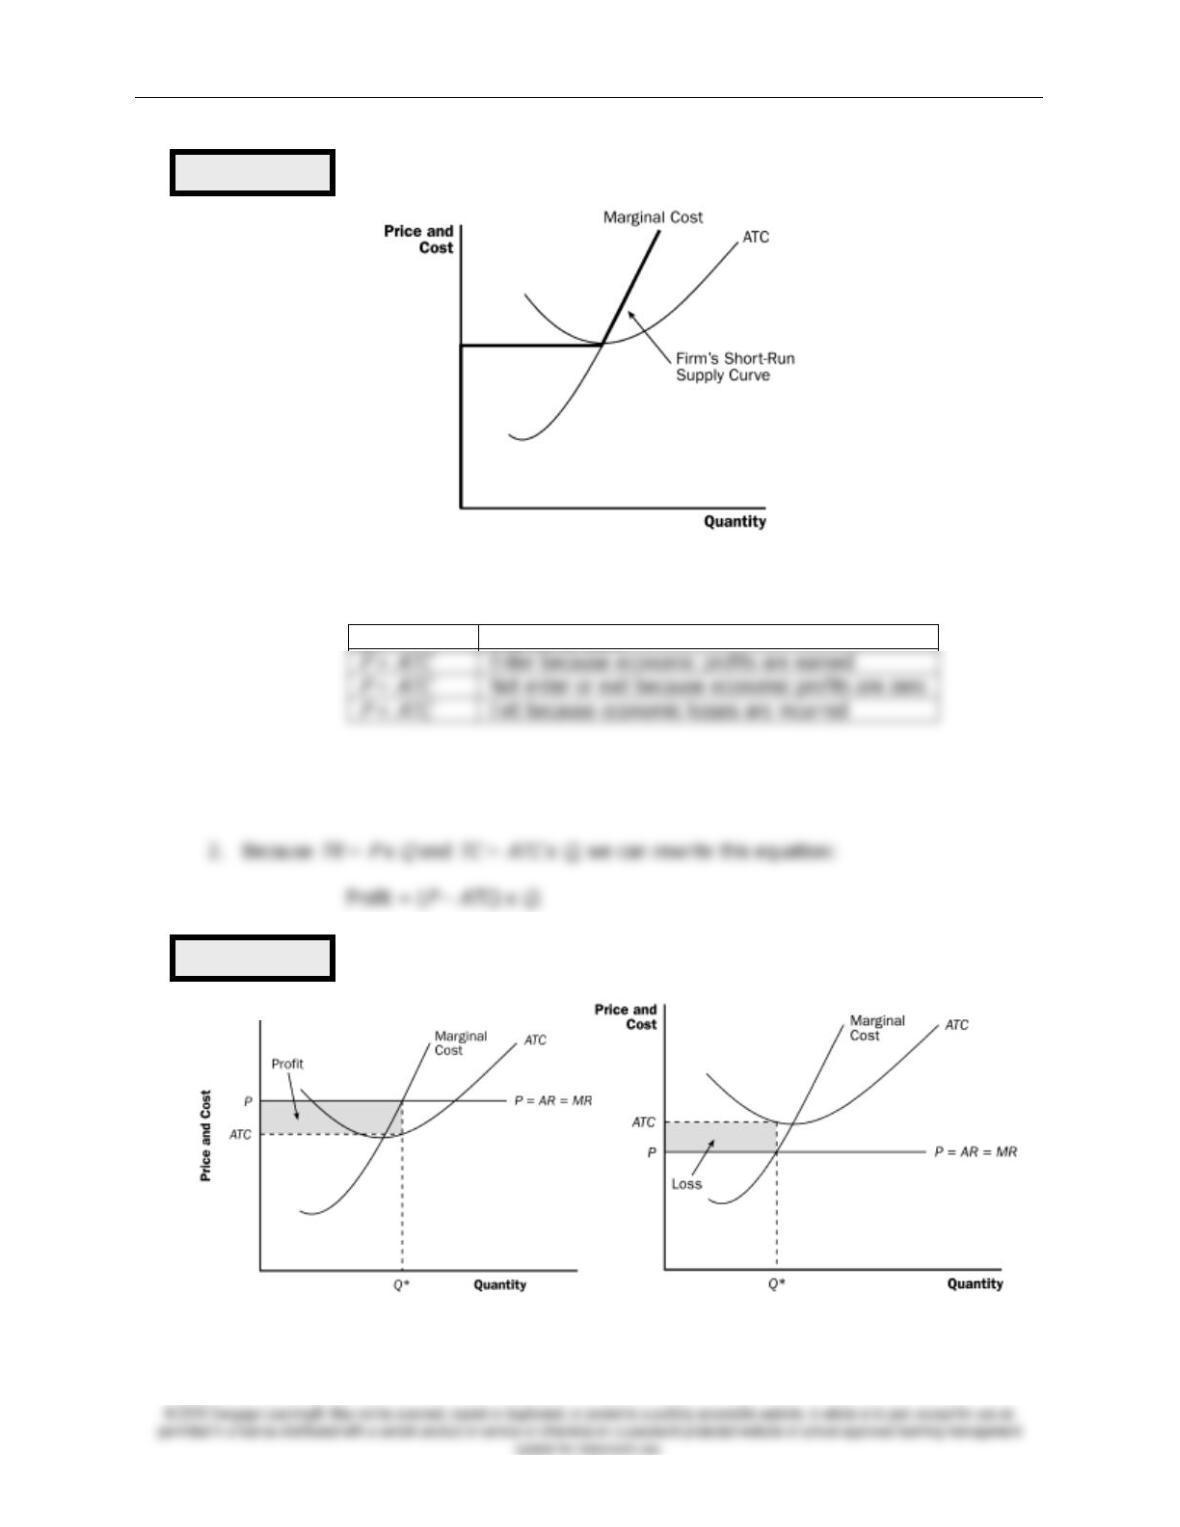
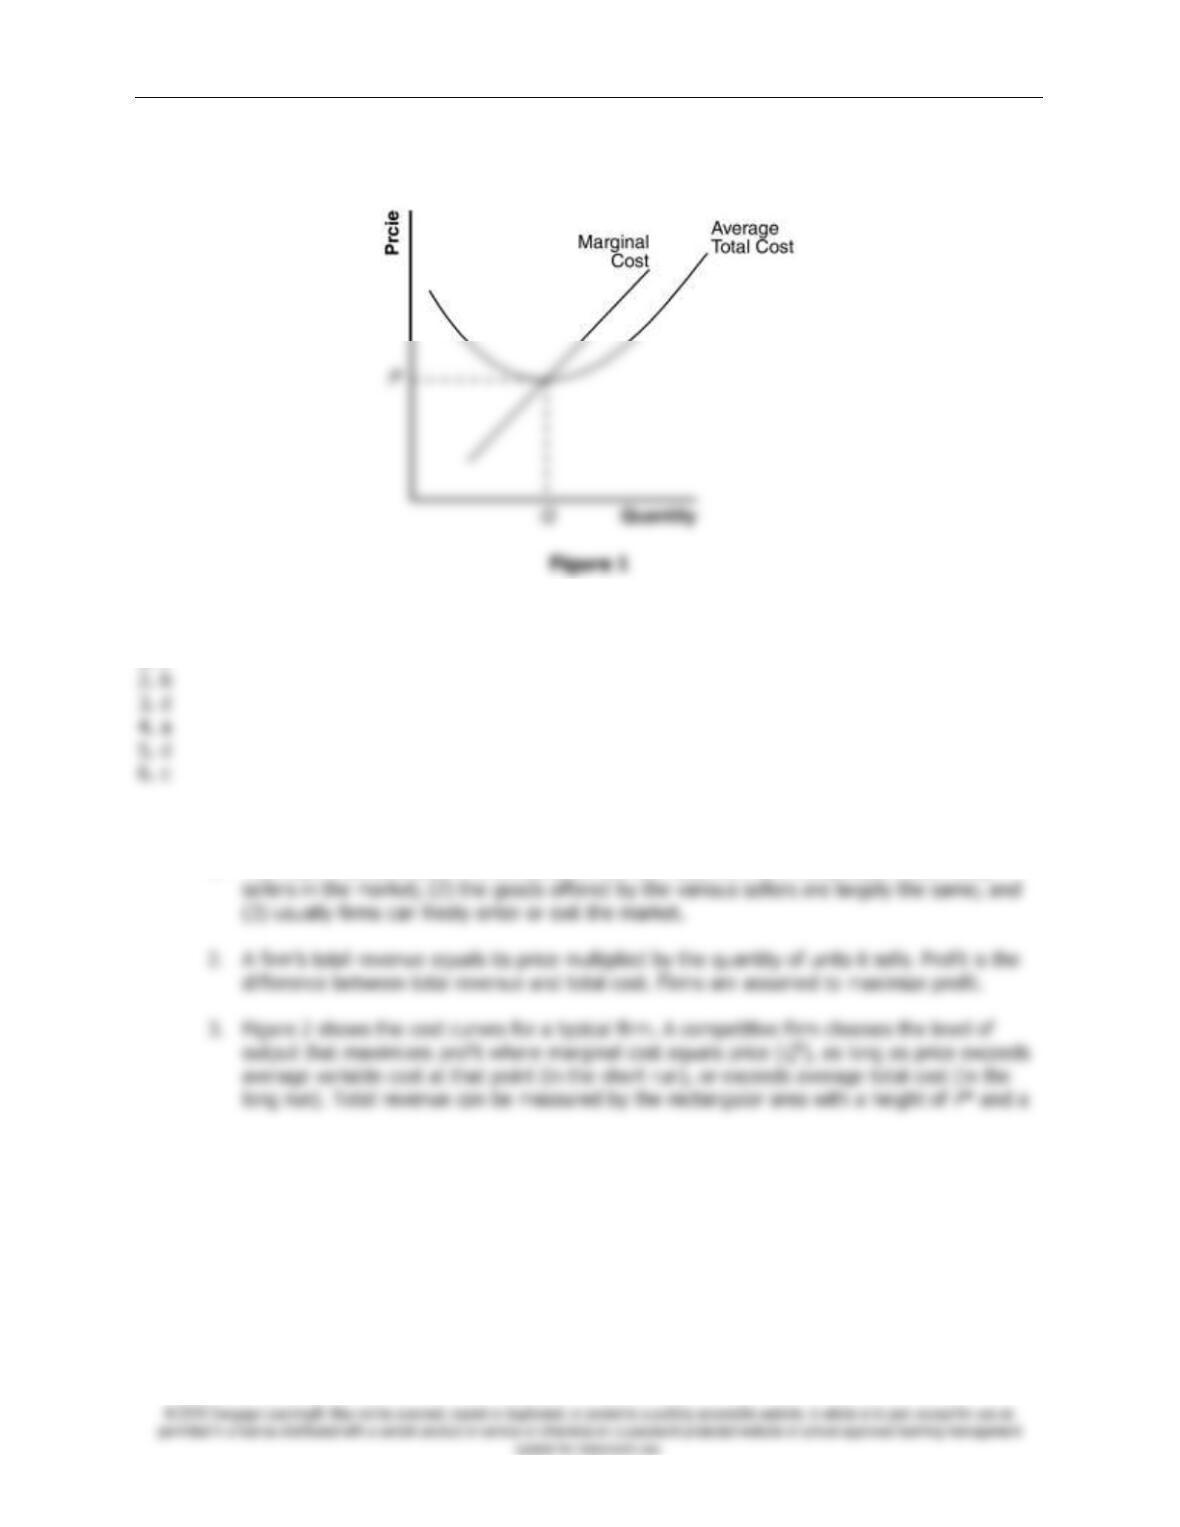
B. The Marginal-Cost Curve and the Firm’s Supply Decision
1. Cost curves have special features that are important for our analysis.
a. The marginal-cost curve is upward sloping.
b. The average-total-cost curve is U-shaped.
c. The marginal-cost curve crosses the average-total-cost curve at the minimum of average
total cost.
2. Marginal and average revenue can be shown by a horizontal line at the market price.
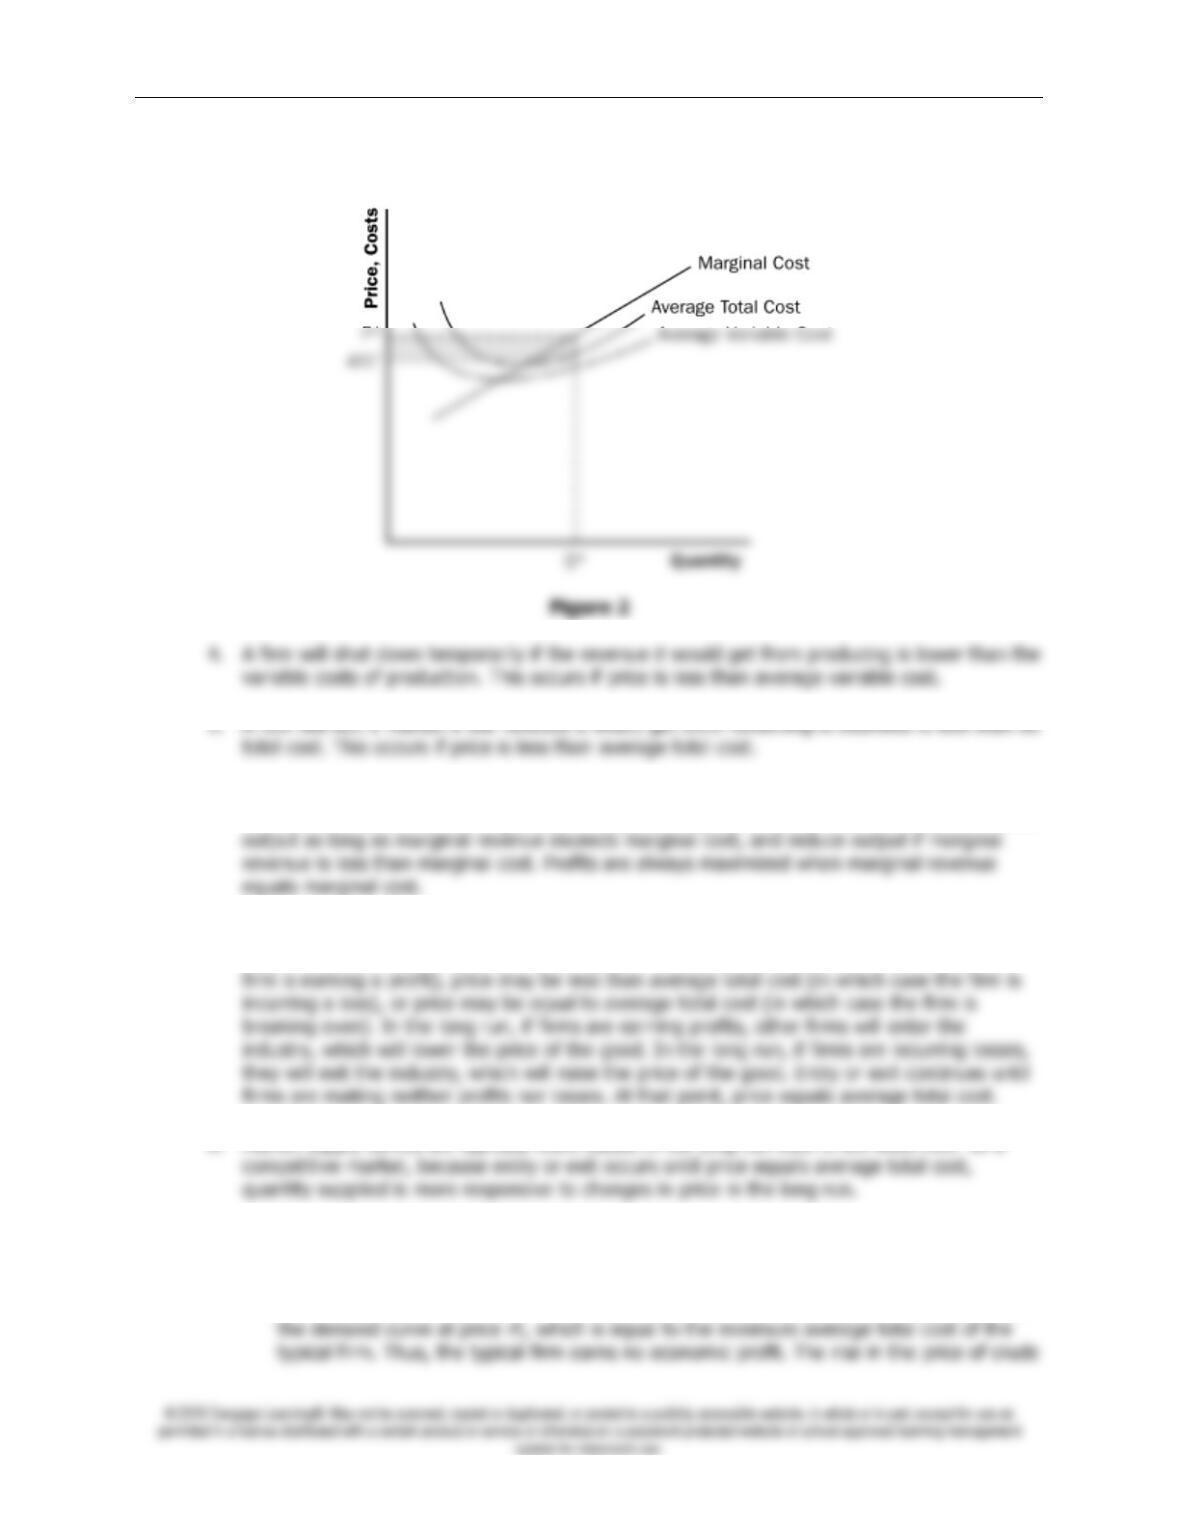
The graphs in this chapter often confuse students because they contain many
different curves at the same time. Thus, the first time you draw the profit-maximizing
decision of the firm, use only the marginal cost curve and the marginal revenue line.
Then, after students feel comfortable with this, add average total cost (to teach
students how to measure profit or loss). Last, add average variable cost to teach
students about the short-run shutdown decision of a firm earning an economic loss.
Point out that each of the short-run cost curves tells a different part of the story.
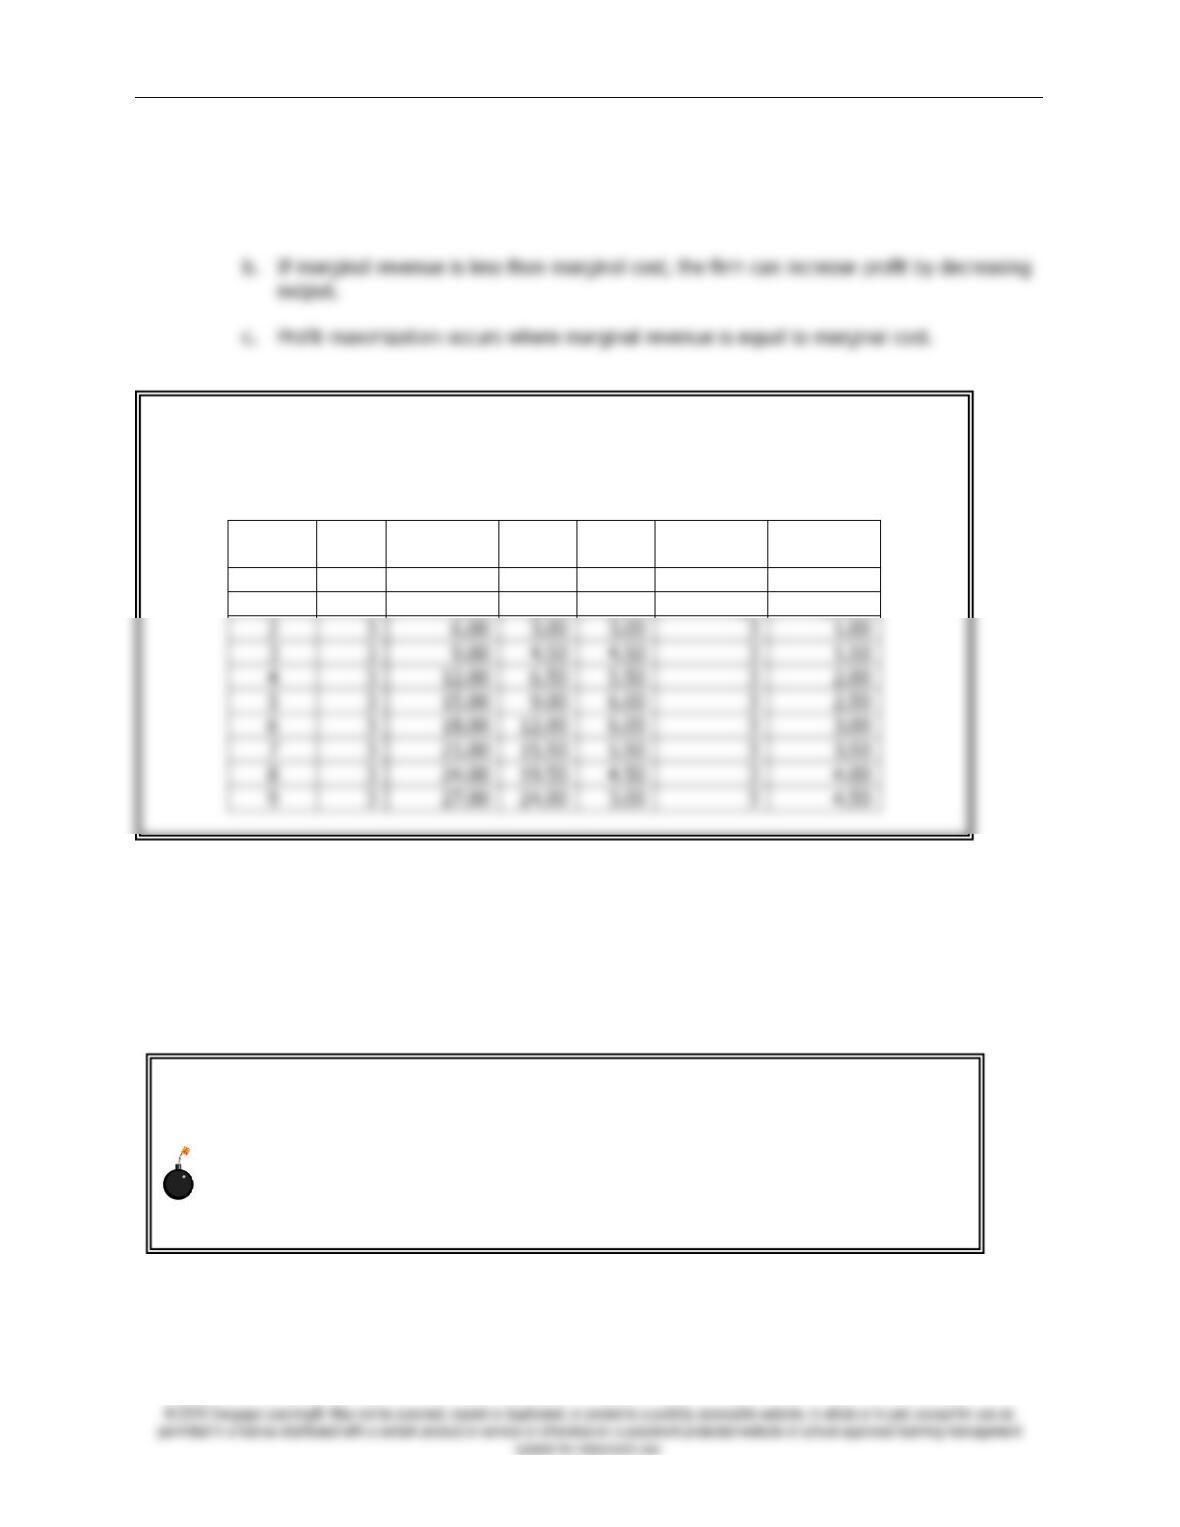
ALTERNATIVE CLASSROOM EXAMPLE:
Paulo’s Ping Pong Balls is a firm that operates in a competitive market. The ping pong balls
sell for $3 per package. Fill in the following table with the class’s help and discuss the profit-
maximizing level of output:
Output
Price
Total
Revenue
Total
Cost
Profit
Marginal
Revenue
Marginal
Cost
0
$3
$0.00
$1.50
$-1.50
—-
—-
1
3
3.00
2.00
1.00
$3
$0.50
2
3
6.00
3.00
3.00
1.00
3
3
9.00
4.50
4.50
1.50
4
3
12.00
6.50
5.50
2.00
5
3
15.00
9.00
6.00
2.50
6
3
18.00
12.00
6.00
3.00
7
3
21.00
15.50
5.50
3.50
8
3
24.00
19.50
4.50
4.00
228 ❖ Chapter 14/Firms in Competitive Markets
3. To find the profit-maximizing level of output, we can follow the same rules that we discussed
above.
a. If marginal revenue is greater than the marginal cost, the firm should increase its output.
4. These rules apply not only to competitive firms, but to firms with market power as well.
Activity 1—A Profitable Opportunity?
Type: In-class assignment
Topics: Profit maximization
Materials needed: None
Time: 15 minutes
Class limitations: Works in any size class
Purpose
This exercise reinforces the importance of marginal cost in decision-making. It shows average
costs can be misleading.
Instructions
Tell the class, “As a recent graduate of this college, you have landed a job in production
management for Universal Clones, Inc. You are responsible for the entire company on
weekends. Your costs are shown below.”
Figure 1
Chapter 14/Firms in Competitive Markets ❖ 229
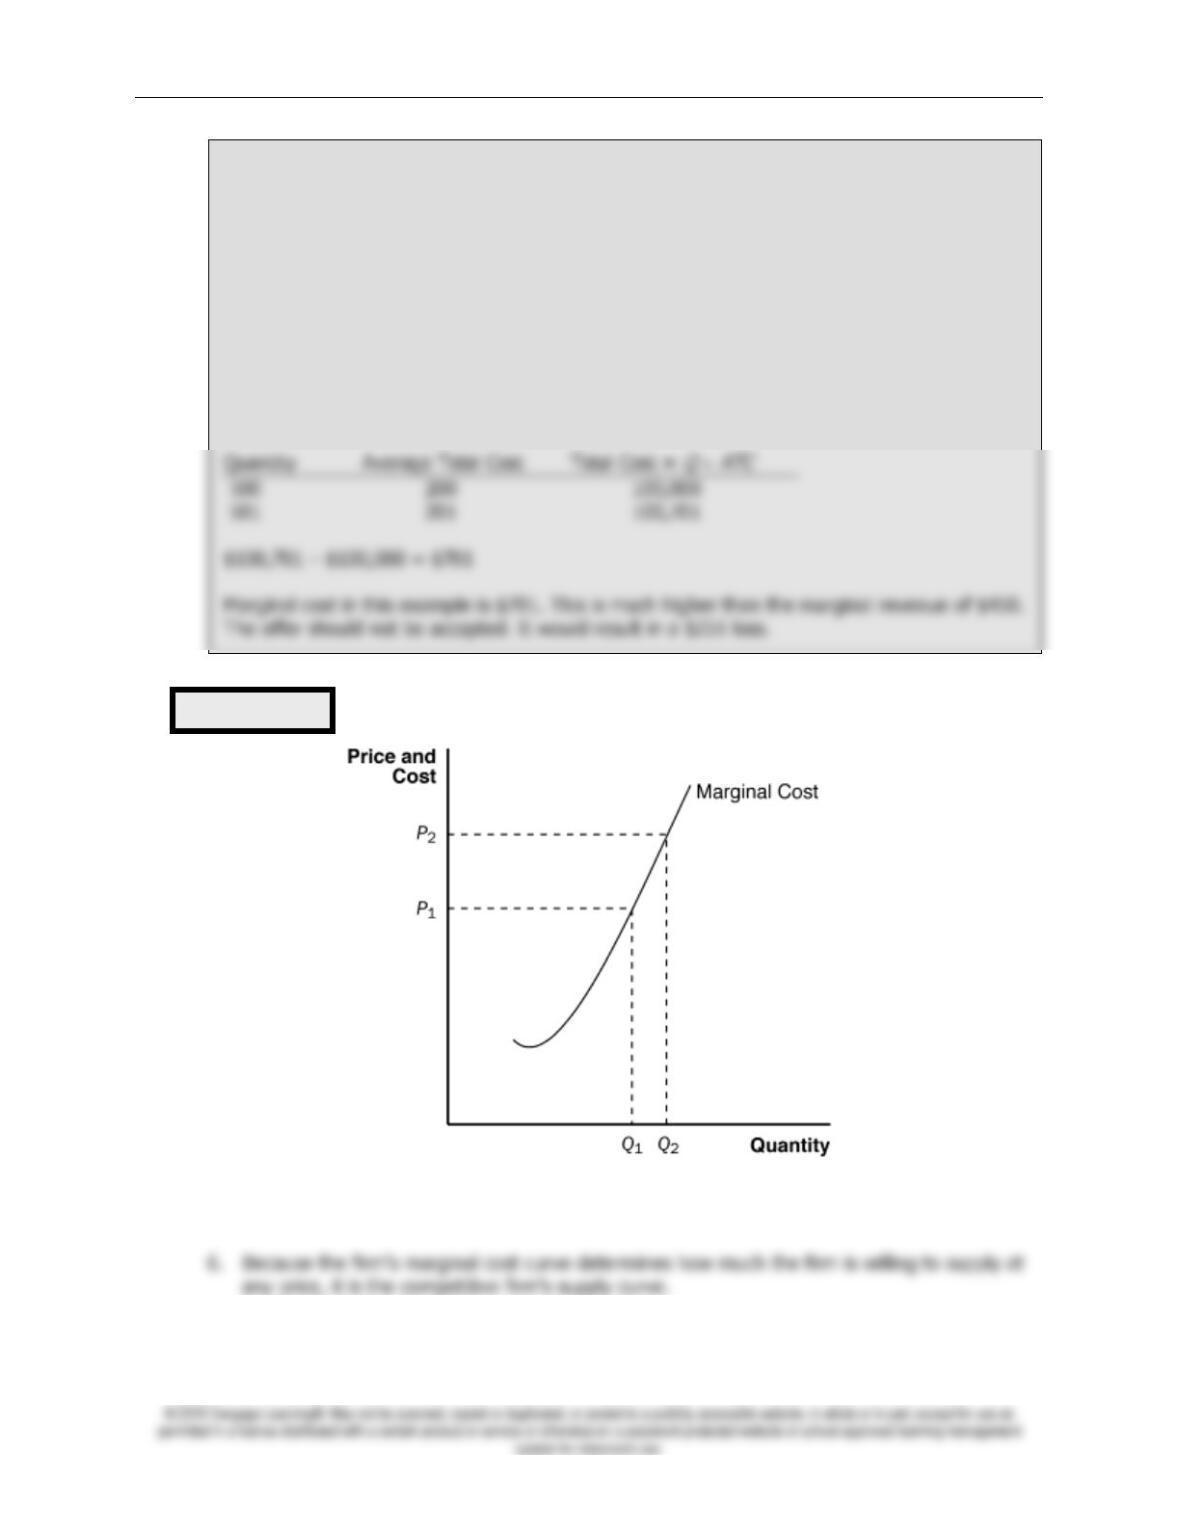
5. If the price in the market were to change to
P
2, the firm would set its new level of output by
equating marginal revenue and marginal cost.
C. The Firm’s Short-Run Decision to Shut Down
“The phone rings. It’s a new customer who wants to buy one unit of your product. This
means you would have to increase production to 501 units. Your new customer offers you
$450 to produce the extra unit.”
a. Should you accept this offer?
b. What is the net change in the firm’s profit?
Common Answers and Points for Discussion
Most students will answer “yes.” Selling something for $450 when the average cost of
production is $201 seems like good business. They are wrong.
The relevant comparison is marginal cost to marginal revenue. Marginal cost can be easily
calculated as the change in total costs.
Figure 2
230 ❖ Chapter 14/Firms in Competitive Markets
1. In certain circumstances, a firm will decide to shut down and produce zero output.
2. There is a difference between a temporary shutdown of a firm and an exit from the market.
a. A shutdown refers to a short-run decision not to produce anything during a specific
period of time because of current market conditions.
3. If a firm shuts down, it will earn no revenue and will have only fixed costs (no variable
costs).
4. Therefore, a firm will shut down if the revenue that it would earn from producing is less than
its variable costs of production:
Shut down if
TR
<
VC
.
5. Because
TR
=
P
x
Q
and
VC
=
AVC
x
Q
, we can rewrite this condition as:
6. We now can tell exactly what the firm will do to maximize profit (or minimize loss).
a. If the price is less than average variable cost, the firm will produce no output.
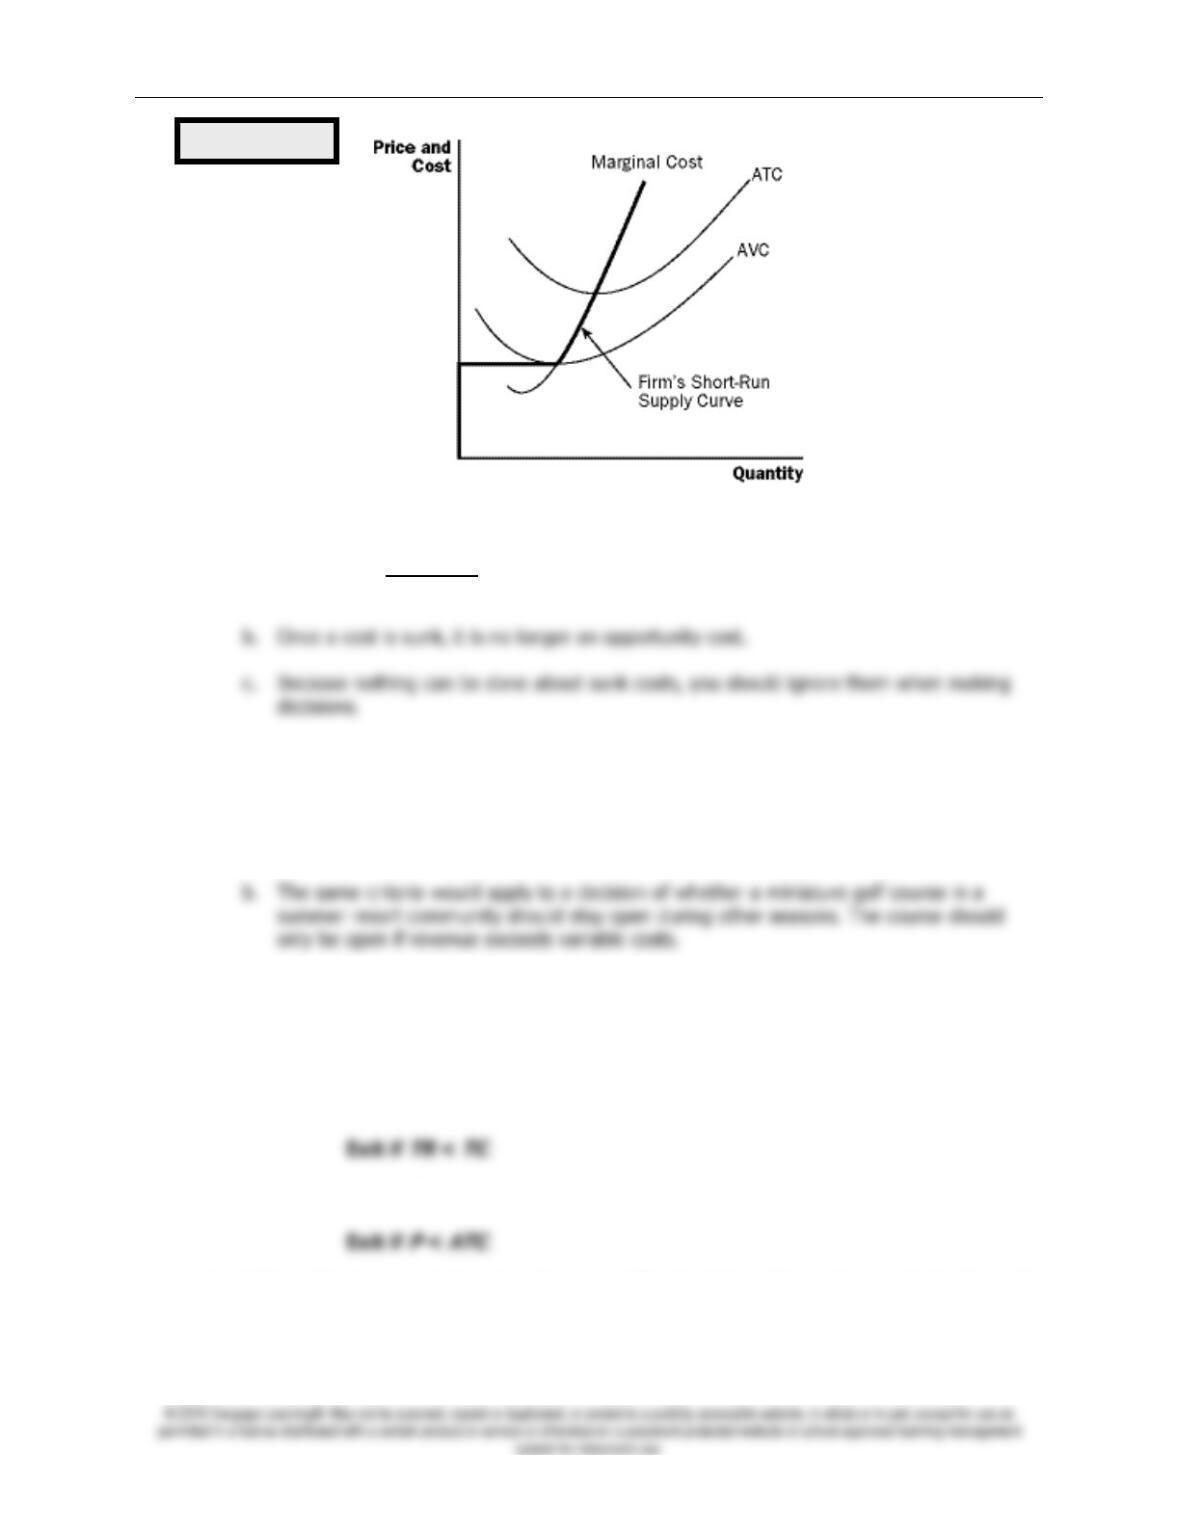
b. If the price is above average variable cost, the firm will produce the level of output
where marginal revenue (price) is equal to marginal cost.
7. Therefore, the competitive firm’s short-run supply curve is the portion of its marginal revenue
curve that lies above average variable cost.
Chapter 14/Firms in Competitive Markets ❖ 231
8. Spilt Milk and Other Sunk Costs
a. Definition of sunk cost: a cost that has been committed and cannot be
recovered.
9.
Case Study: Near-Empty Restaurants and Off-Season Miniature Golf
a. In making a decision of whether to open for lunch, a restaurant owner must weigh
revenue with variable costs. (Much of the cost of running a restaurant is somewhat
fixed.)
D. The Firm’s Long-Run Decision to Exit or Enter a Market
1. If a firm exits the market, it will earn no revenue, but it will have no costs as well.
2. Therefore, a firm will exit if the revenue that it would earn from producing is less than its
total costs:
3. Because
TR
=
P
x
Q
and
TC
=
ATC
x
Q
, we can rewrite this condition as:
4. A firm will enter an industry when there is profit potential, so this must mean that a firm will
enter if revenues will exceed costs:
Enter if
P
>
ATC
.
Figure 3
232 ❖ Chapter 14/Firms in Competitive Markets
5. Because, in the long run, a firm will remain in a market only if
P
≥
ATC
, the firm’s long-run
supply curve will be its marginal cost curve above
ATC
.
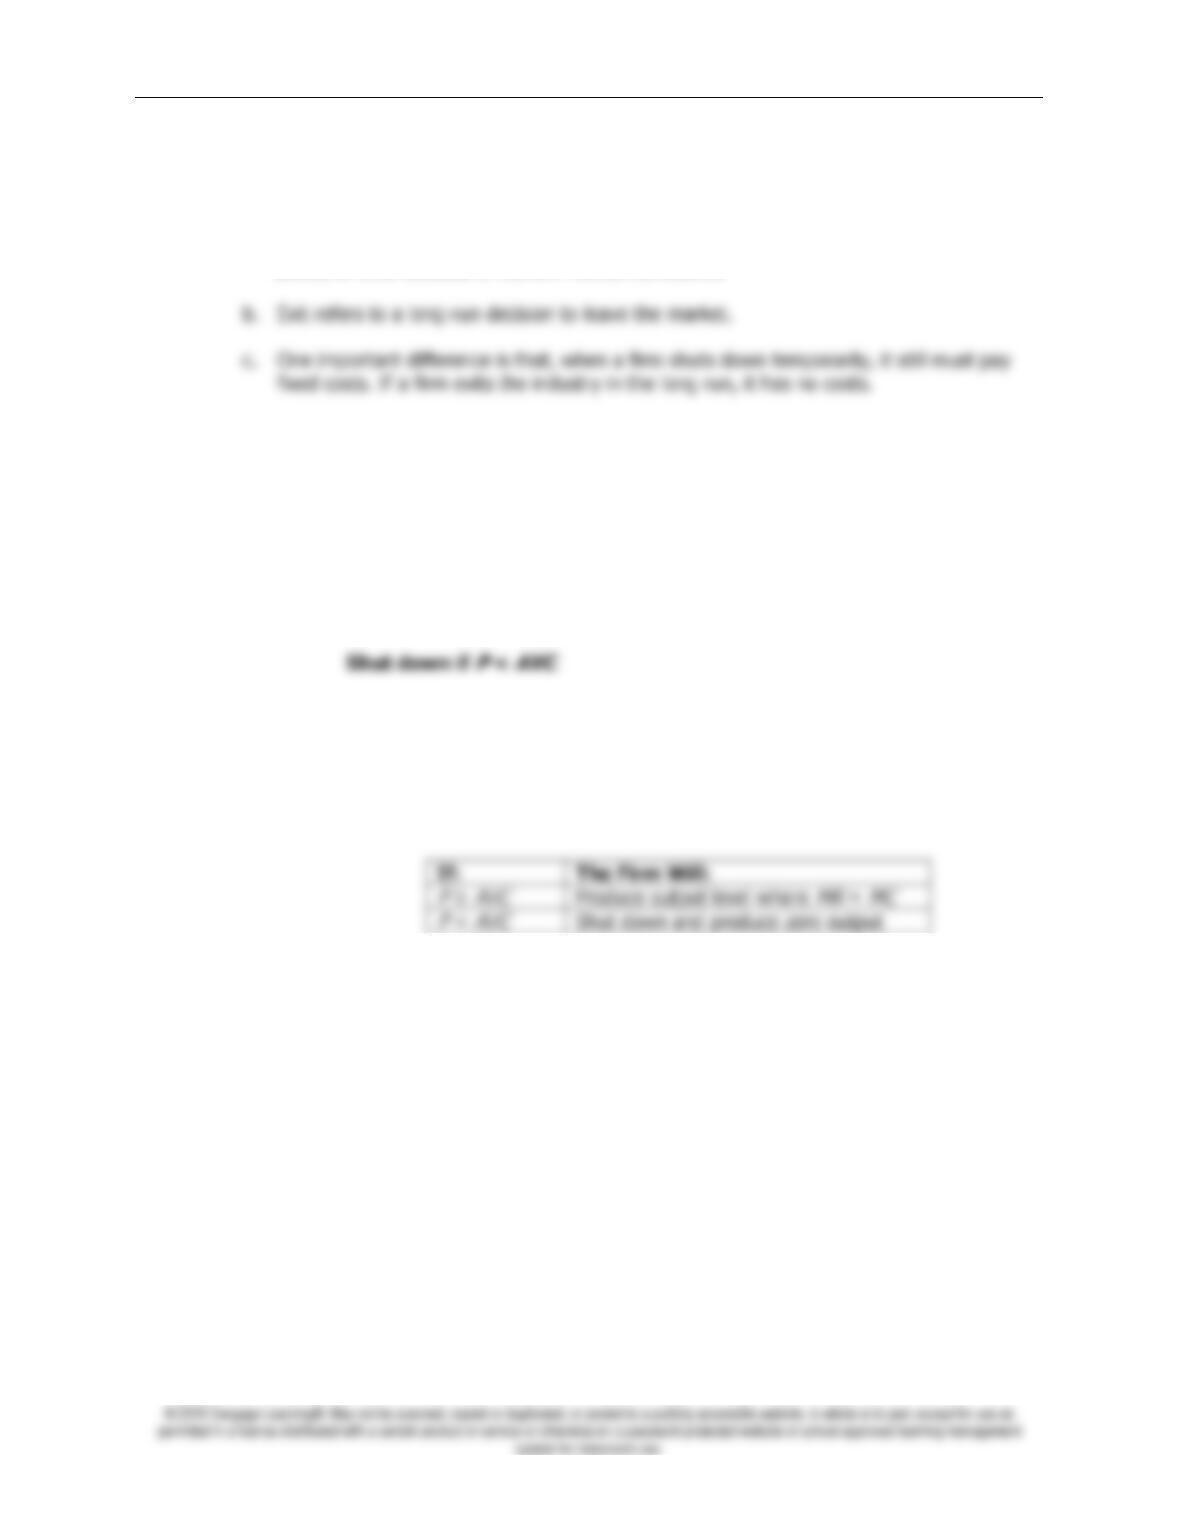
If:
The Firm Will:
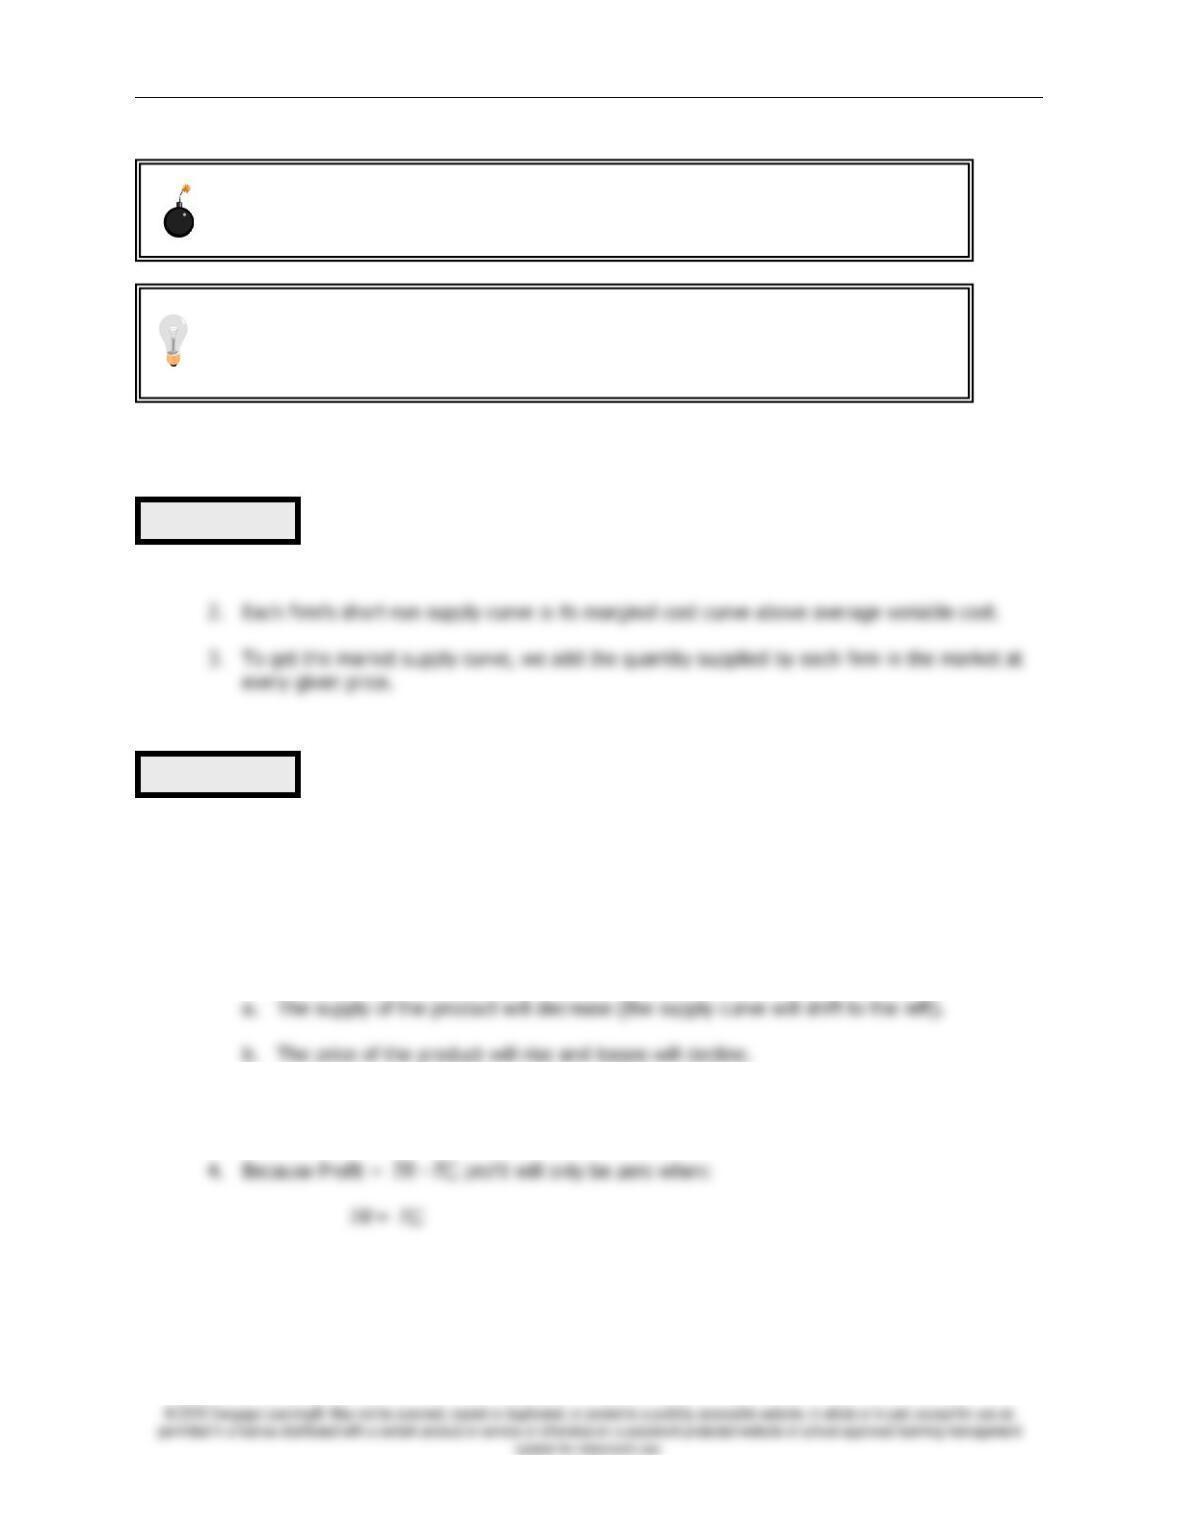
E. Measuring Profit in Our Graph for the Competitive Firm
1. Recall that Profit =
TR
–
TC
.
3. Using this equation, we can measure the amount of profit (or loss) at the firm’s profit-
maximizing level of output (or loss-minimizing level of output).
Figure 4
Figure 5
Chapter 14/Firms in Competitive Markets ❖ 233
III. The Supply Curve in a Competitive Market
A. The Short Run: Market Supply with a Fixed Number of Firms
1. Example: a market with 1,000 identical firms.
B. The Long Run: Market Supply with Entry and Exit
1. If firms in a market are earning profit, this will attract new firms.
a. The supply of the product will increase (the supply curve will shift to the right).
b. The price of the product will fall and profit will decline.
2. If firms in an industry are incurring losses, firms will exit.
3. At the end of this process of entry or exit, firms that remain in the market must be earning
zero economic profit.
5. Because
TR
=
P
×
Q
and
TC
=
ATC
×
Q
, we can rewrite this as:
P
=
ATC
.
Figure 6
Figure 7
Keep reminding students that economic profits and losses are different from
accounting profits and losses. Point out that economic cost includes the cost of all
resources, including a “normal return or profit” to compensate the firm’s owner for
the risks and other efforts put into the business.
Students tend to want to use the point of minimum average total cost when finding
profit on the graph. Remind them to always find the average total cost of the profit-
maximizing level of output.
234 ❖ Chapter 14/Firms in Competitive Markets
6. Therefore, the process of entry or exit ends only when price and average total cost become
equal.
C. Why Do Competitive Firms Stay in Business If They Make Zero Profit?
1. Profit is equal to total revenue minus total cost.
2. To an economist, total cost includes all of the opportunity costs of the firm.
3. When a firm is earning zero profit, this must mean that the firm‘s revenues are compensating
the firm’s owners for their opportunity costs.
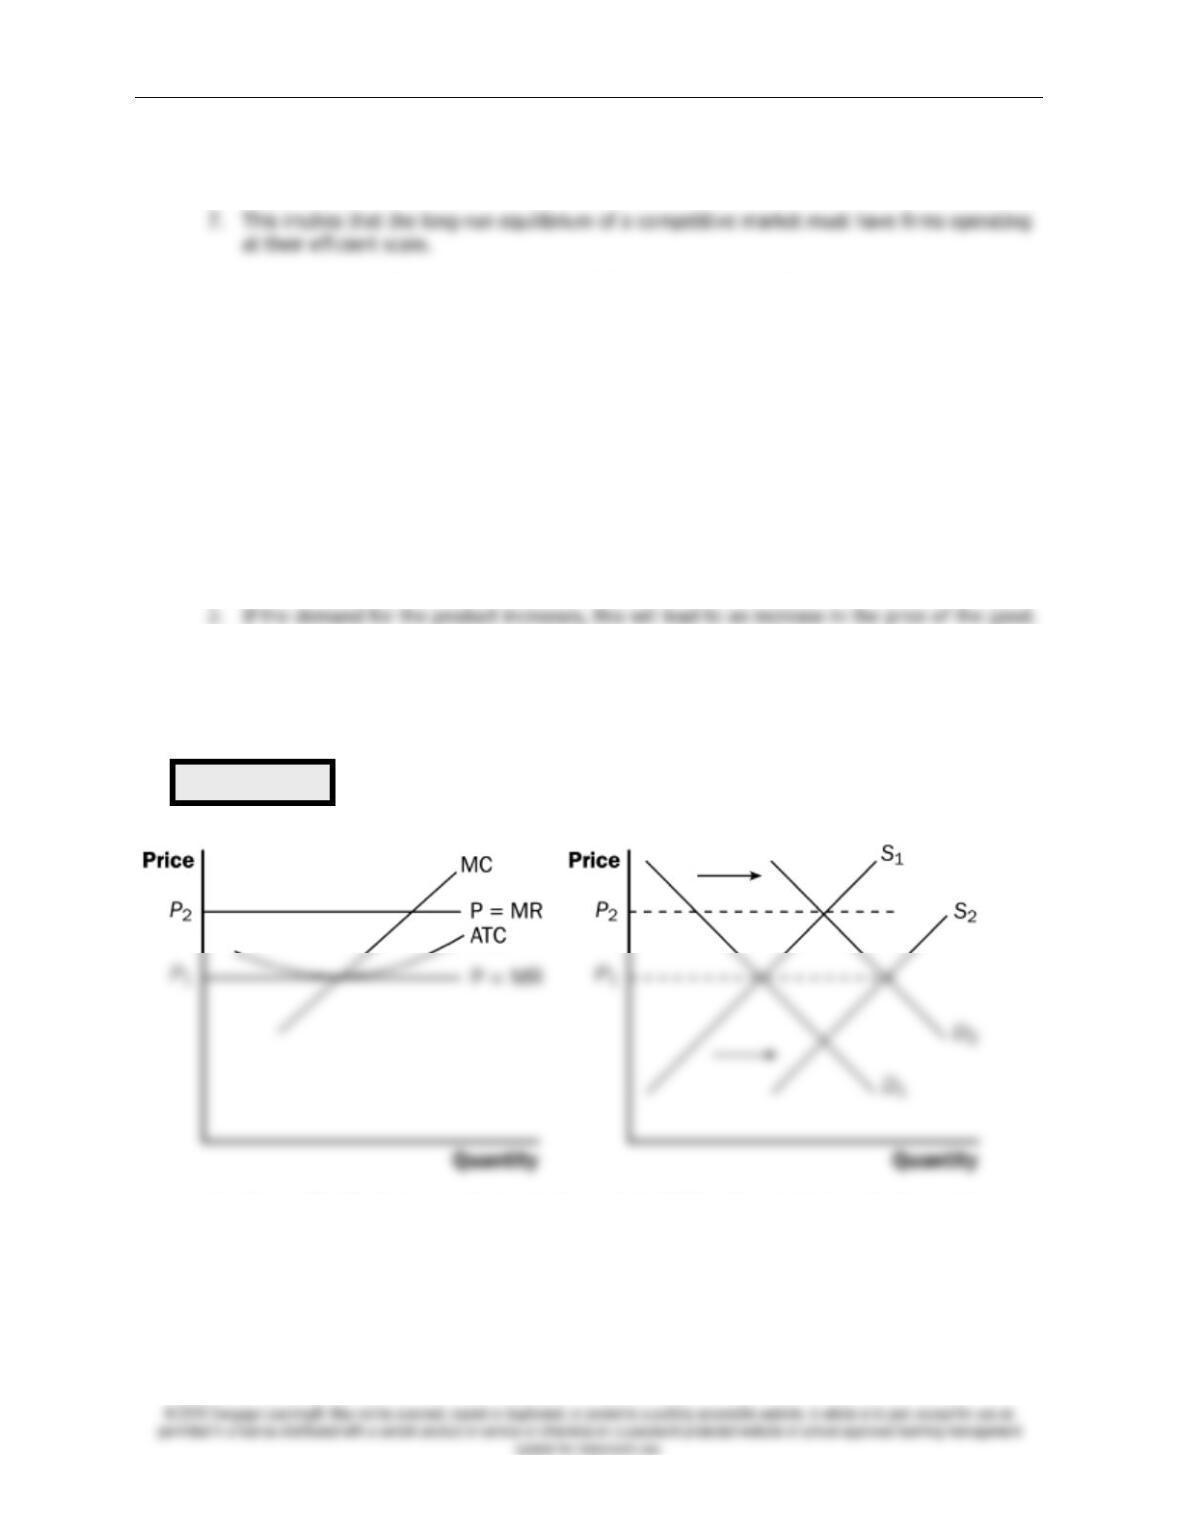
D. A Shift in Demand in the Short Run and Long Run
1. Assume that the market begins in long-run equilibrium. This means that firms are earning
zero profit and price equals the minimum of average total cost.
3. Firms will respond to the increase in price by producing more in the short run.
4. Because price is now greater than average total cost, firms are earning profit.
5. The profit will attract new firms into the market, shifting the supply curve to the right.
6. This will lower price until it falls back to the minimum of average total cost and firms are
once again earning zero economic profit.
Figure 8
Chapter 14/Firms in Competitive Markets ❖ 235
E. Why the Long-Run Supply Curve Might Slope Upward
1. Because we assumed that all potential entrants faced the same costs as existing firms,
average total cost of each firm was unaffected by the entry of new firms into the market.
2. In this situation, the long-run supply of the market will be a horizontal line at minimum
average total cost.
3. However, there are two possible reasons why this may not be the case.
4. In this situation, the long-run supply curve of the market will be upward sloping.
SOLUTIONS TO TEXT PROBLEMS:
Quick Quizzes
revenue doubles.
2. A profit-maximizing competitive firm sets price equal to its marginal cost. If price were above
3. In the long run, with free entry and exit, the price in the market is equal to both a firm’s
After going through the effects of an increase in demand, ask students to work
through the effects of a decrease in demand. Make sure that they can see that firms
would exit the market because of economic losses.
No matter what the shape of the long-run supply curve, an increase in demand will
always lead to a rise in the price in the short run and a decrease in demand will
always lead to a drop in price in the short run.
236 ❖ Chapter 14/Firms in Competitive Markets
long run, entry into and exit from the market drive the price of the good to the minimum
point on the average-total-cost curve.
Chapter Quick Quiz
1. c
Questions for Review
1. The main characteristics of a competitive firm are: (1) there are many buyers and many
Chapter 14/Firms in Competitive Markets ❖ 237
base of
Q
*. Total cost can be measured by the rectangular area with a height of
ATC’
and a
base of
Q
*.
6. A competitive firm’s price equals its marginal cost in both the short run and the long run. In
both the short run and the long run, price equals marginal revenue. The firm should increase
7. The competitive firm’s price must equal the minimum of its average total cost only in the
long run. In the short run, price may be greater than average total cost (in which case the
8. Market supply curves are typically more elastic in the long run than in the short run. In a
Problems and Applications
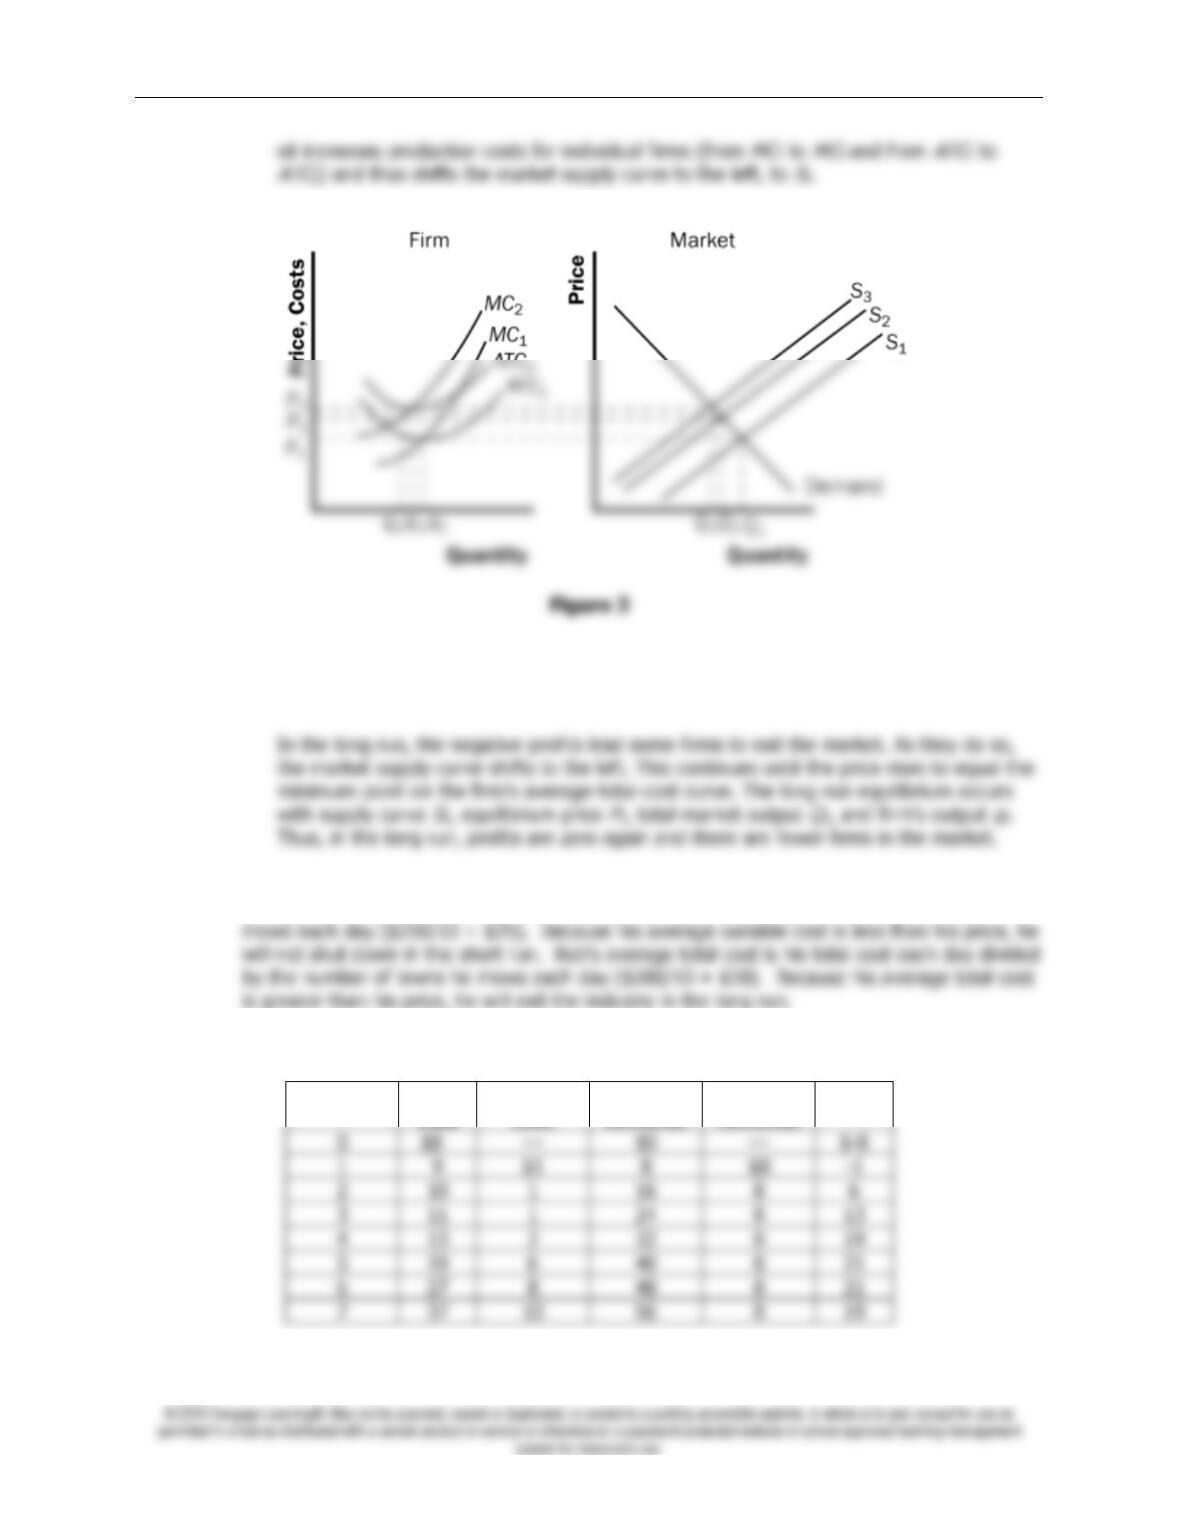
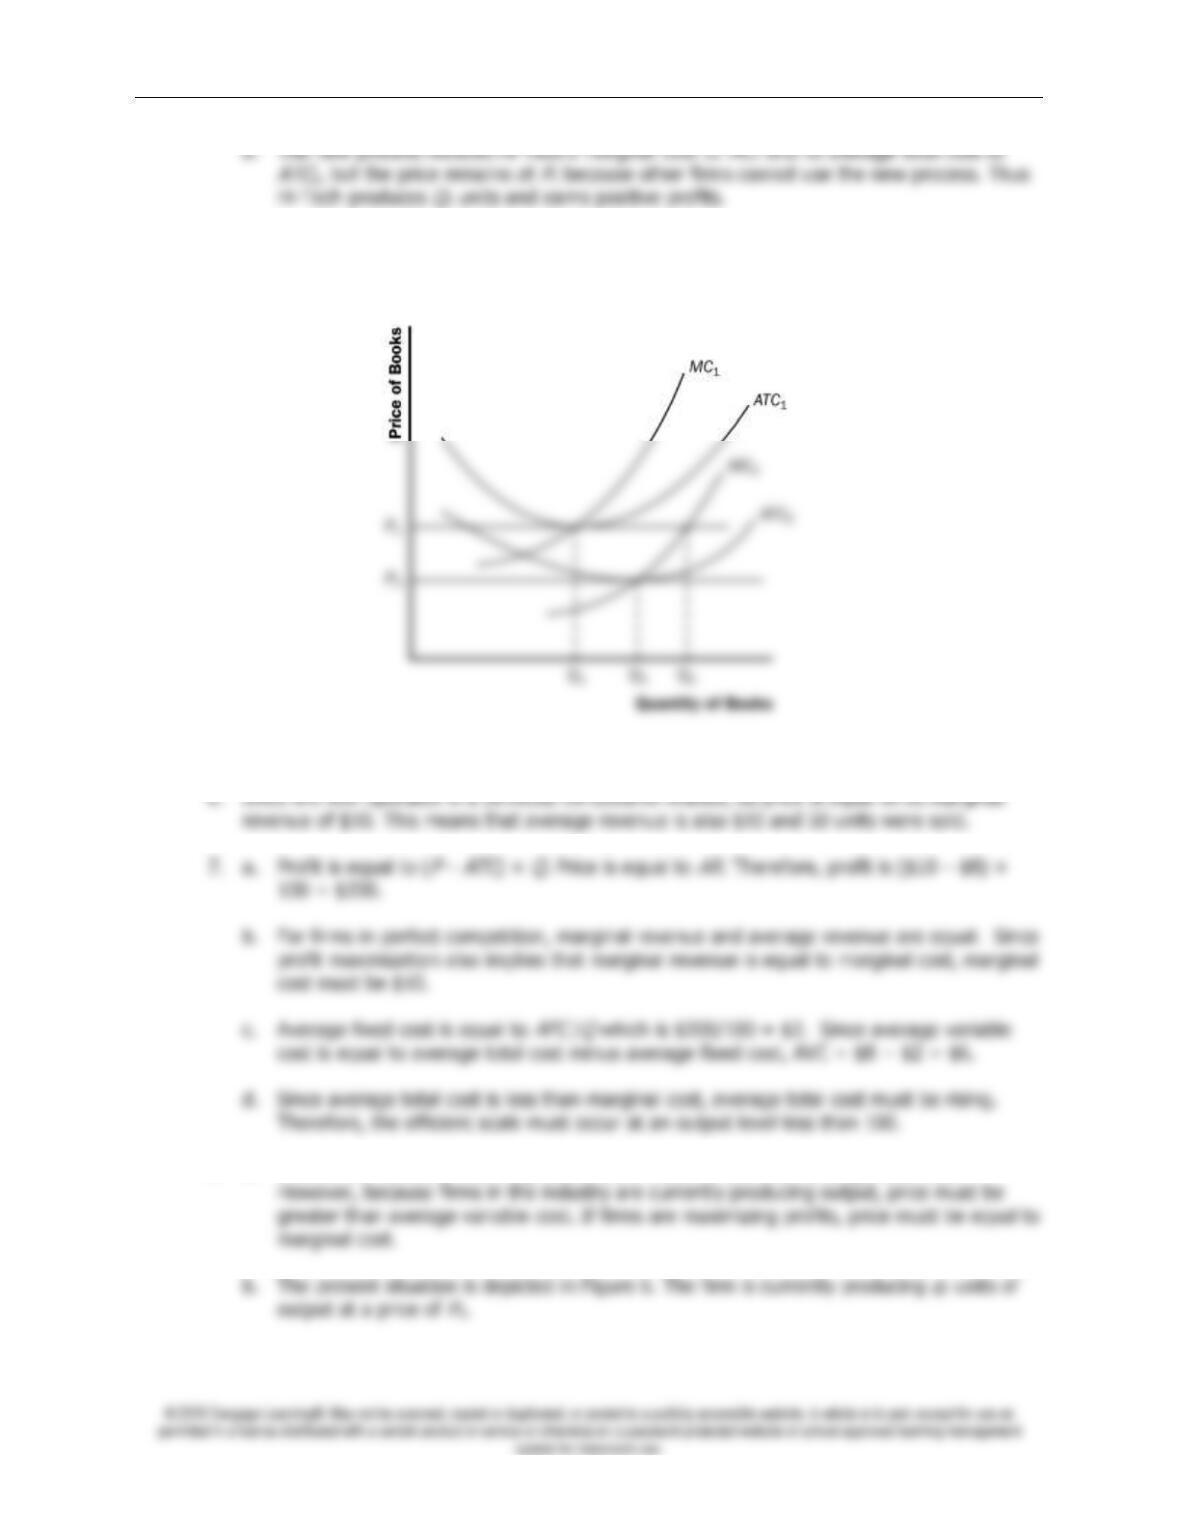
1. a. As shown in Figure 3, the typical firm‘s initial marginal-cost curve is
MC
1 and its average-
total-cost curve is
ATC
1. In the initial equilibrium, the market supply curve,
S
1, intersects
238 ❖ Chapter 14/Firms in Competitive Markets
b. When the market supply curve shifts left to
S
2, the equilibrium price rises from
P
1 to
P
2,
but the price does not increase by as much as the increase in marginal cost for the firm.
As a result, price is less than average total cost for the firm, so profits are negative.
2. Bob’ total variable cost is his total cost each day less his fixed cost ($280 – $30 = $250). His
average variable cost is his total variable cost each day divided by the number of lawns he
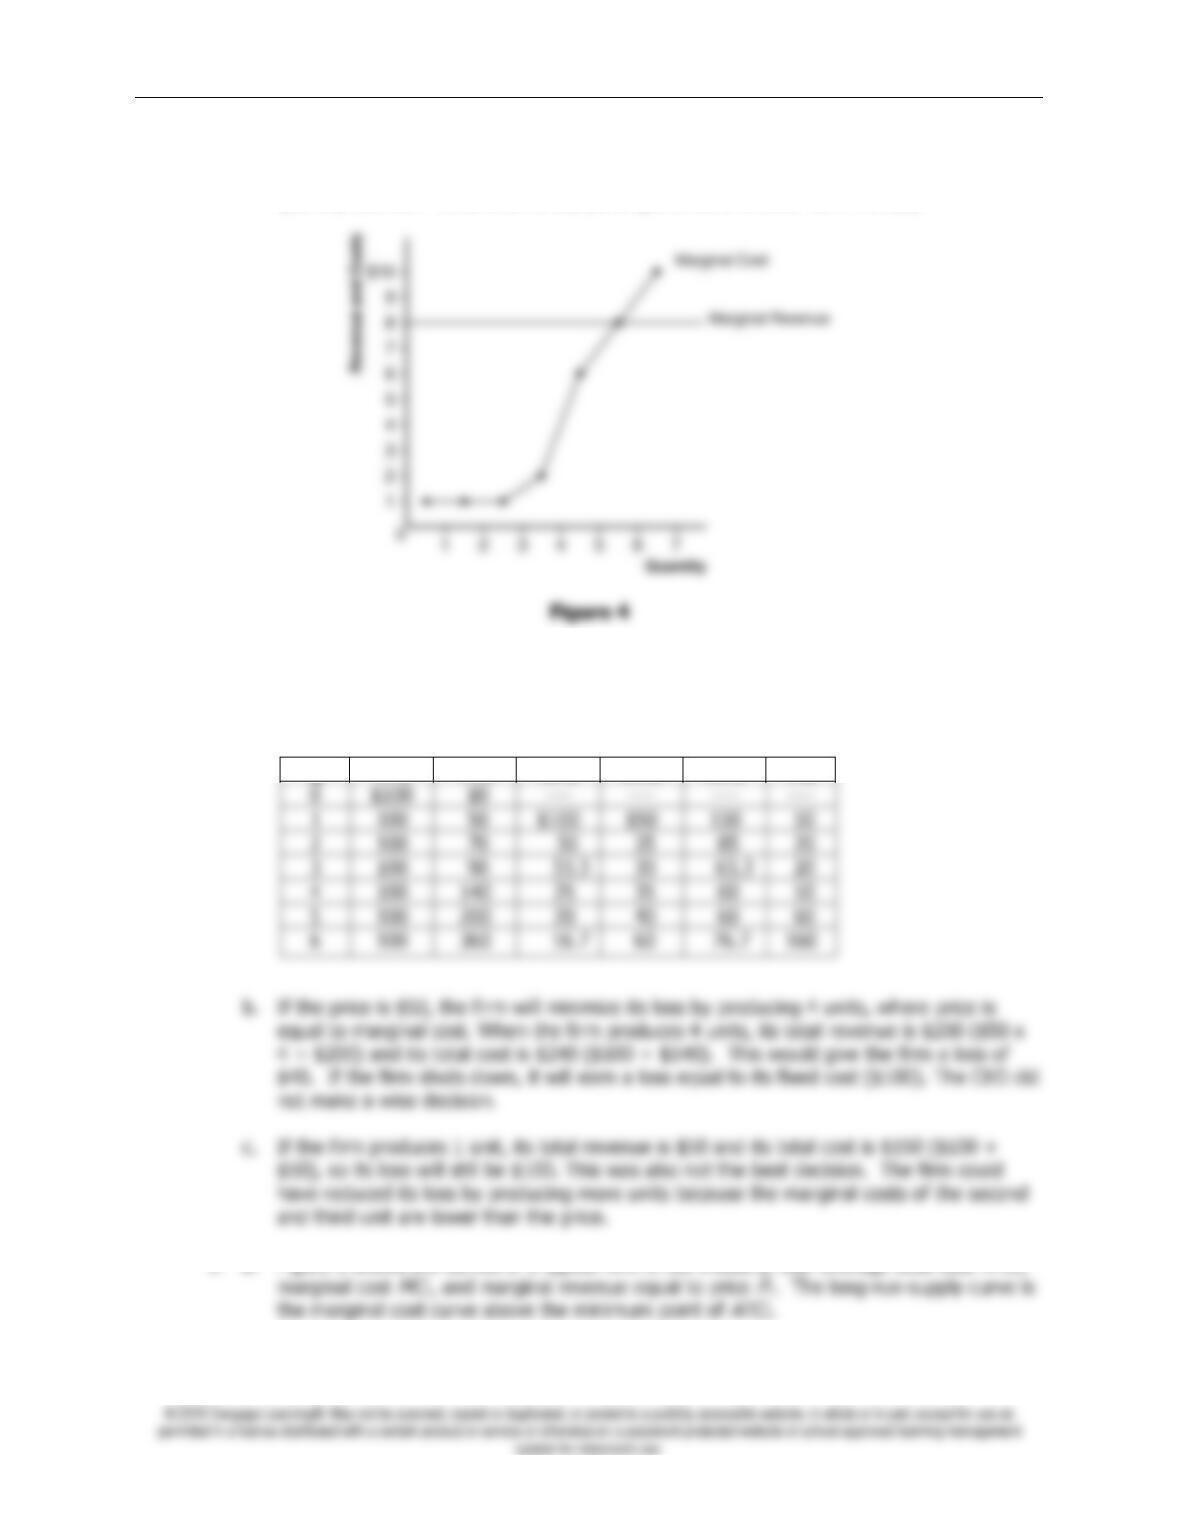
3. Here is the table showing costs, revenues, and profits:
Quantity
Total
Cost
Marginal
Cost
Total
Revenue
Marginal
Revenue
Profit
a. The firm should produce five or six units to maximize profit.
Chapter 14/Firms in Competitive Markets ❖ 239
b. Marginal revenue and marginal cost are graphed in Figure 4. The curves cross at a
quantity between five and six units, yielding the same answer as in Part (a).
c. This industry is competitive because marginal revenue is the same for each quantity. The
industry is not in long-run equilibrium, because profit is not equal to zero.
4. a. Costs are shown in the following table:
5. a. Figure 5 shows the curves of a typical firm in the industry, with average total cost
ATC
Q
TFC
TVC
AFC
AVC
ATC
MC
240 ❖ Chapter 14/Firms in Competitive Markets
c. When the patent expires and other firms are free to use the technology, all firms’
average-total-cost curves decline to
ATC
2, so the market price falls to
P
3 and firms earn
zero profit.
Figure 5
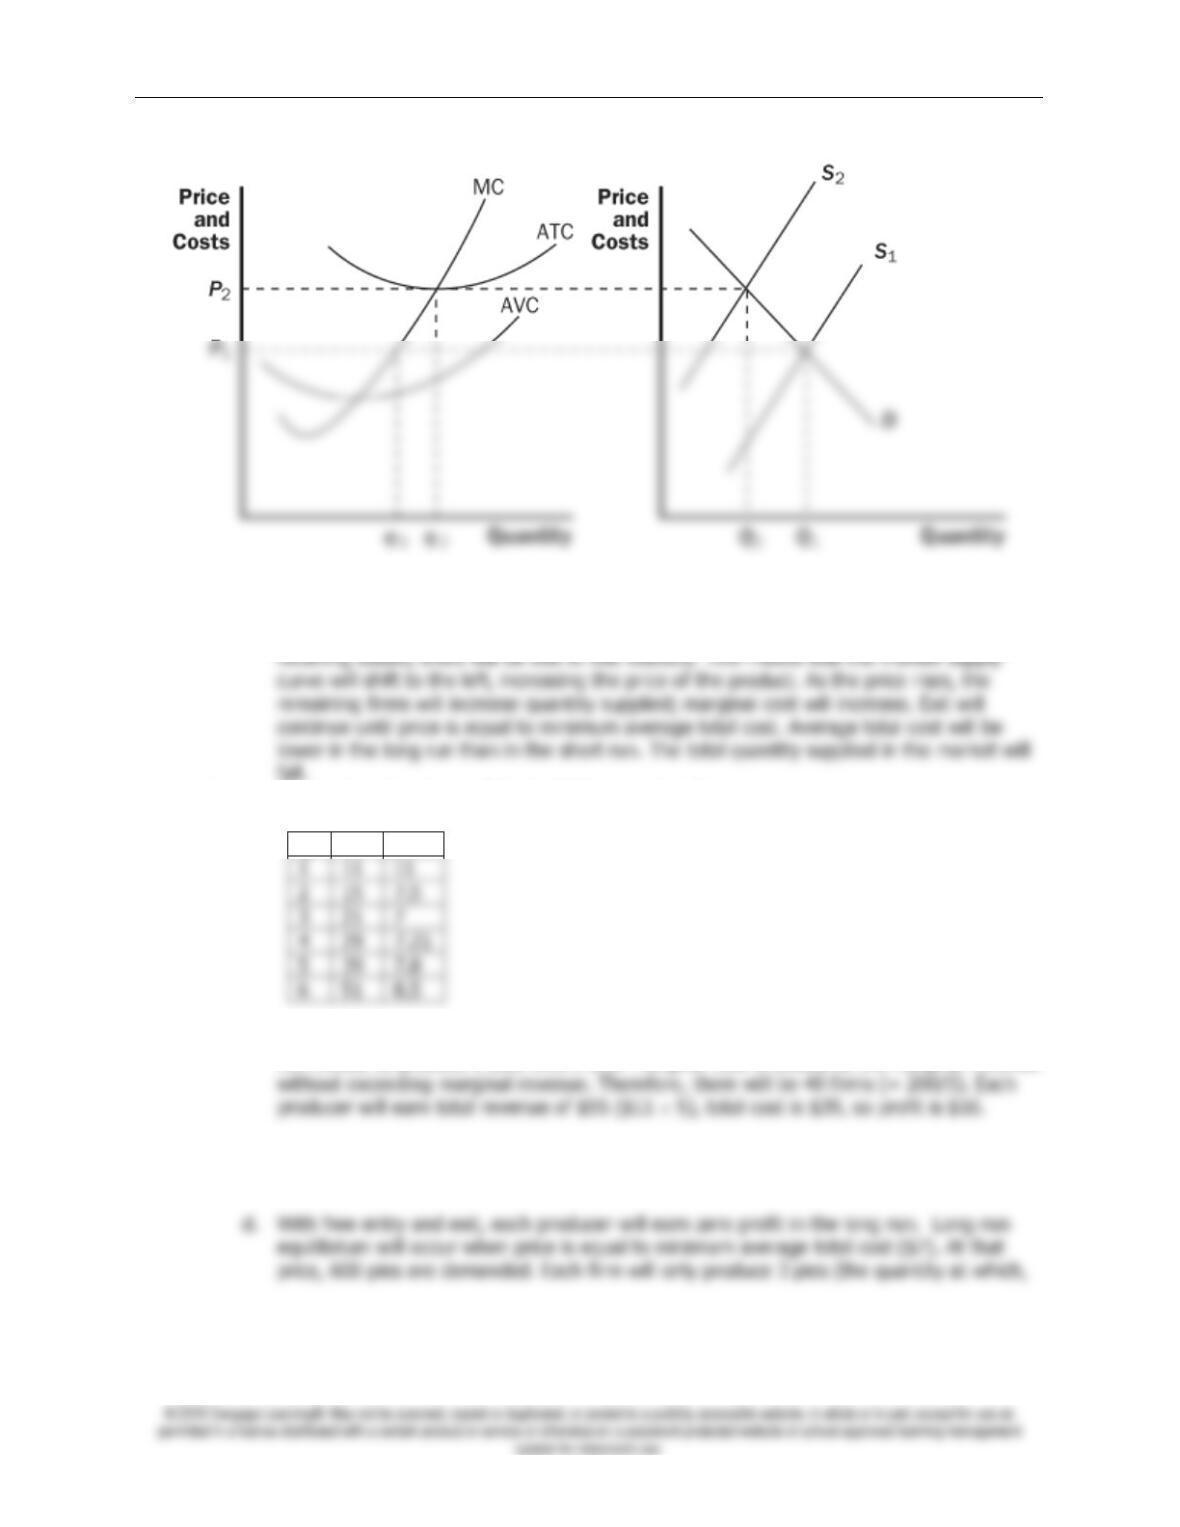
8. a. If firms are currently incurring losses, price must be less than average total cost.
Chapter 14/Firms in Competitive Markets ❖ 241
Figure 6
c. Figure 6 also shows how the market will adjust in the long run. Because firms are
fall.
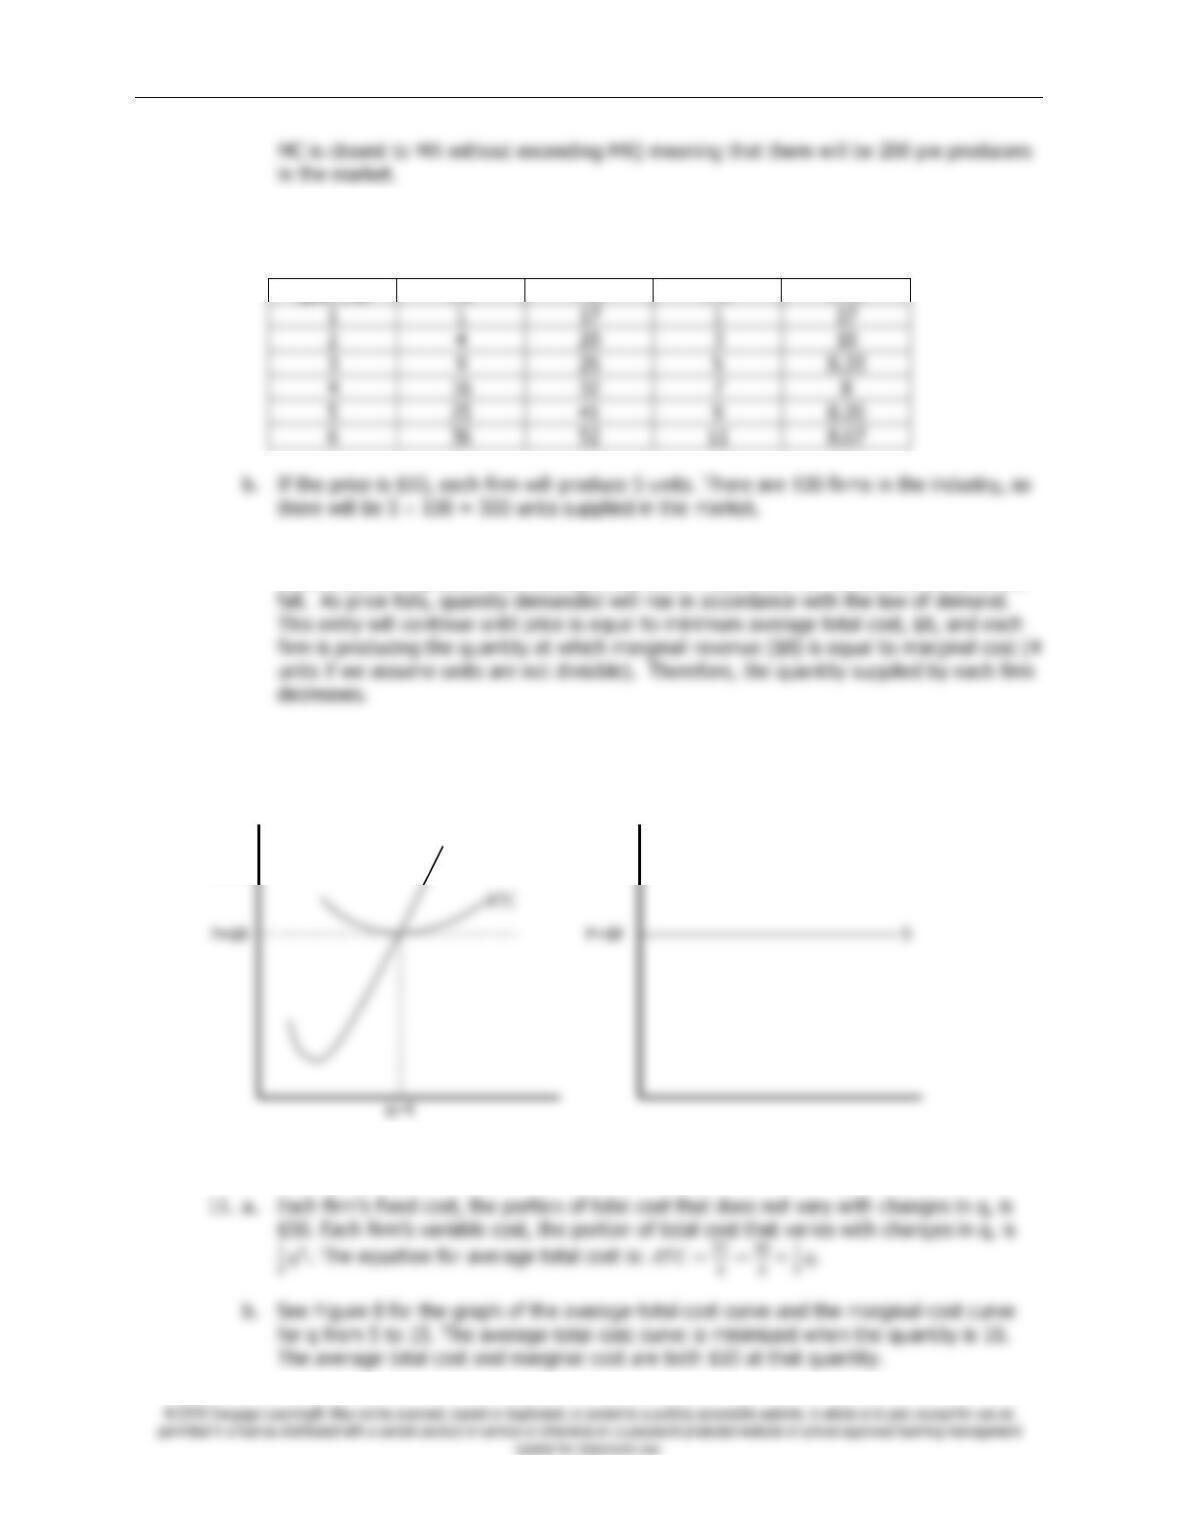
9. a. The table below shows
TC
and
ATC
for a typical firm:
Q
TC
ATC
b. At a price of $11, quantity demanded is 200. With marginal revenue of $11, each firm
will choose to produce 5 pies where their marginal cost is closest to the marginal revenue
c. The market is not in long-run equilibrium because firms are earning positive economic
profit. Firms will want to enter the market.
242 ❖ Chapter 14/Firms in Competitive Markets
10. a. The firms’ variable cost (
VC
), total cost (
TC
), marginal cost (
MC
), and average total cost
(
ATC
) are shown in the table below:
Quantity
VC
TC
MC
ATC
c. At a price of $10 and a quantity supplied of 5, each firm is earning a positive profit
because price is greater than average total cost. Thus, entry will occur and the price will
d. Figure 7 shows the long-run market supply curve, which will be horizontal at minimum
average total cost, $8. Each firm produces 4 units.
Figure 7
Market
Firm
Price
and
Costs
MC
Chapter 14/Firms in Competitive Markets ❖ 243
Figure 8
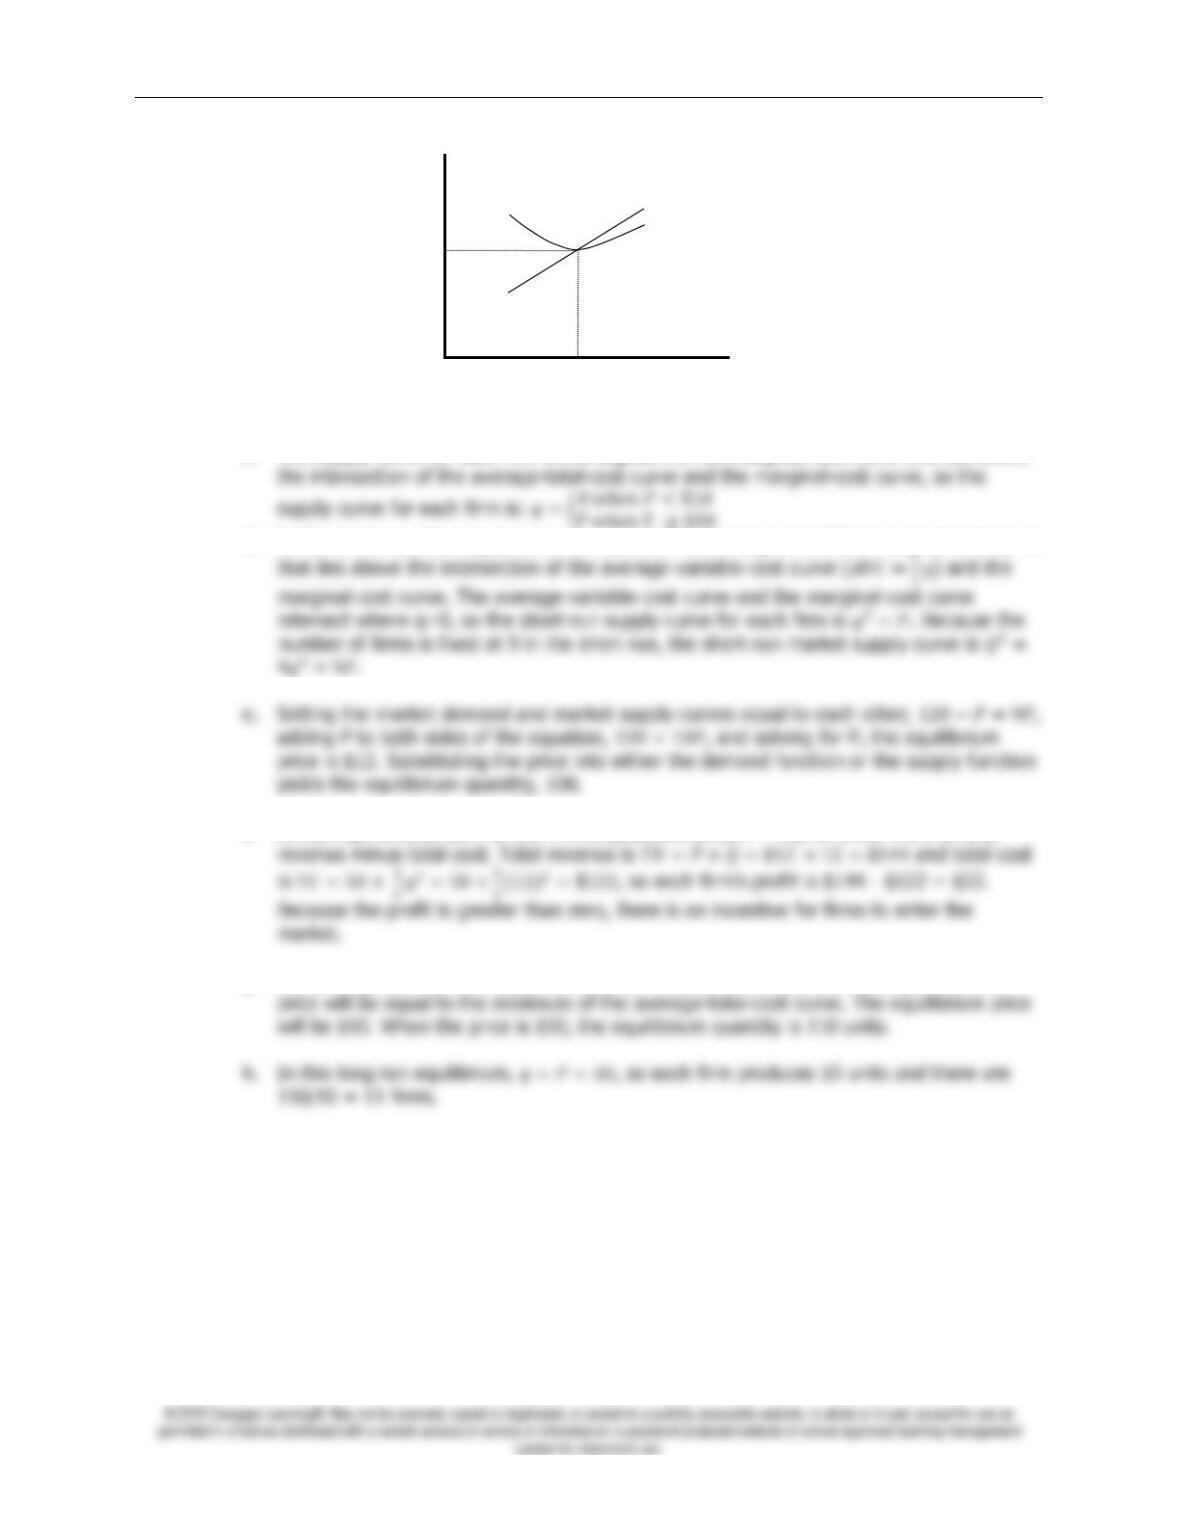
c. The supply curve for each firm is the segment of the marginal-cost curve that lies above
d. In the short run, the supply curve for each firm is the segment of the marginal-cost curve
f. In this equilibrium, each of the 9 firms produces (108/9 = 12) 12 units. Profit is total
g. In the long run with free entry and exit, all firms will earn zero economic profit so the
5
10
15
Quantity
Price
$10
MC
ATC