CHAPTER 14 | Money, Banks, and the Federal Reserve System 339
If velocity is constant, then the growth rate of velocity is zero. This allows us to rewrite the equation as:
Inflation rate = Growth in the money supply – Growth rate of real output.
This equation leads to the following predictions:
1. If the money supply grows at a faster rate than real GDP, there will be inflation.
C. How Accurate Are Estimates of Inflation Based on the Quantity Theory?
If velocity is not constant, then there may not be a tight link between increases in the money supply and
D. High Rates of Inflation
Hyperinflation is caused by central banks increasing the money supply at a rate far in excess of the
Extra Solved Problem 14.5
Growth in the Money Supply and the Inflation Rate
Suppose that during a particular year, the money supply grows at a rate of 20 percent, velocity grows at a
rate of 5 percent, and real GDP grows at a rate of 1 percent. Calculate the resulting inflation rate.
Solving the Problem
Step 1: Review the chapter material.
This problem is about the link between increases in the money supply and the inflation rate,
340 CHAPTER 14 | Money, Banks, and the Federal Reserve System
Extra Economics in Your Life:
If We Never Used Cash, How Much Money Could Banks Create?
Question: Suppose you live in a society where people never withdraw cash from their banks. In this
case, how much money could the banking system create? What might limit deposit creation in this case?
Answer: If there were never any withdrawals of cash, the banking system could potentially have
Extra AN INSIDE LOOK News Article to Use in Class
CHAPTER 14 | Money, Banks, and the Federal Reserve System 341
Solutions to End-of-Chapter Exercises
14.1
What Is Money, and Why Do We Need It?
1.1 The problem is called a double coincidence of wants, where each person to a trade must want
what the other person has.
Problems and Applications
1.5 In French Polynesia in the 1880s, the food the French singer received as payment served as a
medium of exchange, but the food did not serve well as a store of value, a unit of account, or a
standard of deferred payment.
1.8 a. A medium of exchange refers to anything that is generally accepted in exchange for goods
and services.
342 CHAPTER 14 | Money, Banks, and the Federal Reserve System
1.9 Legally requiring all firms to accept paper currency in exchange for whatever they are selling
would help people who do not use credit cards or debit cards, and it would help people who want
1.10 Germans continued using the deutsche mark, along with using the euro, because they knew other
14.2
How Is Money Measured in the United States Today?
Learning Objective: Discuss the definitions of the money supply used in the United States
today.
Review Questions
2.1 M1 equals currency outside of the banking system, the value of checking account deposits, and
2.2 The Federal Reserve uses two definitions of the money supply because it believes that the M1
definition is closest to money as a medium of exchange, while M2 includes some assets that first
2.3 Wealth equals the value of assets minus the value of liabilities, or debts; income equals earnings
Problems and Applications
2.4 a., b., and d. are counted in M1. c. is counted in M2, but not M1. e. is not counted in either M1 or
M2 because credit cards are not part of the money supply.
2.5 You should disagree. The wealth of the United States consists of the buildings, lands, and other
CHAPTER 14 | Money, Banks, and the Federal Reserve System 343
2.7 Checking account deposits and currency are both included in M1. Therefore, there is no effect.
2.8 Funds in money market mutual funds are included in M2 but not in M1. Therefore, this
2.9 a. The U.S. dollar is formally accepted as a medium of exchange in a number of other countries
2.10 a. Chinese businesses and consumers might prefer to carry out transactions with currency, not
checks or credit cards which involve banks and leave records that the government may be
able to inspect.
b. The Chinese government might be reluctant to print currency in high denominations because
it would make it easier to use currency for even more transactions. Individuals and businesses
might find it easier to avoid paying taxes if they use currency rather than checks or credit
cards when buying and selling goods and services, which would reduce the government’s tax
revenue.
2.11 When using bitcoins to buy and sell goods and services, no permanent record of the transactions
exists. People in developing countries may be more prone to use bitcoins for transactions than
2.12 The monetary value of 1.4 billion pennies is $14 million. If all the pennies were worth five cents
14.3
How Do Banks Create Money?
Learning Objective: Explain how banks create money.
Review Questions
3.1 The largest asset of a typical bank is loans, and the largest liability is deposits.
3.2
344 CHAPTER 14 | Money, Banks, and the Federal Reserve System
3.3 To say that banks “create money” means that banks create checking account deposits, which are
part of M1, when they make loans from their excess reserves.
Problems and Applications
3.5 Many farms and other small businesses borrow relatively small amounts of money compared to
the amounts large corporations often borrow. Local bankers have an understanding of the
3.6 “Commercial lending” refers to loans banks make to businesses. Loans are “funded” by deposits
in the sense that banks can make new loans when they gain reserves, and bank deposits contribute
to bank reserves.
3.7 Using your savings to make loans rather than keeping the funds in bank accounts that earn very
low rates of interest involves more default risk, less liquidity, and requires more information and
3.8 Charging higher interest rates on subprime loans than on other loans can be justified by the higher
risk of default on subprime loans. A bank could take advantage of a subprime borrower who
3.9 With a required reserve ratio of 10 percent, Wells Fargo would have to hold $10,000 of reserves
3.10 a. Excess reserves = $10,000 – ($70,000 × 0.10) = $3,000.
b. The maximum amount by which this single bank can expand its loans is the amount of its
excess reserves, or $3,000.
CHAPTER 14 | Money, Banks, and the Federal Reserve System 345
3.11 You should disagree because the balance in a checking account represents something the bank
3.12 a. T-accounts show only the changes in a balance sheet that result from relevant transactions,
Bank of America
Assets
Liabilities
b. The problem tells you to assume that Bank of America has no excess reserves and that the
required reserve ratio is 20 percent. This requirement means that if the bank’s checking
account deposits go up by $2,000, the bank must keep $400 as reserves and can loan out the
Bank of America
Assets
Liabilities
Reserves +$2,000
Deposits +$2,000
Loans +$1,600
Deposits +$1,600
c. The T-accounts below show the effect of the borrower having spent the $1,600 he received as
a loan from Bank of America. The person who received the $1,600 check deposits it in her
Assets
Liabilities
Deposits +$2,000
Assets
Liabilities
346 CHAPTER 14 | Money, Banks, and the Federal Reserve System
d. The formula for the simple deposit multiplier is:
14.4
The Federal Reserve System
Learning Objective: Compare the three policy tools the Federal Reserve uses to
manage the money supply.
Review Questions
4.2 The three policy tools are open market operations, discount policy, and reserve requirements,
with open market operations being the most important.
4.3 When the Federal Reserve buys Treasury securities from the public, the sellers of the securities
4.4 The “shadow banking system” is a term that refers to investment banks, money market mutual
funds, hedge funds, and other nonbank financial firms. These firms raise funds from individual
Problems and Applications
4.5 Federalism in the United States refers to the relationship between the federal government and state
governments. Many Members of Congress wanted the central bank to be located in their own
CHAPTER 14 | Money, Banks, and the Federal Reserve System 347
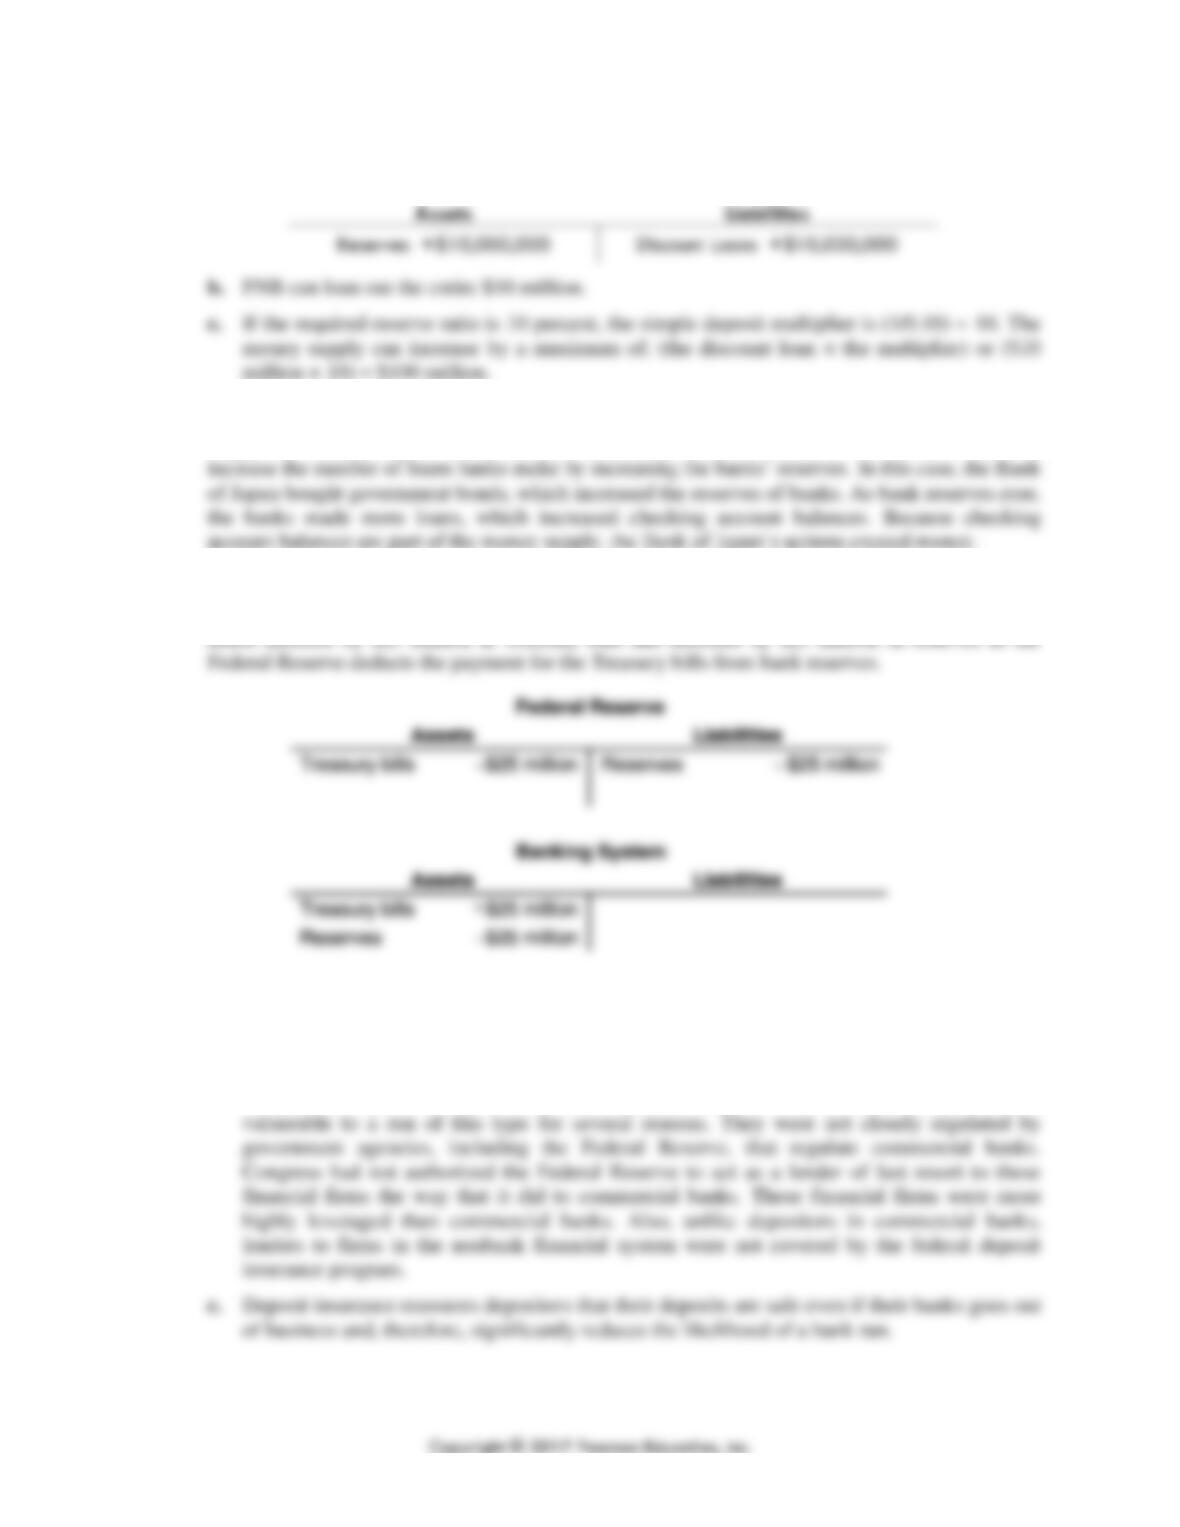
4.6 a.
First National Bank
4.7 A government can create money by printing currency, but banks create the majority of the money
supply by making loans, which increases checking account balances. The central bank can
4.8 In the T-account for the Federal Reserve, assets decrease by $25 million in Treasury bills and
liabilities decrease by $25 million in bank reserves. In the T-account for the banking system,
4.9 a. By the “nonbank financial system,” Geithner was referring to investment banks, money market
mutual funds, hedge funds, and other firms that are part of the “shadow banking system.”
b. A “classic type of bank run” is a situation in which many depositors simultaneously decide to
withdraw money from a commercial bank. Institutions in the nonbank financial system were
348 CHAPTER 14 | Money, Banks, and the Federal Reserve System
4.10 Money market mutual funds are not protected by deposit insurance, as commercial banks’
deposits are through the Federal Deposit Insurance Corporation (FDIC). Customers of a bank
4.11 The People’s Bank of China decreased the required reserve ratio, which decreased the amount of
14.5
The Quantity Theory of Money
Learning Objective: Explain the quantity theory of money and use it to explain how
high rates of inflation occur.
Review Questions
5.1 The quantity theory of money starts from the quantity equation:
M × V = P × Y,
5.2 The quantity theory of money is better able to explain the inflation rate in the long run because in
the short run there can be significant fluctuations in the value of velocity.
5.3 Hyperinflation refers to very high rates of inflation—in excess of 50 percent per month. The rapid
growth of the money supply that leads to a hyperinflation typically results from large budget
Problems and Applications
5.4 The inflation rate = Growth rate of the money supply + Growth rate of velocity – Growth rate of
real output. So, if velocity is constant, the inflation rate would be: 6% + 0% – 3% = 3%. If
velocity grows at 1 percent, then the inflation rate would be: 6% + 1% – 3% = 4%.
CHAPTER 14 | Money, Banks, and the Federal Reserve System 349
5.6 The quantity equation indicates that the growth rate in a nation’s money supply plus the growth
rate of velocity will equal the inflation rate plus the growth rate of real GDP. Because we are
given values only for the average annual growth rate of the money supply and for the average
inflation rate, we can’t determine whether the values are consistent with the quantity equation. To
5.7 a. Price deflation occurs when the price level declines from one year to the next.
b. As the quantity theory of money suggests, if velocity does not change, then increases in the
5.8 The large quantity of Confederate dollars would have generated high inflation, which would have
decreased the value of the Confederate currency. With the war drawing to an end, Southerners
5.9 a. The government of Venezuela had to sell bonds to finance its budget deficit. Investors may
have been reluctant to buy these bonds because they feared that the government would
default on the bonds. So the government must have sold the bonds to the central bank, which
as explained in the chapter, would result in an increase in the money supply.
350 CHAPTER 14 | Money, Banks, and the Federal Reserve System
5.10 Hyperinflation reduced the purchasing power of money. Individuals and firms that borrowed during
Real-Time Data Exercises
D14.1 For the week ending September 28, 2015, the M1 Money Stock equaled $3,054.6 billion, the
D14.2 For the week ending September 28, 2015, the M2 Money Stock equaled $12,176.5 billion, Total
Savings Deposits at all Depository Institutions equaled $8,069.6 billion, Retail Money Funds
equaled $621.5 billion, and Small Time Deposits equaled $430.8 billion. (All figures are
seasonally adjusted.)
a. M2 equals M1 plus savings account deposits, small-denomination time deposits, balances in
money market deposit accounts in banks, and noninstitutional money market fund shares. As
stated in part (b) below, Retail Money Funds equal money market deposit accounts in banks
D14.3 The M1 Money Stock for August 2015 equaled $3,069.3 billion, for August 2010 equaled
$1,743.7 billion, and for August 2005 equaled $1,374.7 billion. The M2 Money Stock for August
2015 equaled $12,110.5 billion, for August 2010 equaled $8,628.2 billion, and for August 2005
equaled $6,531.9 billion.
a. M1 as a proportion of M2 equaled ($3,069.3 billion/$12,110.5 billion) = 0.253, or 25.3
D14.4 For the second quarter of 2015, Nominal Gross Domestic Product equaled $17,913.7 billion, the
Velocity of the M1 Money Stock equaled 5.980, and the Velocity of the M2 Money Stock
CHAPTER 14 | Money, Banks, and the Federal Reserve System 351
a. Using the equation of exchange, M1 equals nominal GDP divided by the velocity of M1,
which for the second quarter of 2015 equals ($17,913.7 billion/5.980) = $2,995.6 billion, and
D14.5 For the second quarter of 2015, Real Gross Domestic Product equaled $16,333.6 billion, the GDP
Price Deflator equaled 109.674, and the M2 Money Stock equaled $11,931.7 billion. For the
second quarter of 2005, Real Gross Domestic Product equaled $14,172.7 billion, the GDP Price
Deflator equaled 91.543, and the M2 Money Stock equaled $6,445.1 billion.
a. The average annual rate of change for real GDP over this 10-year period equals {[($16,333.6
billion/$14,172.7 billion)1/10] – 1} × 100 = 1.43%. Similarly, the average annual rate of
change for M2 equals {[($11,931.7 billion/$6,445.1 billion)1/10] – 1} × 100 = 6.35%.
D14.6 For the second quarter of 2015, Real Gross Domestic Product equaled $16,333.6 billion in
chained 2009 dollars and for the second quarter of 2023 Real Potential Gross Domestic Product
equals $19,922.8 billion in chained 2009 dollars.
a. The average annual rate of change for real GDP over this eight-year period, assuming that
real GDP equals potential GDP at the end of the eight-year period equals {[($19,922.8
billion/$16,333.6 billion)1/8] – 1} × 100 = 2.51%.