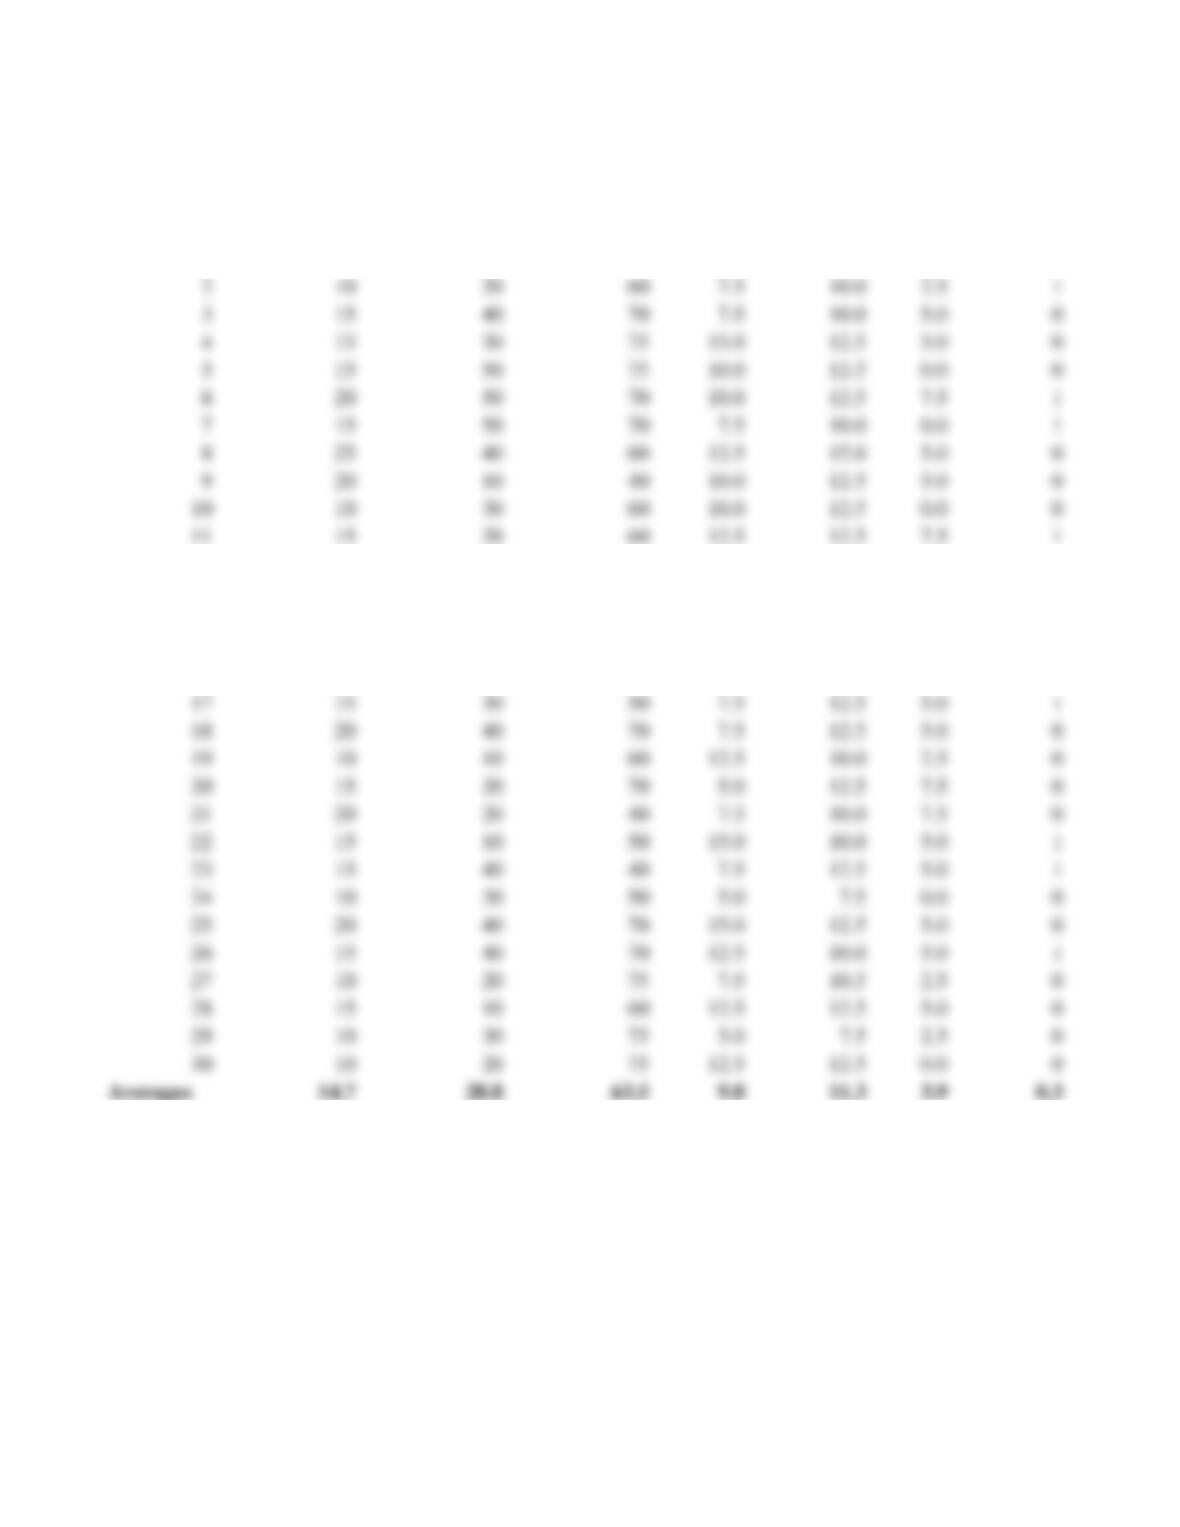
TABLE 13.5 Profit Margin and Market Structure Data for Columbia Drug Stores, Inc.
Store No. Profit-Margin Market Share Concentration
Capital
Intensity
Advertising
Intensity
Growth
Superstore
(S = 1 if
present)
1 15 25 75 10.0 10.0 7.5 0
12 10 30 75 12.5 10.0 2.5 0
13 15 50 75 7.5 10.0 5.0 0
14 10 20 75 7.5 12.5 2.5 0
15 10 10 50 7.5 10.0 2.5 0
16 20 30 60 15.0 12.5 2.5 0
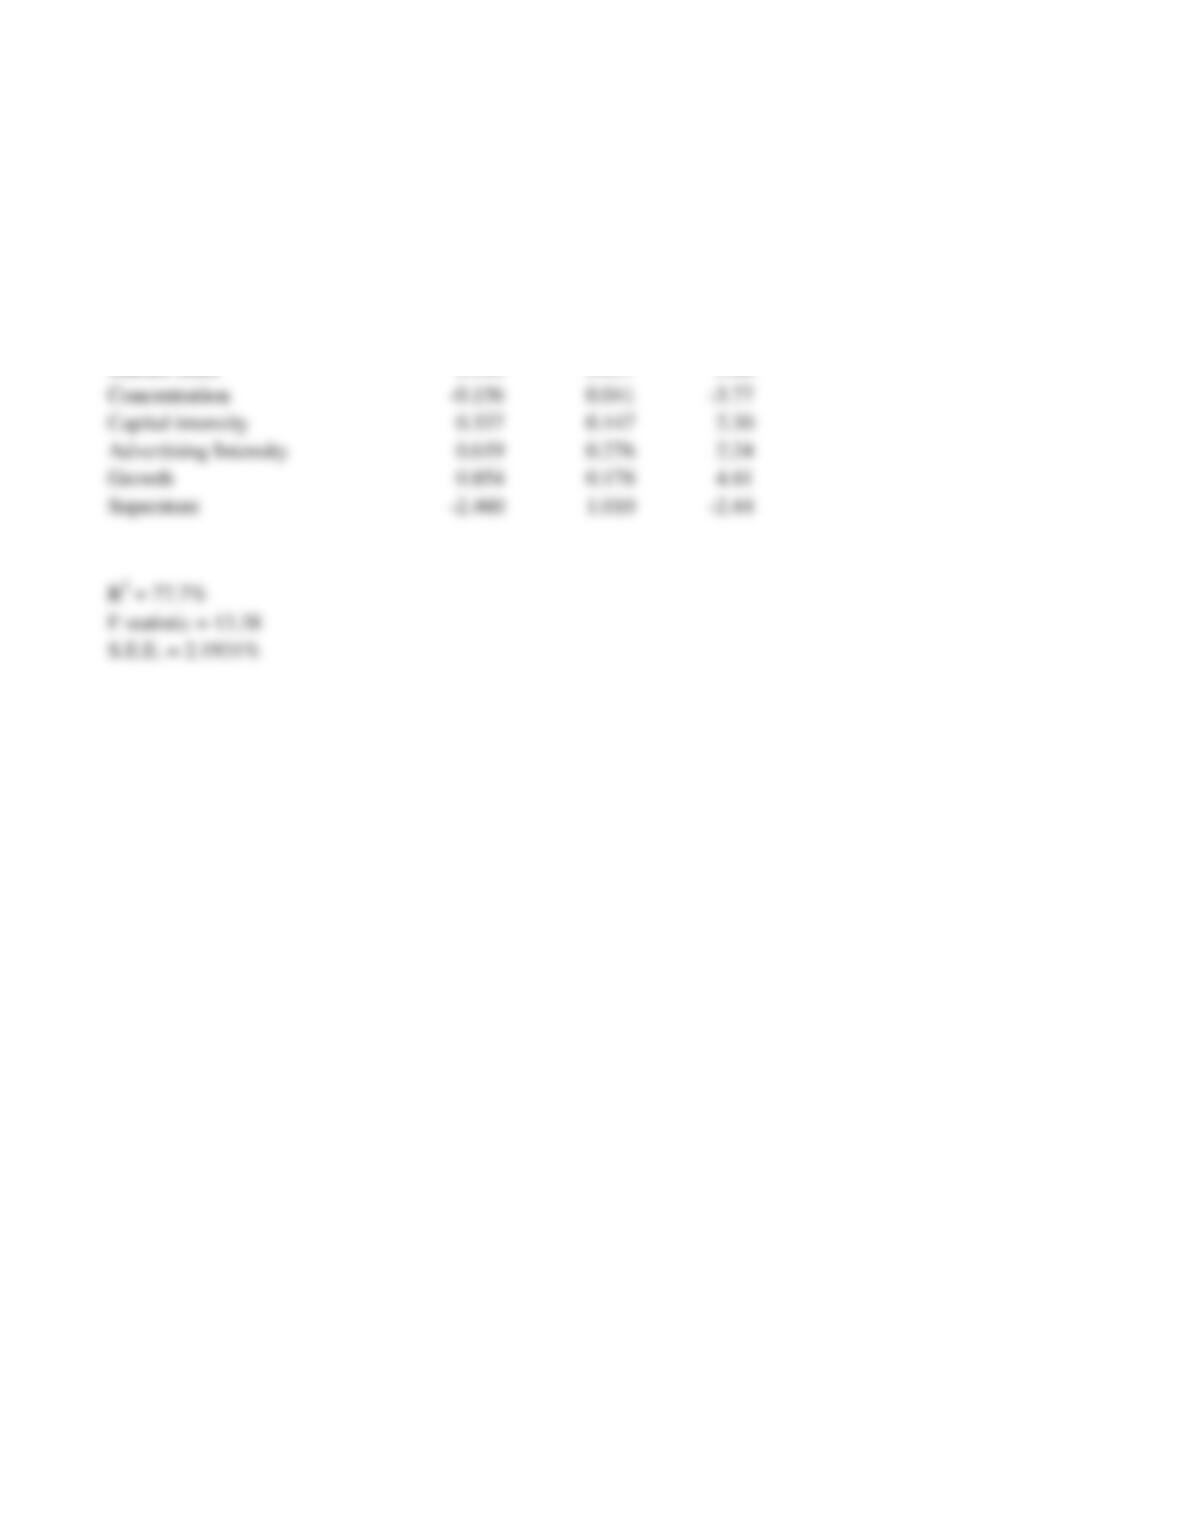
TABLE 13.6 Determinants of Profit Margins for Columbia Drug Stores, Inc.
Independent variable
Coefficient
estimate
Standard
error of
coefficient
estimate
t statistic
(1) (2) (3) (4) = (2)/(3)
Intercept 6.155 3.712 1.66
Market share 0.189 0.037 5.06
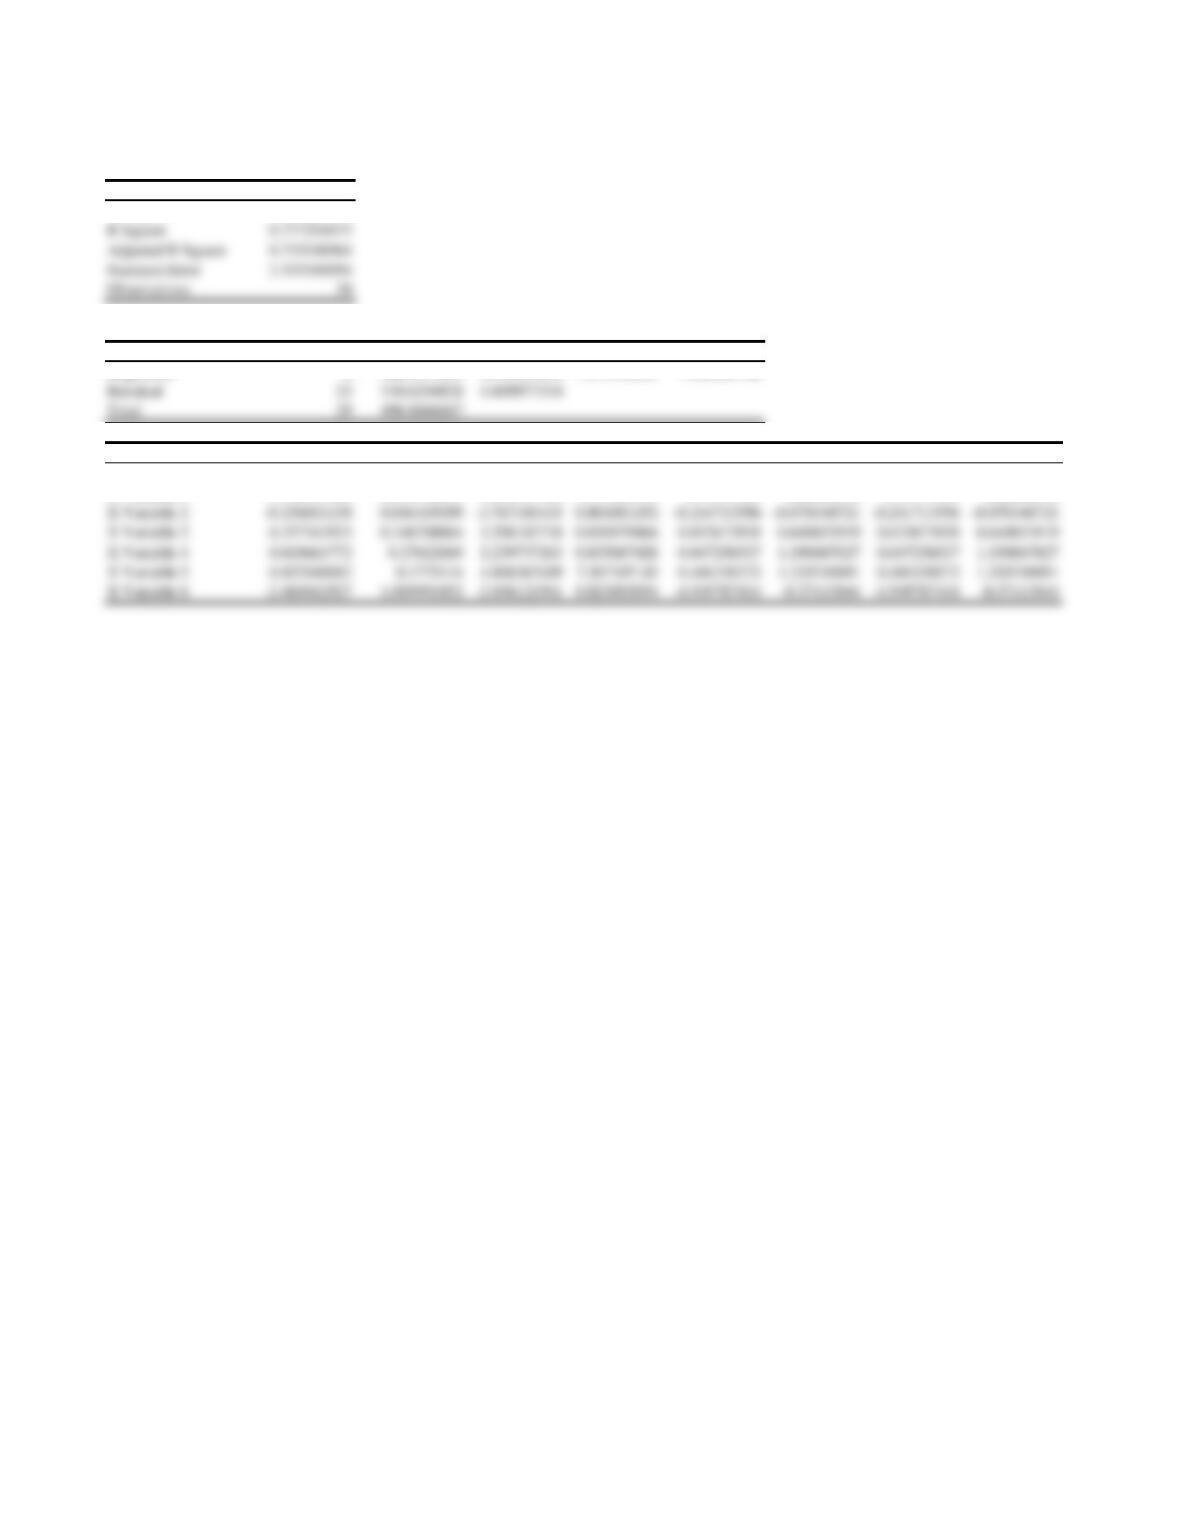
SUMMARY OUTPUT
Regression Statistics
Multiple R 0.881621276
ANOVA
df SS MS F Significance F
Regression 6 386.0371839 64.33953064 13.37626433 1.68649E-06
Coefficients Standard Error t Stat P-value Lower 95% Upper 95% Lower 95.0% Upper 95.0%
Intercept 6.154857556 3.711901346 1.65814147 0.110866845 -1.523784959 13.83350007 -1.523784959 13.83350007
X Variable 1 0.188919465 0.037302335 5.064547925 3.97508E-05 0.11175381 0.26608512 0.11175381 0.26608512