
S-177
interactive activity
Chapter 13
Fiscal Policy
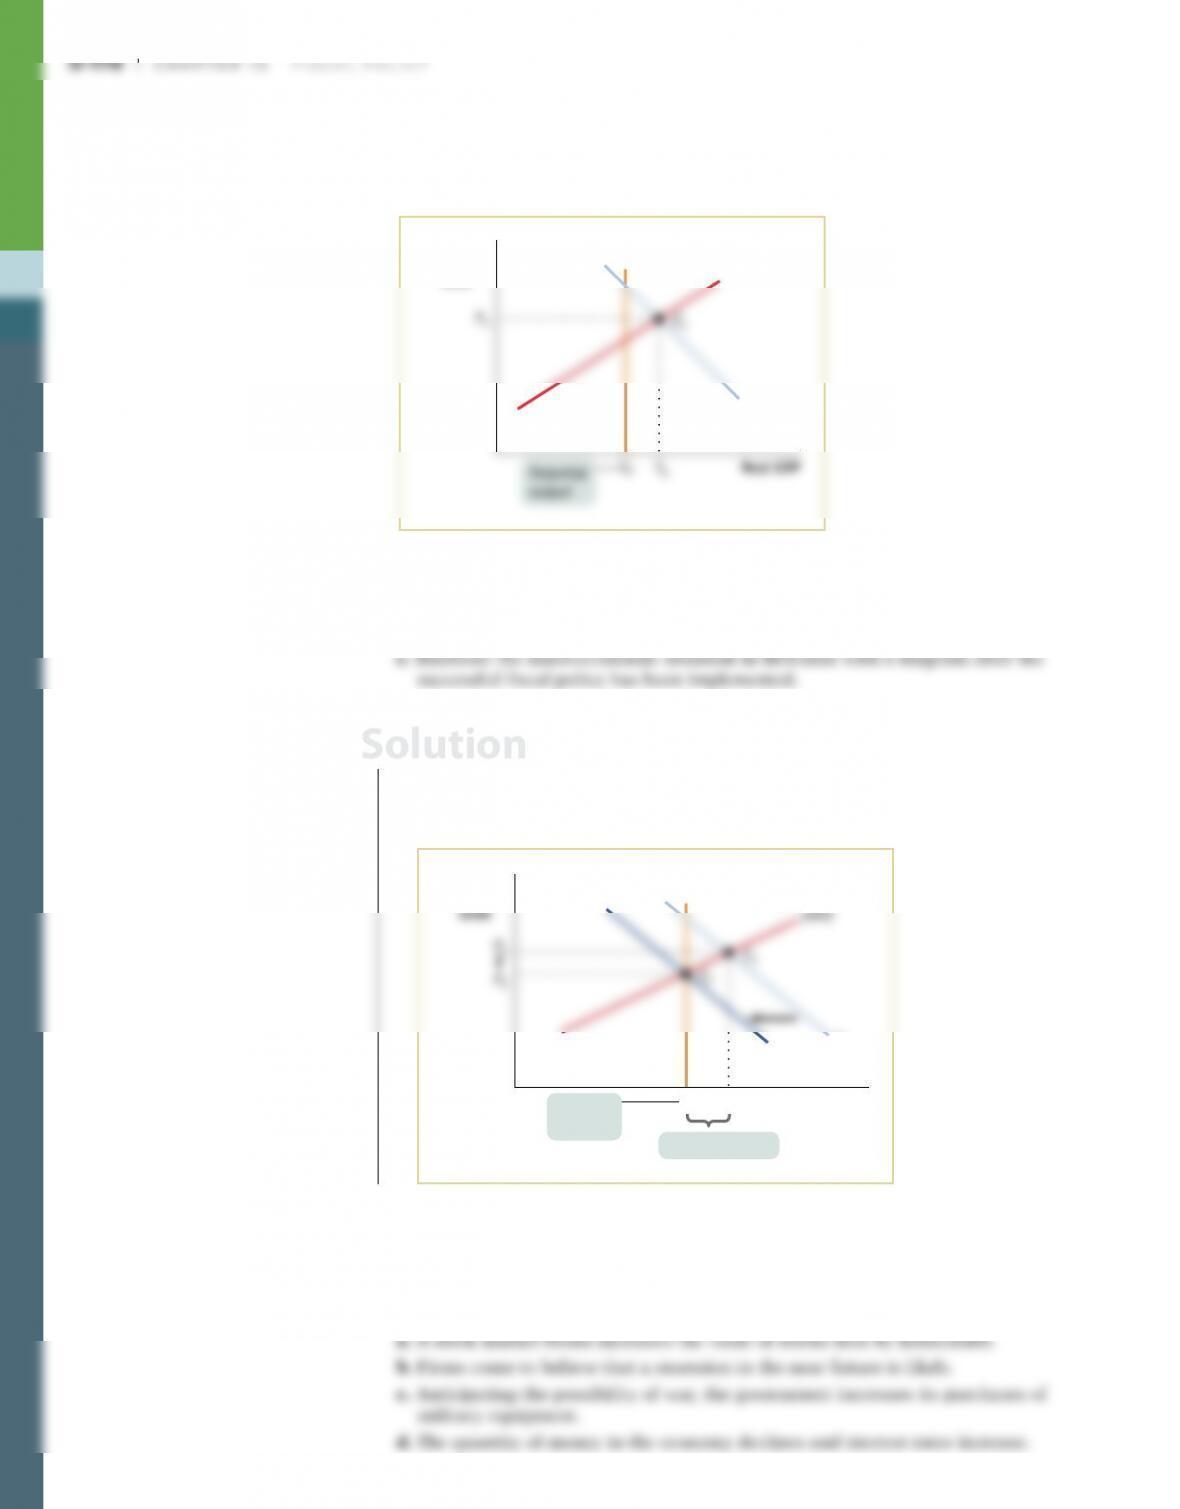
1. The accompanying diagram shows the current macroeconomic situation for the
economy of Albernia. You have been hired as an economic consultant to help the
economy move to potential output, YP.
AD1
SRAS
Real GDP
Y1YP
Aggregate
price
level
LRAS
Potential
output
a. Is Albernia facing a recessionary or inflationary gap?
b. Which type of fiscal policy—expansionary or contractionary—would move the
economy of Albernia to potential output, YP? What are some examples of such
policies?
1. a. Albernia is facing a recessionary gap; Y1 is less than YP.
b. Albernia could use expansionary fiscal policies to move the economy to poten-
tial output. Such policies include increasing government purchases of goods
and services, increasing government transfers, and reducing taxes.
c.
AD1
SRAS
P1
Real GDP
Y1YP
Aggregate
price
E1
LRAS
Potential
output
Recessionary gap
Solution
2. The accompanying diagram shows the current macroeconomic situation for
the economy of Brittania; real GDP is Y1, and the aggregate price level is P1.
You have been hired as an economic consultant to help the economy move to
potential output, YP.
SRAS
Aggregate
price
level
LRAS
a. Is Brittania facing a recessionary or inflationary gap?
b. Which type of fiscal policy—expansionary or contractionary—would move the
economy of Brittania to potential output, YP? What are some examples of such
policies?
2. a. Brittania is facing an inflationary gap; Y1 is greater than YP.
b. Brittania could use contractionary fiscal policies to move the economy to
potential output. Such policies include reducing government purchases of
goods and services, lowering government transfers, and raising taxes.
c.
AD1
Real GDP
Y1
YP
AD2
Aggregate
price
LRAS
Potential
output
Inflationary gap
3. An economy is in long–run macroeconomic equilibrium when each of the fol-
lowing aggregate demand shocks occurs. What kind of gap—inflationary or
recessionary—will the economy face after the shock, and what type of fiscal
policies would help move the economy back to potential output? How would your
recommended fiscal policy shift the aggregate demand curve?
Solution
3. a. As the stock market booms and the value of stocks held by households
increases, there will be an increase in consumer spending; this will shift the
b. If firms become concerned about a recession in the near future, they will
decrease investment spending and aggregate demand will shift to the left. The
c. If the government increases its purchases of military equipment, the aggre–
gate demand curve will shift to the right. The economy will face an inflation-
ary gap. Policy makers could use contractionary fiscal policies to move the
d. As interest rates rise, investment spending will decrease and the aggregate
demand curve will shift to the left. The economy will face a recessionary gap.
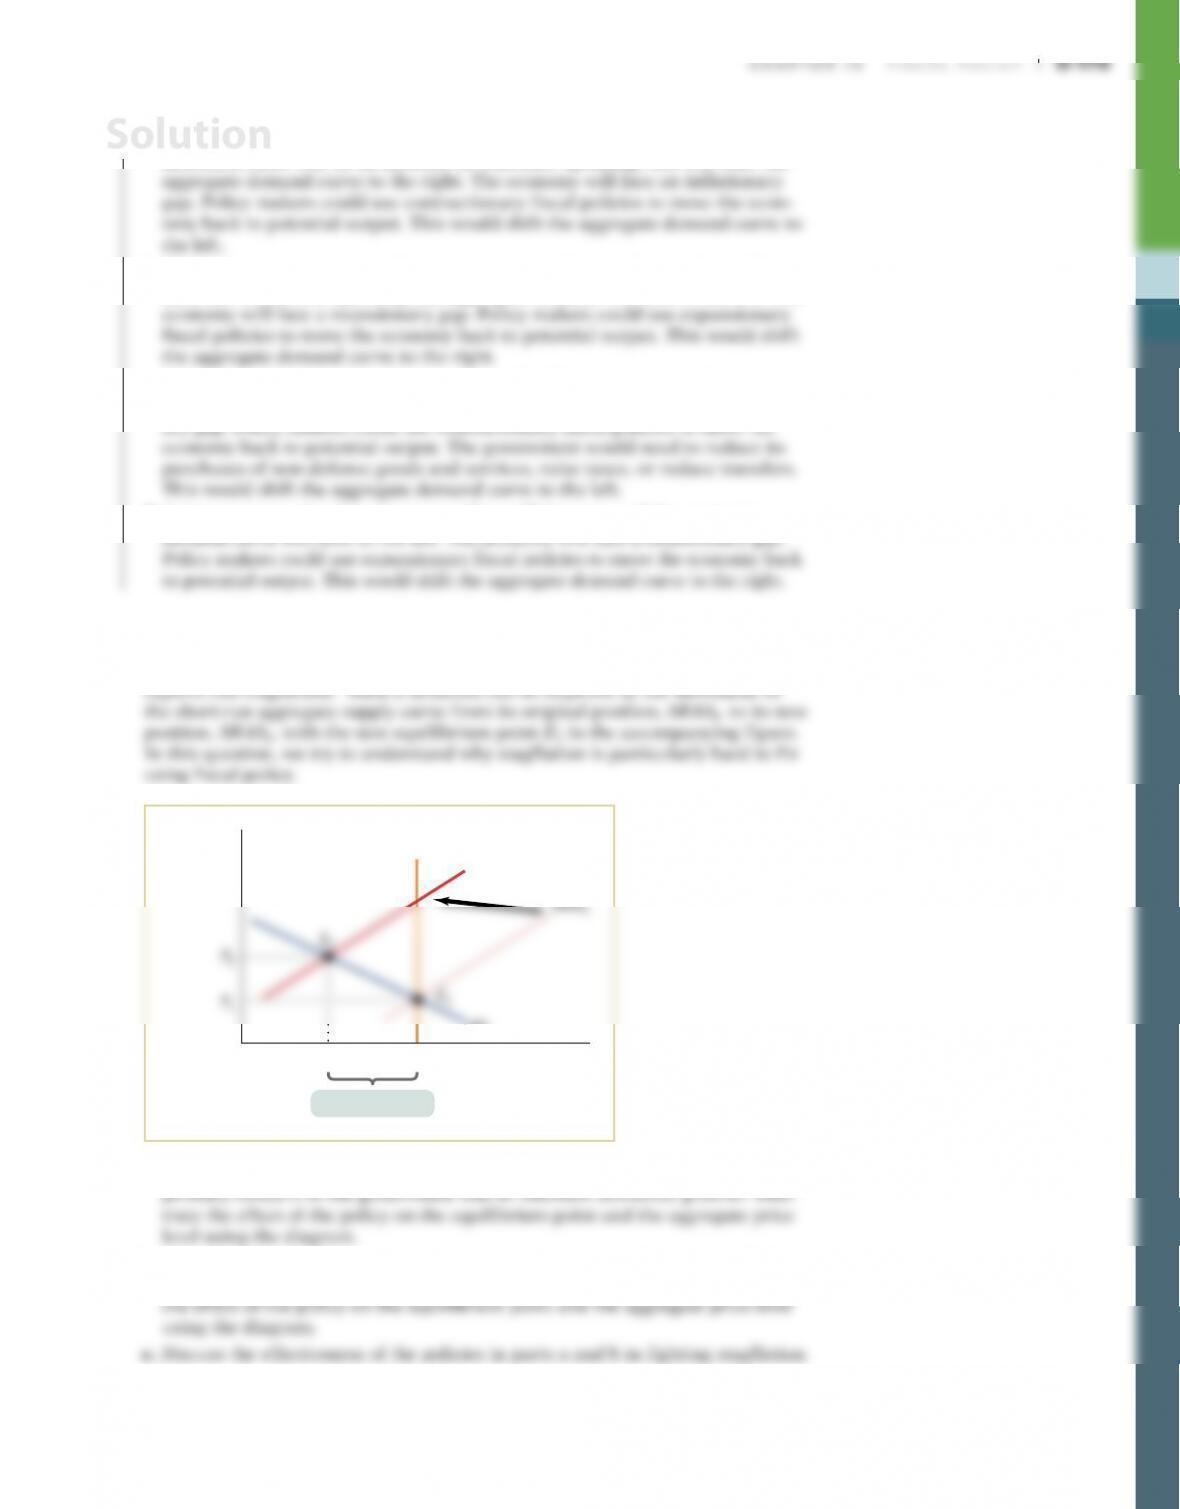
4. During a 2008 interview, then German Finance Minister Peer Steinbrueck said,
“We have to watch out that in Europe and beyond, nothing like a combination of
downward economic [growth] and high inflation rates emerges—something that
experts call stagflation.” Such a situation can be depicted by the movement of
AD1
SRAS2
Real GDPY2YP
Aggregate
price
level
LRAS
Recessionary gap
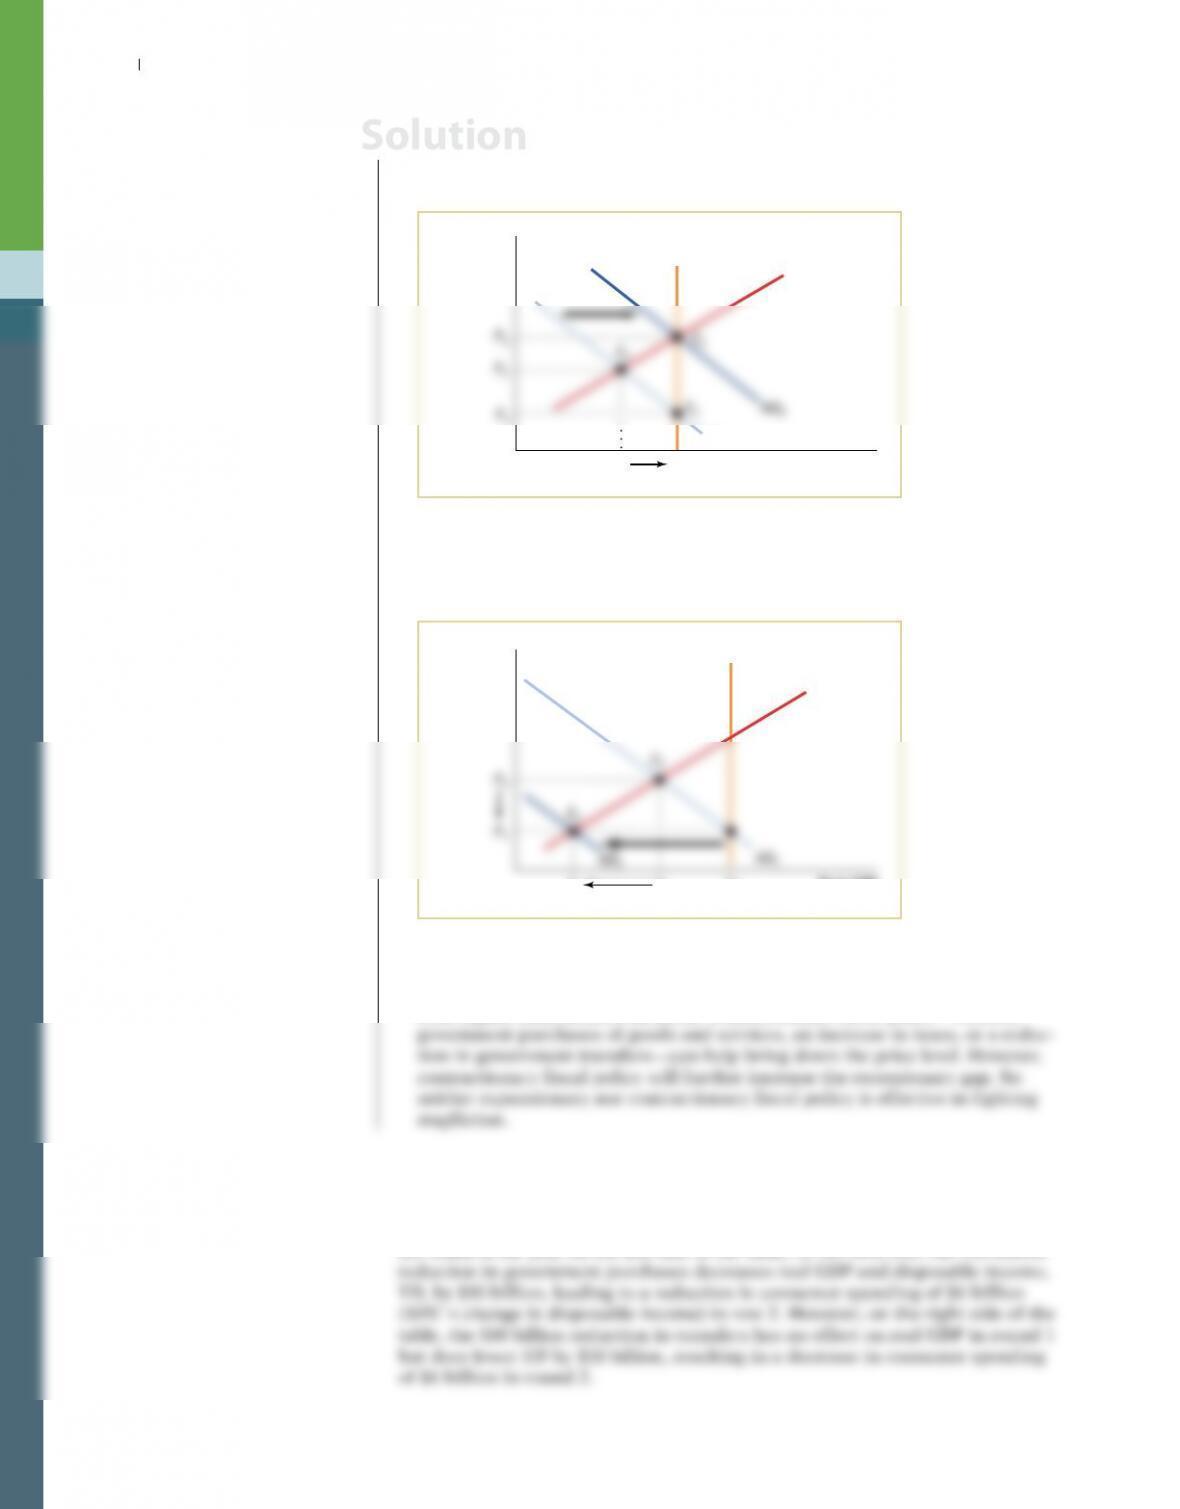
a. What would be the appropriate fiscal policy response to this situation if the
b. What would be the appropriate fiscal policy response to this situation if the
primary concern of the government was to maintain price stability? Illustrate
Solution
S-180 Chapter 13 Fiscal Policy
4. a. The government should adopt expansionary fiscal policy, such as lowering taxes
or increasing spending. This would shift the aggregate demand curve to the
right, moving the equilibrium output back to YP but increasing the price to P3.
AD1
SRAS2
P1
P3
Real GDPY2YP
Aggregate
price
level
E3
LRAS
b. The government should adopt contractionary fiscal policy such as raising
taxes or lowering government spending, causing the aggregate demand curve
to shift to the left. The price level will decrease back to P1, but the recession-
ary gap will increase.
SRAS2
LRAS
P1
Real GDPY3Y2YP
Aggregate
price
level
c. Although expansionary fiscal policy can help bring aggregate output back to
potential output, it also raises the aggregate price level. This makes the prob–
lem of inflation worse in a situation where low economic growth is coupled
with higher-than–desired inflation. Contractionary fiscal policy—reduced
5. Show why a $10 billion reduction in government purchases of goods and services
will have a larger effect on real GDP than a $10 billion reduction in government
transfers by completing the accompanying table for an economy with a mar-
ginal propensity to consume (MPC) of 0.6. The first and second rows of the table
are filled in for you: on the left side of the table, in the first row, the $10 billion
Solution

Chapter 13 Fiscal Policy S-181
Rounds
Decrease in G = –$10 billion
(billions of dollars)
Decrease in TR = –$10 billion
(billions of dollars)
Change in
G or C
Change in
real GDP
Change in
YD
Change in TR
or C
Change in
real GDP
Change in
YD
1DG = −$10.00 −$10.00 −$10.00 DTR = −$10.00 $0.00 −$10.00
2DC = −6.00 −6.00 −6.00 DC = −6.00 −6.00 −6.00
3DC = ?? ? DC = ???
4DC = ?? ? DC = ???
a. When government purchases decrease by $10 billion, what is the sum of the
changes in real GDP after the 10 rounds?
b. When the government reduces transfers by $10 billion, what is the sum of the
changes in real GDP after the 10 rounds?
c. Using the formula for the multiplier for changes in government purchases
and for changes in transfers, calculate the total change in real GDP due to the
$10 billion decrease in government purchases and the $10 billion reduction in
transfers. What explains the difference? [Hint: The multiplier for government
5. Here is the completed table:
Rounds
Decrease in G = –$10 billion
(billions of dollars)
Decrease in TR = –$10 billion
(billions of dollars)
Change in
G or C
Change in
real GDP
Change in
YD
Change in TR
or C
Change in
real GDP
Change in
YD
1DG = −$10.00 −$10.00 −$10.00 DTR = −$10.00 $0.00 −$10.00
2DC = −6.00 −6.00 −6.00 DC = −6.00 −6.00 −6.00
3DC = −3.60 −3.60 −3.60 DC = −3.60 −3.60 −3.60
7DC = −0.47 −0.47 −0.47 DC = −0.47 −0.47 −0.47
8DC = −0.28 −0.28 −0.28 DC = −0.28 −0.28 −0.28
9DC = −0.17 −0.17 −0.17 DC = −0.17 −0.17 −0.17
10 DC = −0.10 −0.10 −0.10 DC = − 0.10 −0.10 −0.10
. . .
for 10
rounds
Solution
S-182 Chapter 13 Fiscal Policy
a. When government purchases of goods and services decrease by $10 billion, the
change in real GDP is −$24.86 billion after 10 rounds.
b. When government transfers fall by $10 billion, the change in real GDP is
6. In each of the following cases, either a recessionary or inflationary gap exists.
Assume that the aggregate supply curve is horizontal, so that the change in real
GDP arising from a shift of the aggregate demand curve equals the size of the
6. a. The economy is facing a recessionary gap; real GDP is less than potential
output. Since the multiplier for a change in government purchases of goods
b. The economy is facing an inflationary gap; real GDP is higher than poten–
tial output. Since the multiplier for a change in government purchases of
goods and services is 1/(1 − 0.5) = 2, a decrease in government purchases
c. The economy is facing an inflationary gap; real GDP is higher than poten-
tial output. Since the multiplier for a change in government purchases of
goods and services is 1/(1 − 0.8) = 5, a decrease in government purchases of
$16 billion will reduce real GDP by $80 billion and close the inflationary gap.
7. Most macroeconomists believe it is a good thing that taxes act as automatic
stabilizers and lower the size of the multiplier. However, a smaller multiplier
means that the change in government purchases of goods and services, govern–
ment transfers, or taxes necessary to close an inflationary or recessionary gap is
larger. How can you explain this apparent inconsistency?
Solution
8. The government’s budget surplus in Macroland has risen consistently over the
past five years. Two government policy makers disagree as to why this has
happened. One argues that a rising budget surplus indicates a growing economy;
the other argues that it shows that the government is using contractionary fiscal
policy. Can you determine which policy maker is correct? If not, why not?
9. Figure 13-10 shows the actual budget deficit and the cyclically adjusted budget
deficit as a percentage of GDP in the United States from 1965 to 2016. Assuming
9. Since the cyclically adjusted budget balance is an estimate of what the bud-
get balance would be if real GDP were exactly equal to potential output, the
effects of the business cycle on the budget has been eliminated. And since we
have assumed that there are no changes in potential output, any change in the
cyclically adjusted budget balance represents changes in fiscal policies. When
the cyclically adjusted budget deficit falls, the government must be engaging in
contractionary fiscal policies: either government purchases and transfer pay-
ments are decreasing or the government is raising taxes. When the cyclically
10. You are an economic adviser to a candidate for national office. She asks you for
a summary of the economic consequences of a balanced–budget rule for the fed-
eral government and for your recommendation on whether she should support
such a rule. How do you respond?
Solution
10. You might respond that balanced–budget rules are usually proposed because
the government is running a budget deficit and many people think of deficits as
bad. When the government runs a budget deficit, it adds to the public debt. If
the government persists in running budget deficits, interest payments become
an increasing part of government spending and the budget deficit itself. As a
result, the debt–GDP ratio may rise. However, budget deficits themselves are not
the problem; the problem arises when budget deficits become persistent. In the
11. In 2016, the policy makers of the economy of Eastlandia projected the debt–GDP
ratio and the ratio of the budget deficit to GDP for the economy for the next
10 years under different scenarios for growth in the government’s deficit. Real
GDP is currently $1,000 billion per year and is expected to grow by 3% per year,
the public debt is $300 billion at the beginning of the year, and the deficit is
$30 billion in 2016.
Year
Real GDP
(billions of
dollars)
Debt
(billions
of dollars)
Budget deficit
(billions of
dollars)
Debt
(percent of
real GDP)
Budget deficit
(percent of
real GDP)
2016 $1,000 $300 $30 ? ?
2017 1,030 ? ? ? ?
2018 1,061 ? ? ? ?
2019 1,093 ? ? ? ?
2020 1,126 ? ? ? ?
2021 1,159 ? ? ? ?
a. Complete the accompanying table to show the debt–GDP ratio and the ratio of
b. Redo the table to show the debt–GDP ratio and the ratio of the budget deficit
c. Redo the table again to show the debt–GDP ratio and the ratio of the budget
d. What happens to the debt–GDP ratio and the ratio of the budget deficit to GDP
for the economy over time under the three different scenarios?
Solution

11. a. Here is the completed table (numbers are rounded):
Year
Real GDP
(billions of
dollars)
Debt
(billions
of dollars)
Budget deficit
(billions of
dollars)
Debt
(percent of
real GDP)
Budget deficit
(percent of
real GDP)
2016 $1,000 $300 $30 30.0% 3.0%
2017 1,030 330 30 32.0 2.9
2018 1,061 360 30 33.9 2.8
b. Here is the table redone (numbers are rounded):
Year
Real GDP
(billions of
dollars)
Debt
(billions
of dollars)
Budget deficit
(billions of
dollars)
Debt
(percent of
real GDP)
Budget deficit
(percent of
real GDP)
2016 $1,000 $300 $30 30.0% 3.0%
2017 1,030 330 31 32.0 3.0
2018 1,061 361 32 34.0 3.0
2019 1,093 393 33 35.9 3.0
c. And here is the table again (numbers are rounded):
Year
Real GDP
(billions of
dollars)
Debt
(billions
of dollars)
Budget deficit
(billions of
dollars)
Debt
(percent of
real GDP)
Budget deficit
(percent of
real GDP)
2016 $1,000 $300 $30 30.0% 3.0%
2017 1,030 330 36 32.0 3.5
2018 1,061 366 43 34.5 4.1
2019 1,093 409 52 37.4 4.7
Solution
S-186 Chapter 13 Fiscal Policy
d. When the deficit remains constant at $30 billion, the ratio of the budget deficit
to 13.8% in 10 years and the debt–GDP ratio more than doubles from 30% to
more than 80%.
12. Your study partner argues that the distinction between the government’s bud-
get deficit and debt is similar to the distinction between consumer savings and
wealth. He also argues that if you have large budget deficits, you must have a
large debt. In what ways is your study partner correct and in what ways is he
incorrect?
12. Your study partner is correct that the distinction between the government’s
budget deficit and debt is similar to the distinction between consumer savings
and wealth. Savings and deficits refer to actions that take place over time. When
the government spends more than it receives in tax revenue in a particular time
period, it is running a budget deficit. When consumers spend less than their
13. Access the Discovering Data exercise for Chapter 13 online to answer
these questions.
a. Which of these six countries—United States, France, Italy, Greece, Germany,
and United Kingdom—had the largest amount of government debt as a per-
cent of GDP as of 2015? Which had the smallest?
b. Calculate the percentage change in government debt from 2007 through 2015
for the same six countries. Which country experienced the largest percentage
increase in government debt from 2007 through 2015? Which experienced the
smallest?
14. In which of the following cases does the size of the government’s debt and the
size of the budget deficit indicate potential problems for the economy?
Solution
14. a. If the government has relatively little debt but is running a large budget deficit
as it builds a high–speed rail system, this should not indicate potential prob-
lems for the economy. Like funding a war effort, it is difficult, if not impos-
b. If the government’s debt is relatively high but the government has reduced its
budget deficit, this should not indicate potential problems for the economy.
However, the government needs to be careful that the deficits do not become
persistent.
c. Even if the government’s debt is relatively low, if it is running a budget deficit
to finance the interest payments on that debt, this portends potential problems
for the future. Without any changes, the government’s debt will grow over time
d. If the government’s debt is already relatively high and the government
increases the annual deficit to finance new infrastructure, the result will be
15. How did or would the following affect the current public debt and implicit liabil-
ities of the U.S. government?
a. In 2003, Congress passed and President Bush signed the Medicare Modern-
b. The age at which retired persons can receive full Social Security benefits is
raised to age 70 for future retirees.
c. Social Security benefits for future retirees are limited to those with low
incomes.
15. a. Because of its immediate impact on government spending, the Medicare Modern–
b. If the age at which future retirees can receive full Social Security benefits is
raised to age 70, implicit liabilities fall because government transfers will be
lower in the future. There is no effect on the current public debt.
c. If Social Security benefits for future retirees are limited to those with low
d. If annual increases in Social Security benefits are increased by the annual
e. Since hospitals have an incentive to find savings immediately, and assuming
they find some savings, public debt will fall. Since the incentives also apply in
the future, implicit liabilities will also fall.
Solution
Solution

16. Unlike households, governments are often able to sustain large debts. For
example, in 2016, the U.S. government’s total debt reached $19.5 trillion, approxi–
mately equal to 106.1% of GDP. At the time, according to the U.S. Treasury, the
average interest rate paid by the government on its debt was 1.3%. However, run–
ning budget deficits becomes hard when very large debts are outstanding.
a. Calculate the dollar cost of the annual interest on the government’s total debt
assuming the interest rate and debt figures cited above.
b. If the government operates on a balanced budget before interest payments are
taken into account, at what rate must GDP grow in order for the debt–GDP
ratio to remain unchanged?
d. At what rate would nominal GDP have to grow in order for the debt–GDP ratio
to remain unchanged when the deficit in 2017 is $600 billion?
16. a. The annual interest on the debt is 1.3% of $19.5 trillion or $253.5 billion.
b. U.S. GDP must grow at 1.3% so that the debt–GDP ratio remains unchanged.
This is because the total debt and GDP would grow at the same rate.
d. The national debt increased from $19.5 trillion in 2016 to $20.354 trillion in
2017. This is an increase of ((20.354 − 19.5)/19.5) × 100 = 4.38%. So in order for
the debt–GDP ratio to remain constant, nominal GDP must also grow at 4.38%.
e. GDP measures the size of the economy, which determines the ability of the
Solution

Chapter 13 Fiscal Policy S-189
Solution
WORK IT OUT Interactive step-by-step help with solving this
problem can be found online.
17. The accompanying table shows how consumers’ marginal propensities to
consume in a particular economy are related to their level of income.
Income range
Marginal propensity
to consume
$0−$20,000 0.9
a. Suppose the government engages in increased purchases of goods and
services. For each of the income groups in the table, what is the value of
the multiplier—that is, what is the “bang for the buck” from each dollar
the government spends on government purchases of goods and services in
each income group?
17. a. The accompanying table shows the bang for the buck for an additional $1 of
government purchases of goods and services for a consumer in each income
range. It is calculated as 1/(1 − MPC).
Income range
Marginal propensity
to consume Bang for the buck
$0−$20,000 0.9 10
b. Since the bang for the buck is highest for the lowest income group, fiscal policies