Monopolistic Competition and Oligopoly 423
and
C. If the high-price/low-output equilibrium is achieved in the long run, total industry output
424 Chapter 13
Conversely, if the low-price/high-output equilibrium is achieved, total industry output
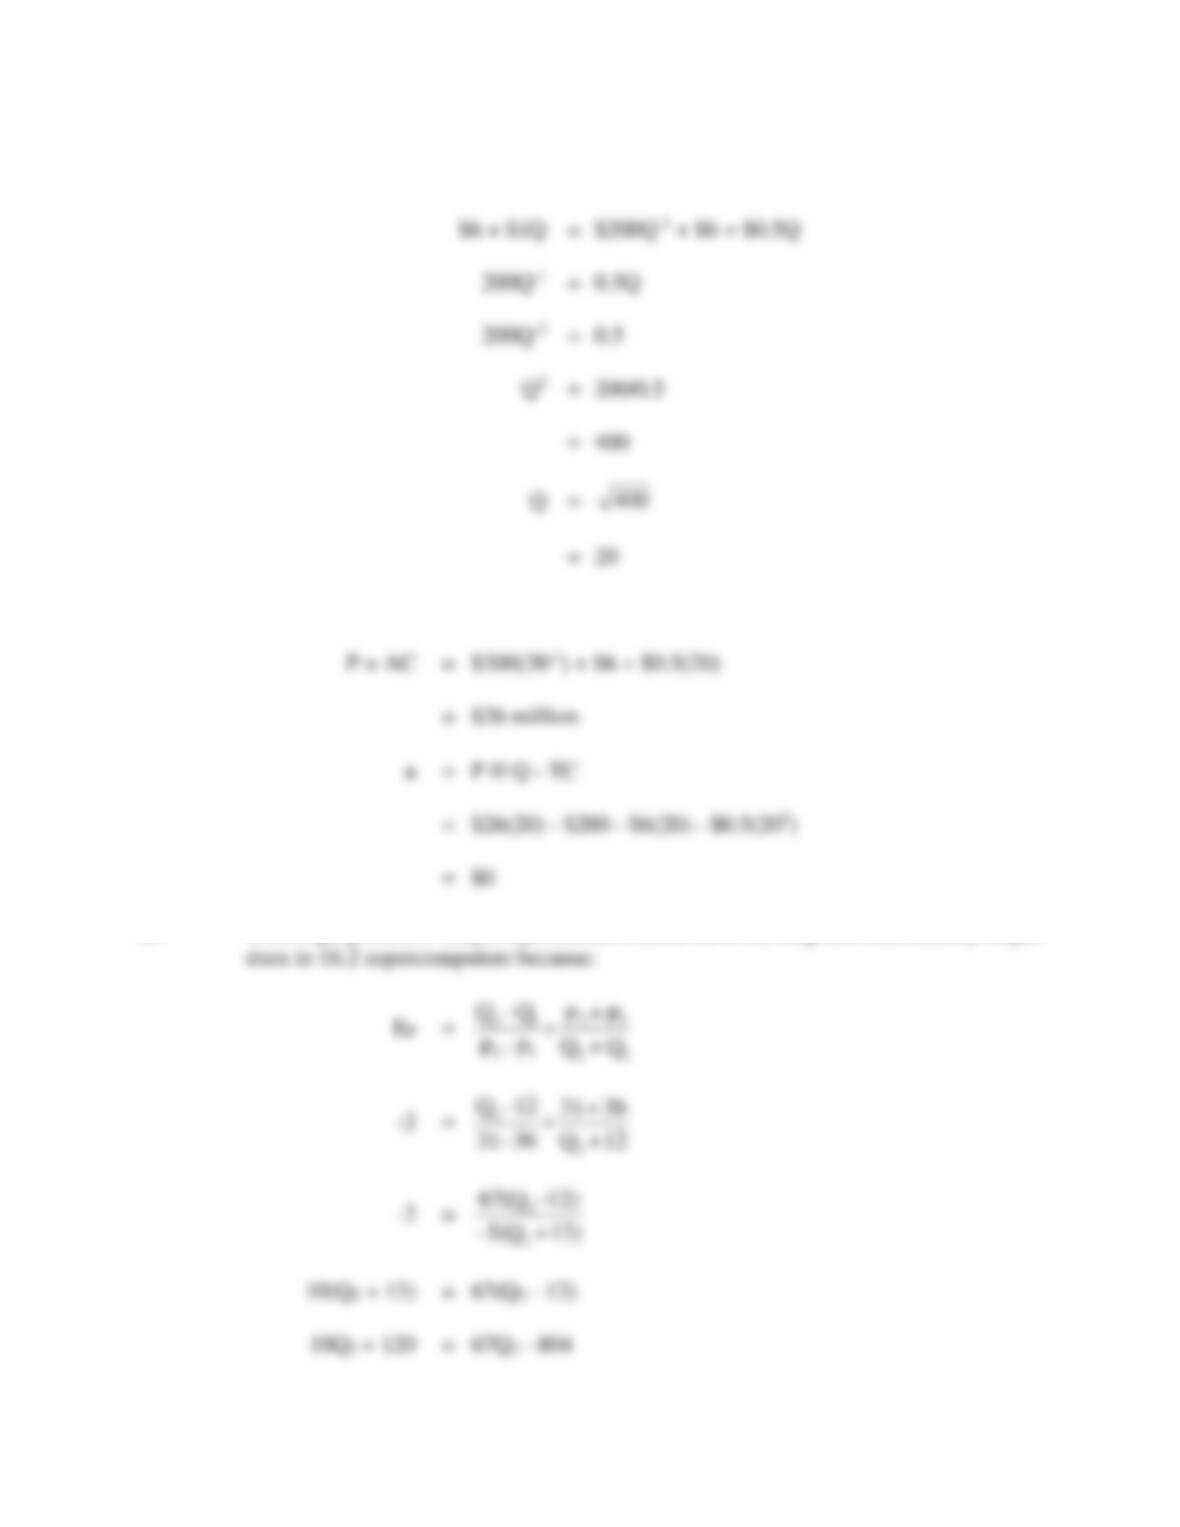
P13.5 Cartel Equilibrium. Assume the Hand Tool Manufacturing Industry Trade Association
recently published the following estimates of demand and supply relations for hammers:
QD = 60,000 – 10,000P (Demand),
QS = 20,000P (Supply).
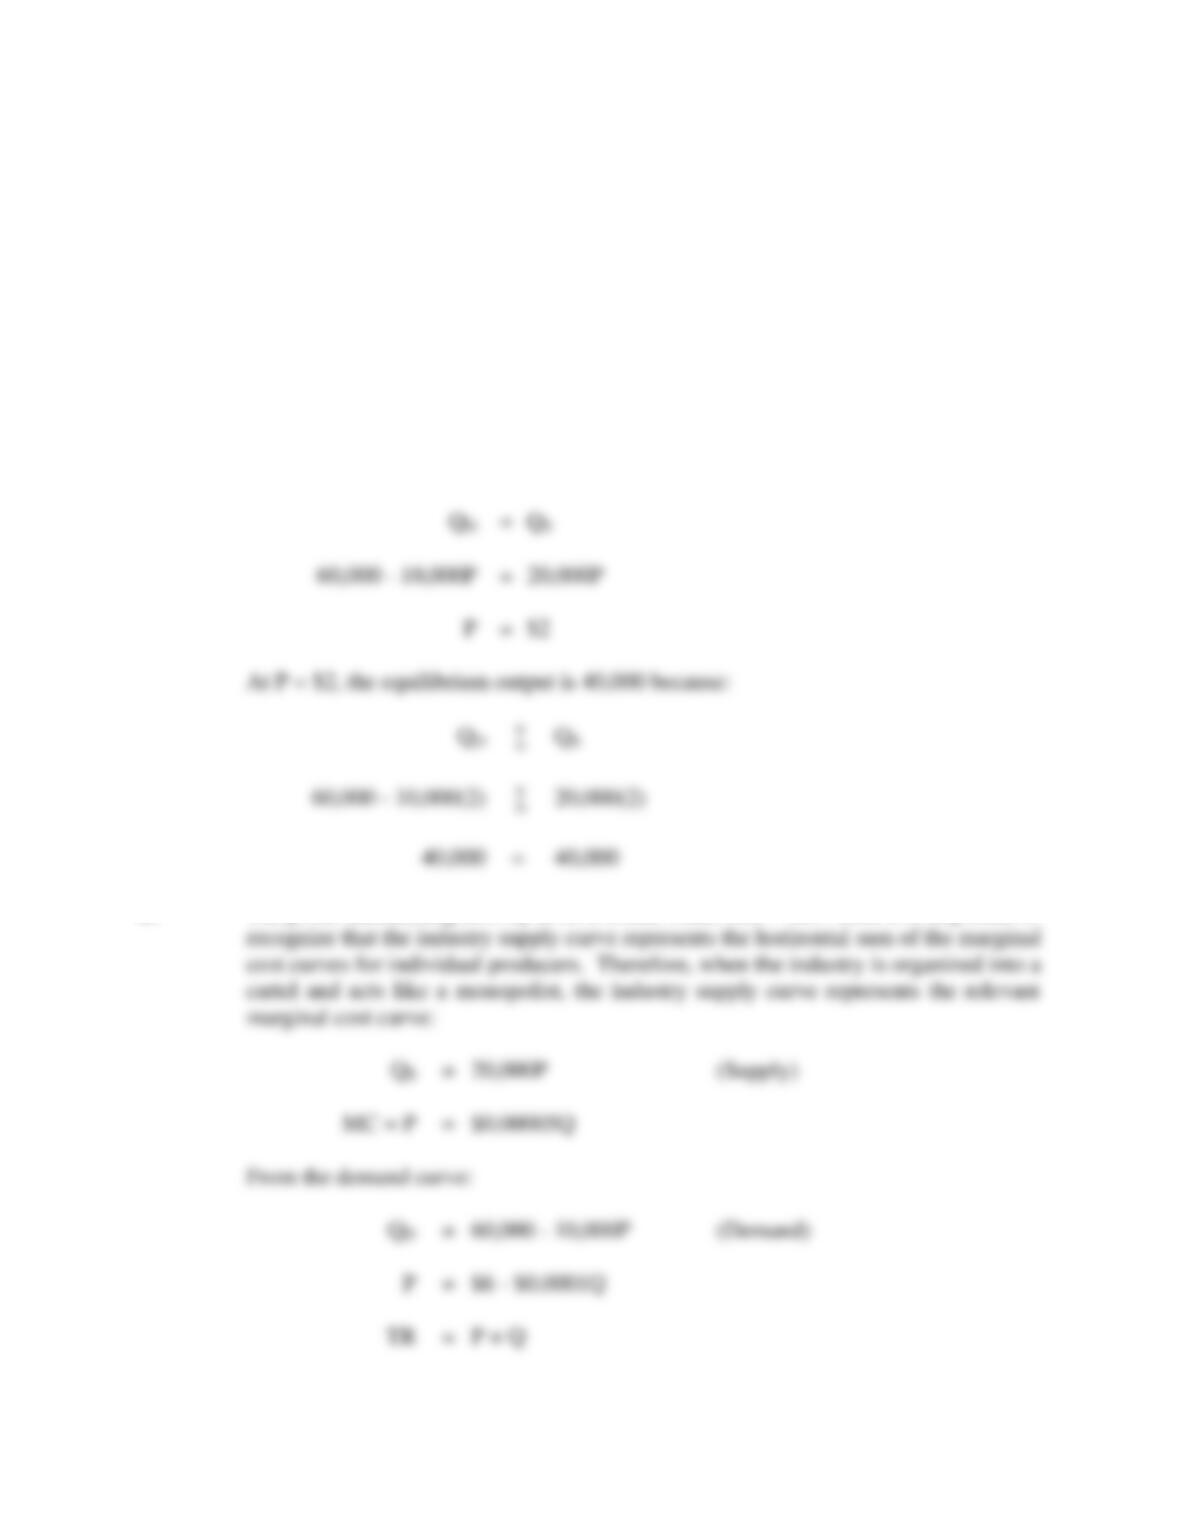
A. Calculate the perfectly competitive industry equilibrium price/output combination.
Monopolistic Competition and Oligopoly 425
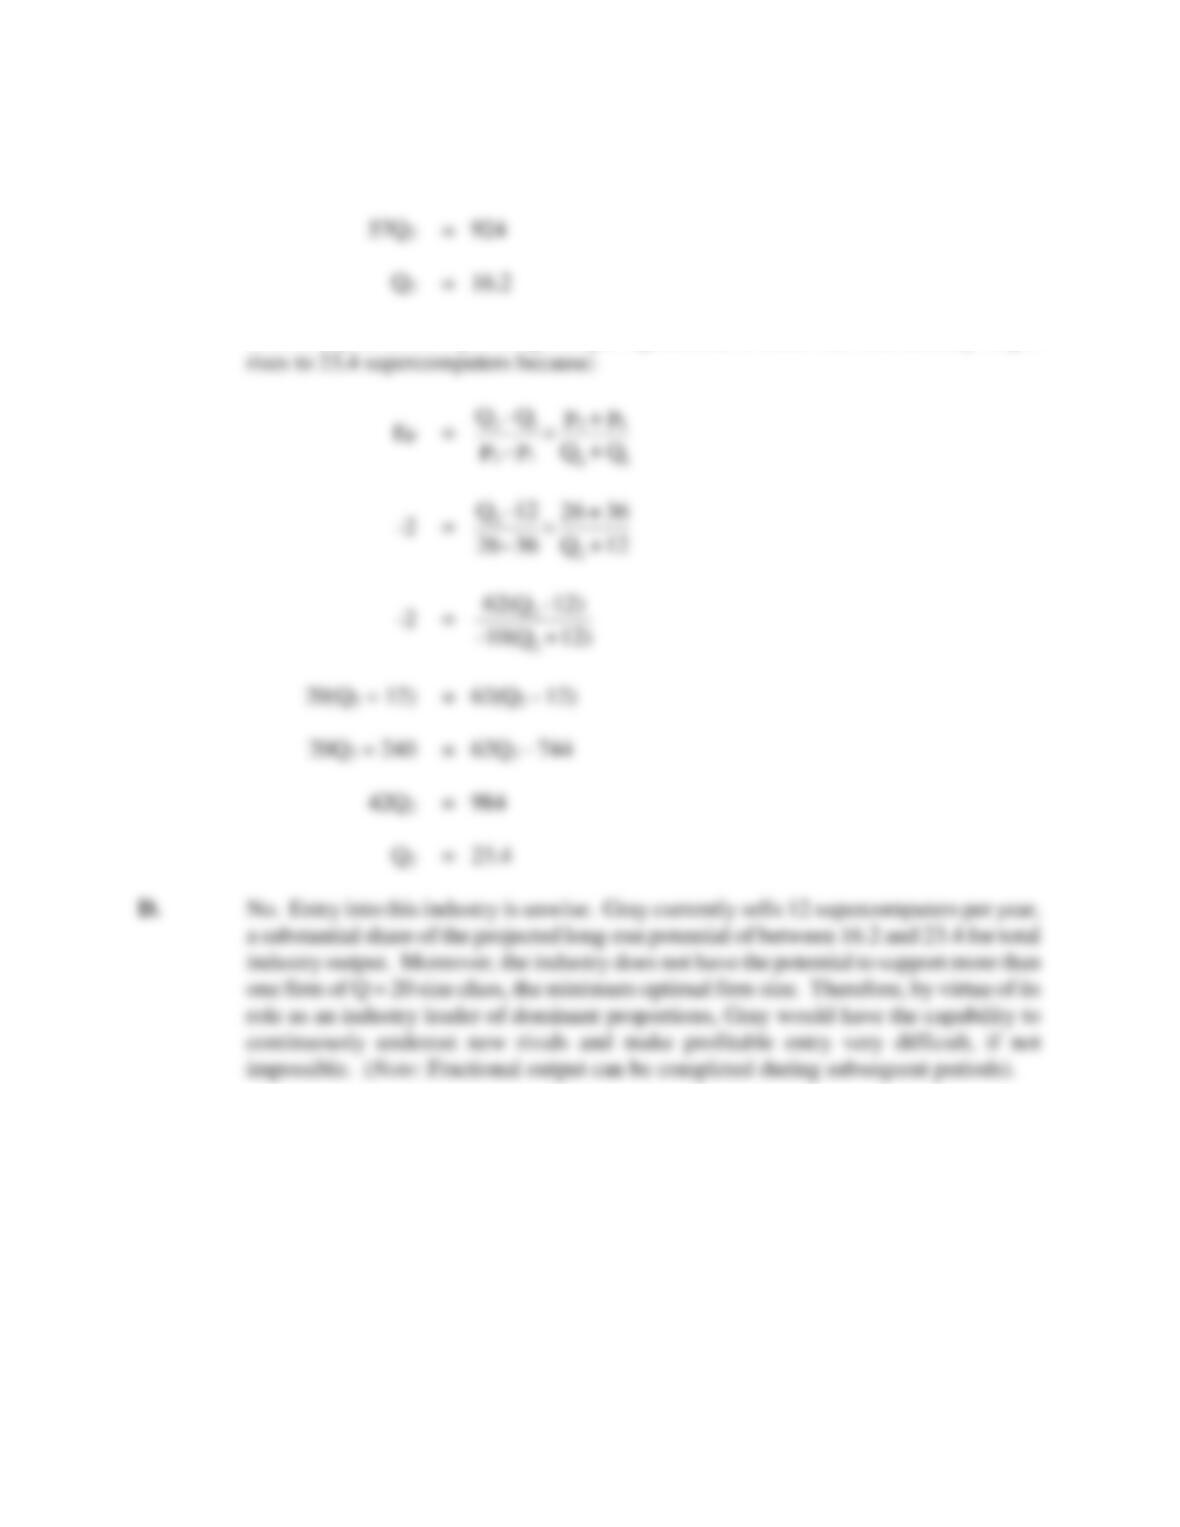
B. Now assume that the industry output is organized into a cartel. Calculate the
industry price/output combination that will maximize profits for cartel members.
(Hint: As a cartel, industry MR = $6 – $0.0002Q.)
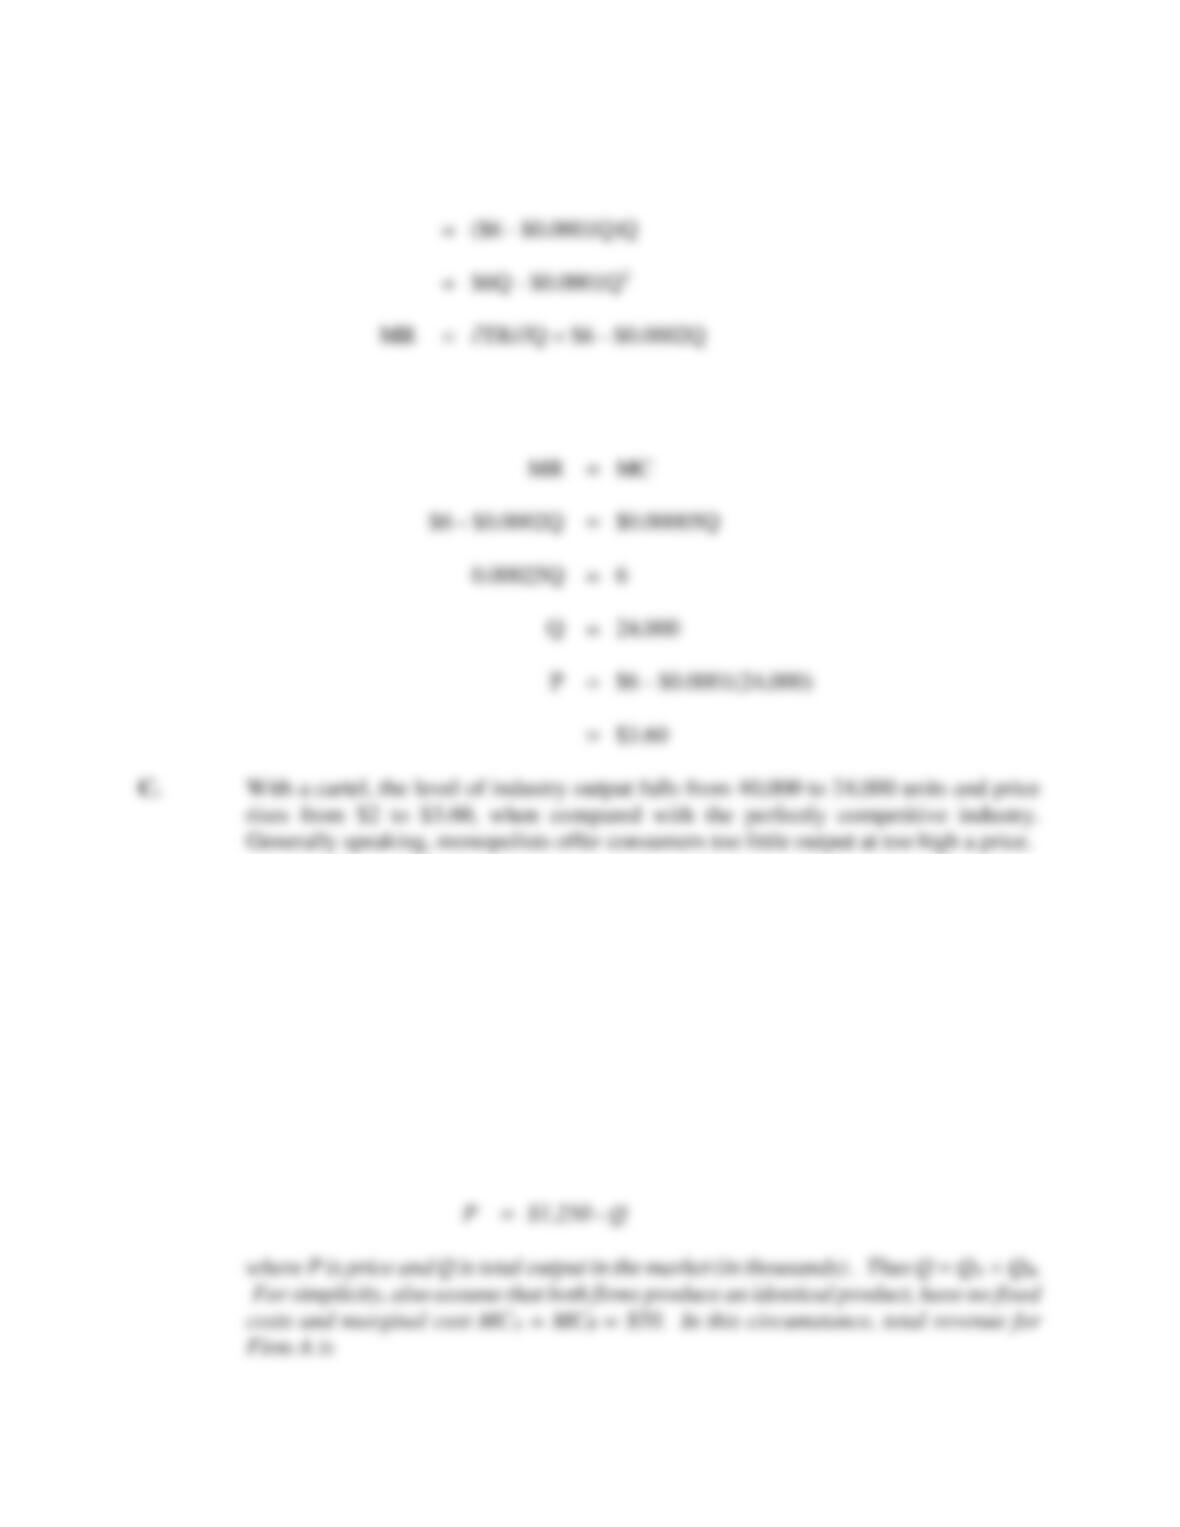
C. Compare your answers to parts A and B. Calculate the price/output effects of the
cartel.
P13.5 SOLUTION
A. The industry equilibrium price is determined by setting:
B. The profit-maximizing activity level is found where MR = MC. Here it is important to
426 Chapter 13
And the profit-maximizing activity level is found by setting MR = MC and solving for
Q:
P13.6 Cournot Equilibrium. VisiCalc, the first computer spreadsheet program, was released
to the public in 1979. A year later, introduction of the DIF format made spreadsheets
much more popular because they could now be imported into word processing and other
software programs. By 1983, Mitch Kapor used his previous programming experience
with VisiCalc to found Lotus Corp. and introduce the wildly popular Lotus 1-2-3
spreadsheet program. Despite enormous initial success, Lotus 1-2-3 stumbled when
Microsoft Corp. introduced Excel with a much more user-friendly graphical interface in
1987. Today, Excel dominates the market for spreadsheet applications software.
To illustrate the competitive process in markets dominated by few firms, assume
that a two-firm duopoly dominates the market for spreadsheet application software, and
that the firms face a linear market demand curve
Monopolistic Competition and Oligopoly 427
Similar total revenue and marginal revenue curves hold for Firm B.
A. Derive the output reaction curves for Firms A and B.
B. Calculate the Courtnot market equilibrium price-output solutions.
P13.6 SOLUTION
A. Because MCA = 0, Firm A’s profit-maximizing output level is found by setting MRA =
B. The Cournot market equilibrium level of output is found by simultaneously solving the
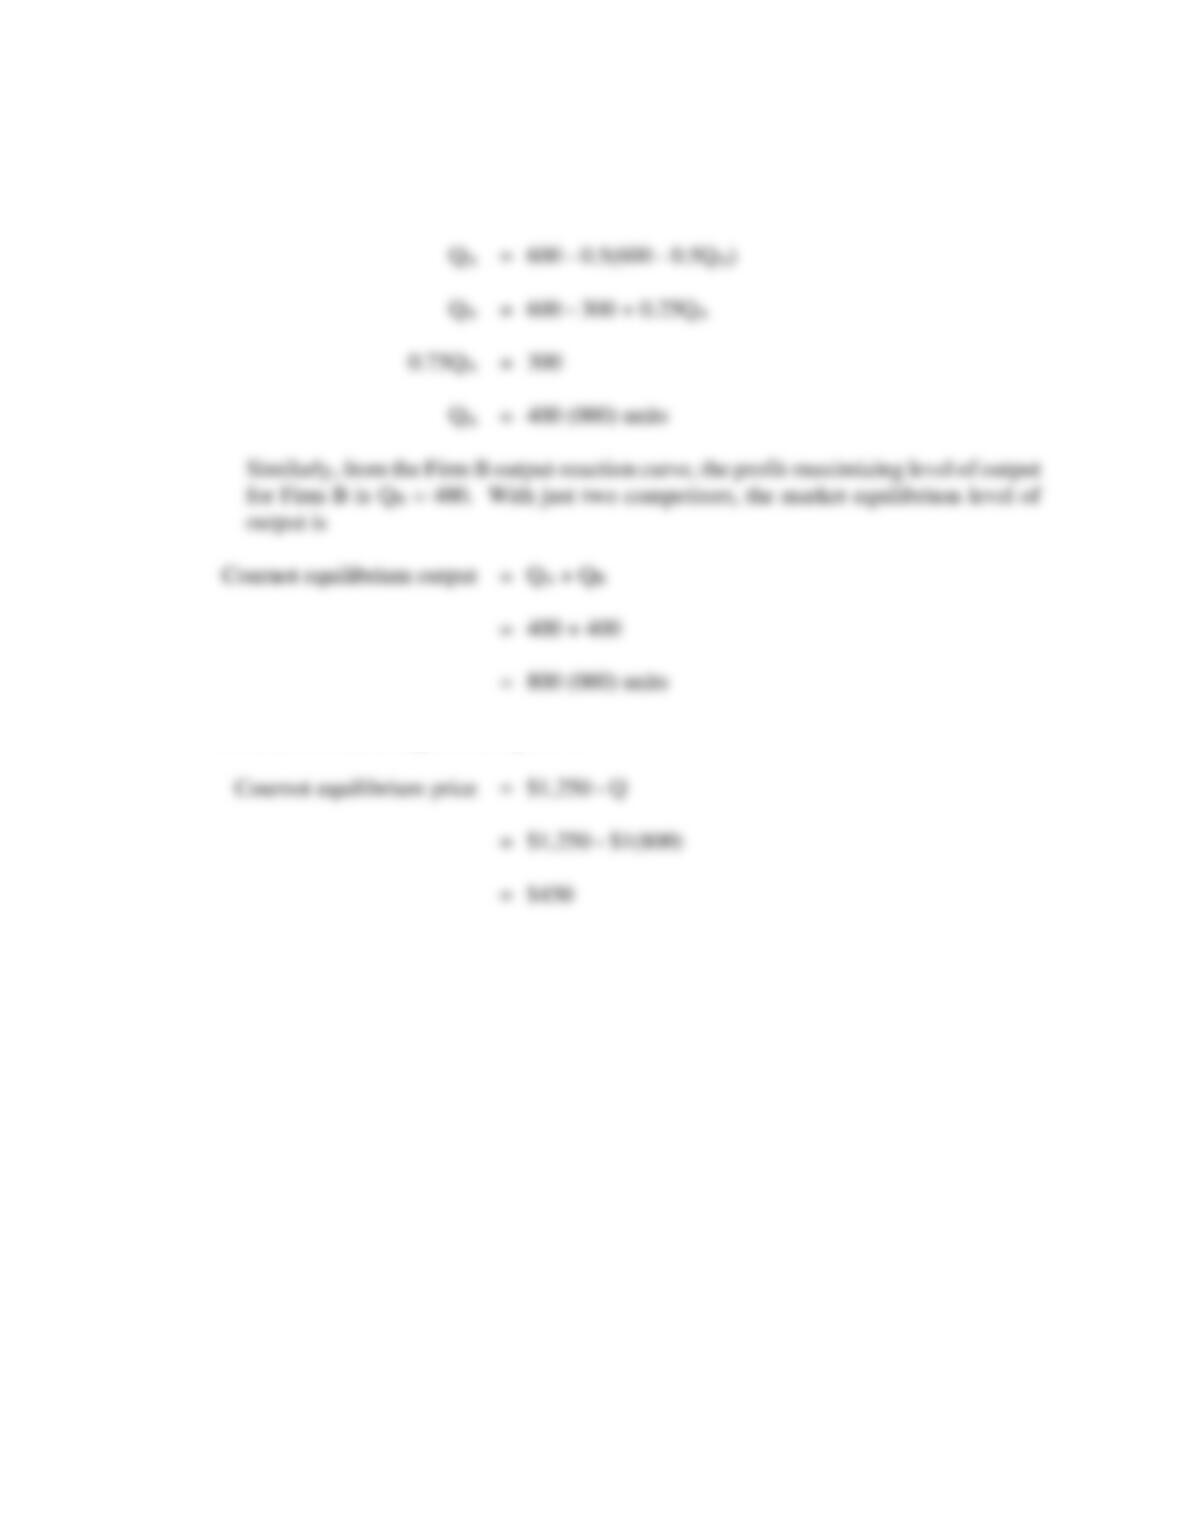
428 Chapter 13
The Cournot market equilibrium price is
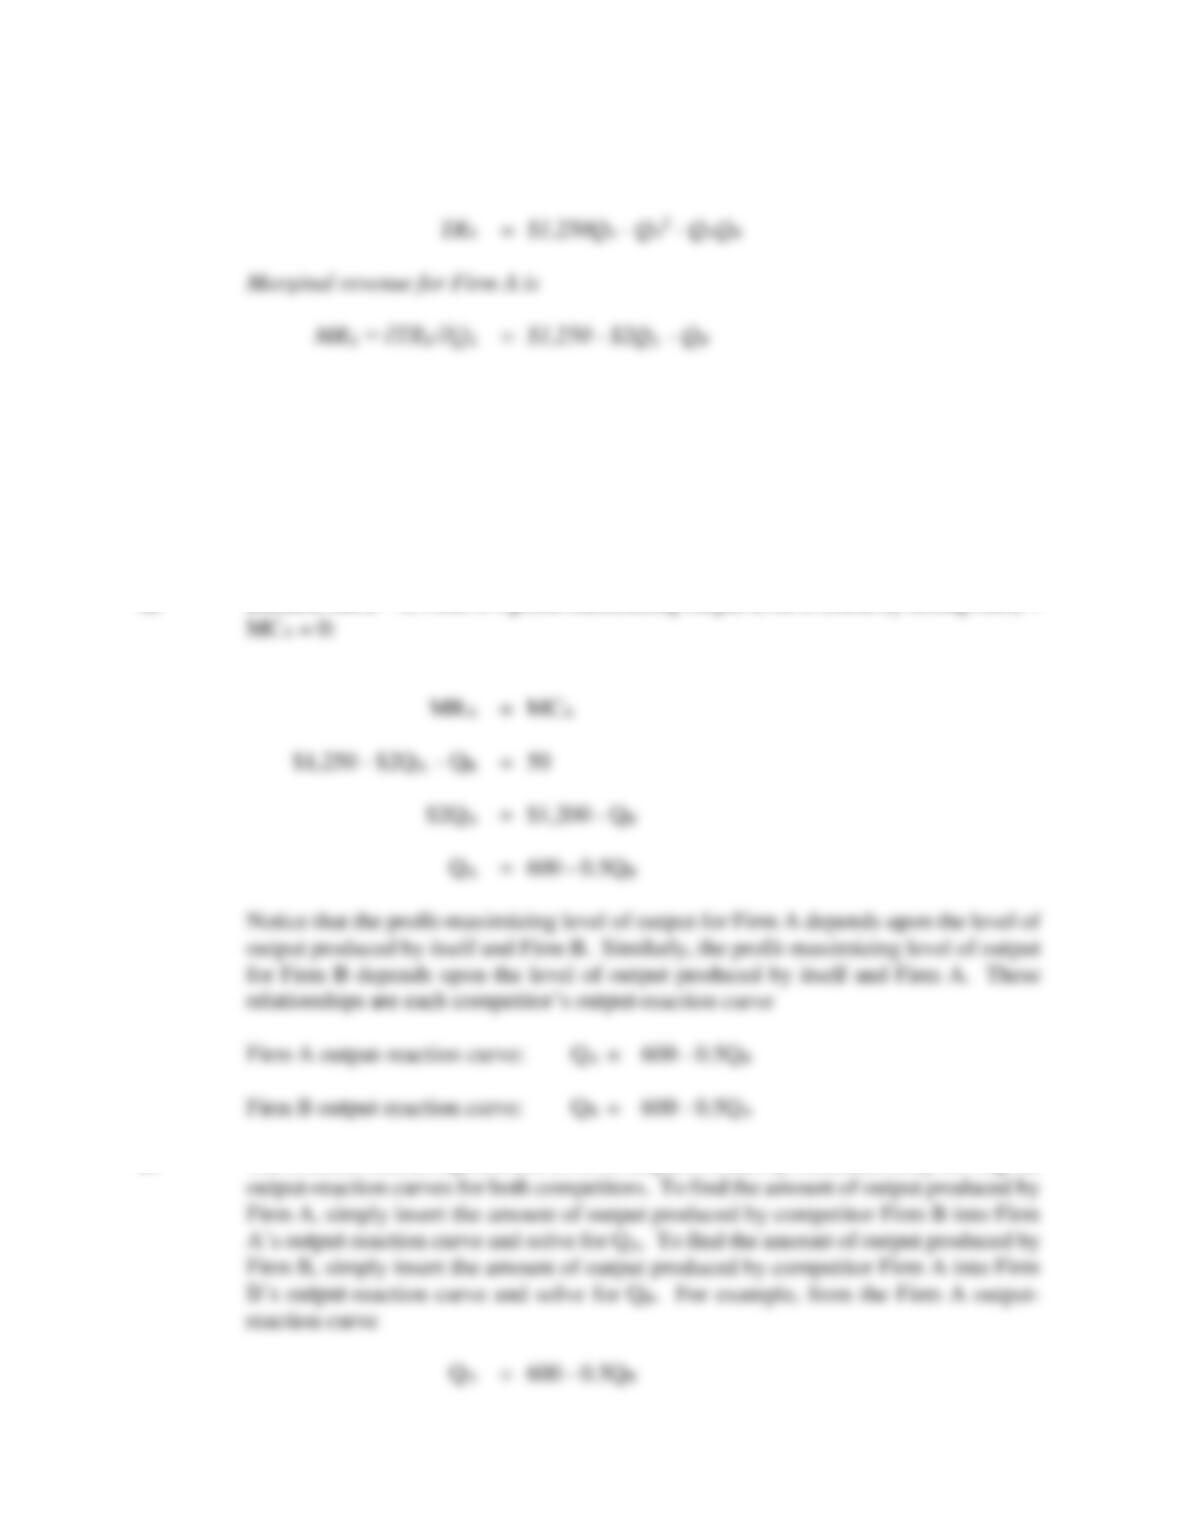
P13.7 Stackelberg Model. Imagine that a two-firm duopoly dominates the market for
spreadsheet application software for personal computers. Also assume that the firms
face a linear market demand curve
P = $1,250 – Q
where P is price and Q is total output in the market (in thousands) . Thus Q = QA + QB.
For simplicity, also assume that both firms produce an identical product, have no fixed
costs and marginal cost MCA = MCB = $50. In this circumstance, total revenue for
Firm A is
TRA = $1,250QA – QA2 – QAQB
Marginal revenue for Firm A is
MRA = ∂TRA/∂QA = $1,250 – $2QA – QB
Monopolistic Competition and Oligopoly 429
Similar total revenue and marginal revenue curves hold for Firm B.
A. Calculate the Stackelberg market equilibrium price-output solutions.
B. How do the Stackelberg equilibrium price-output solutions differ from those
suggested by the Cournot model? Why?
P13.7 SOLUTION
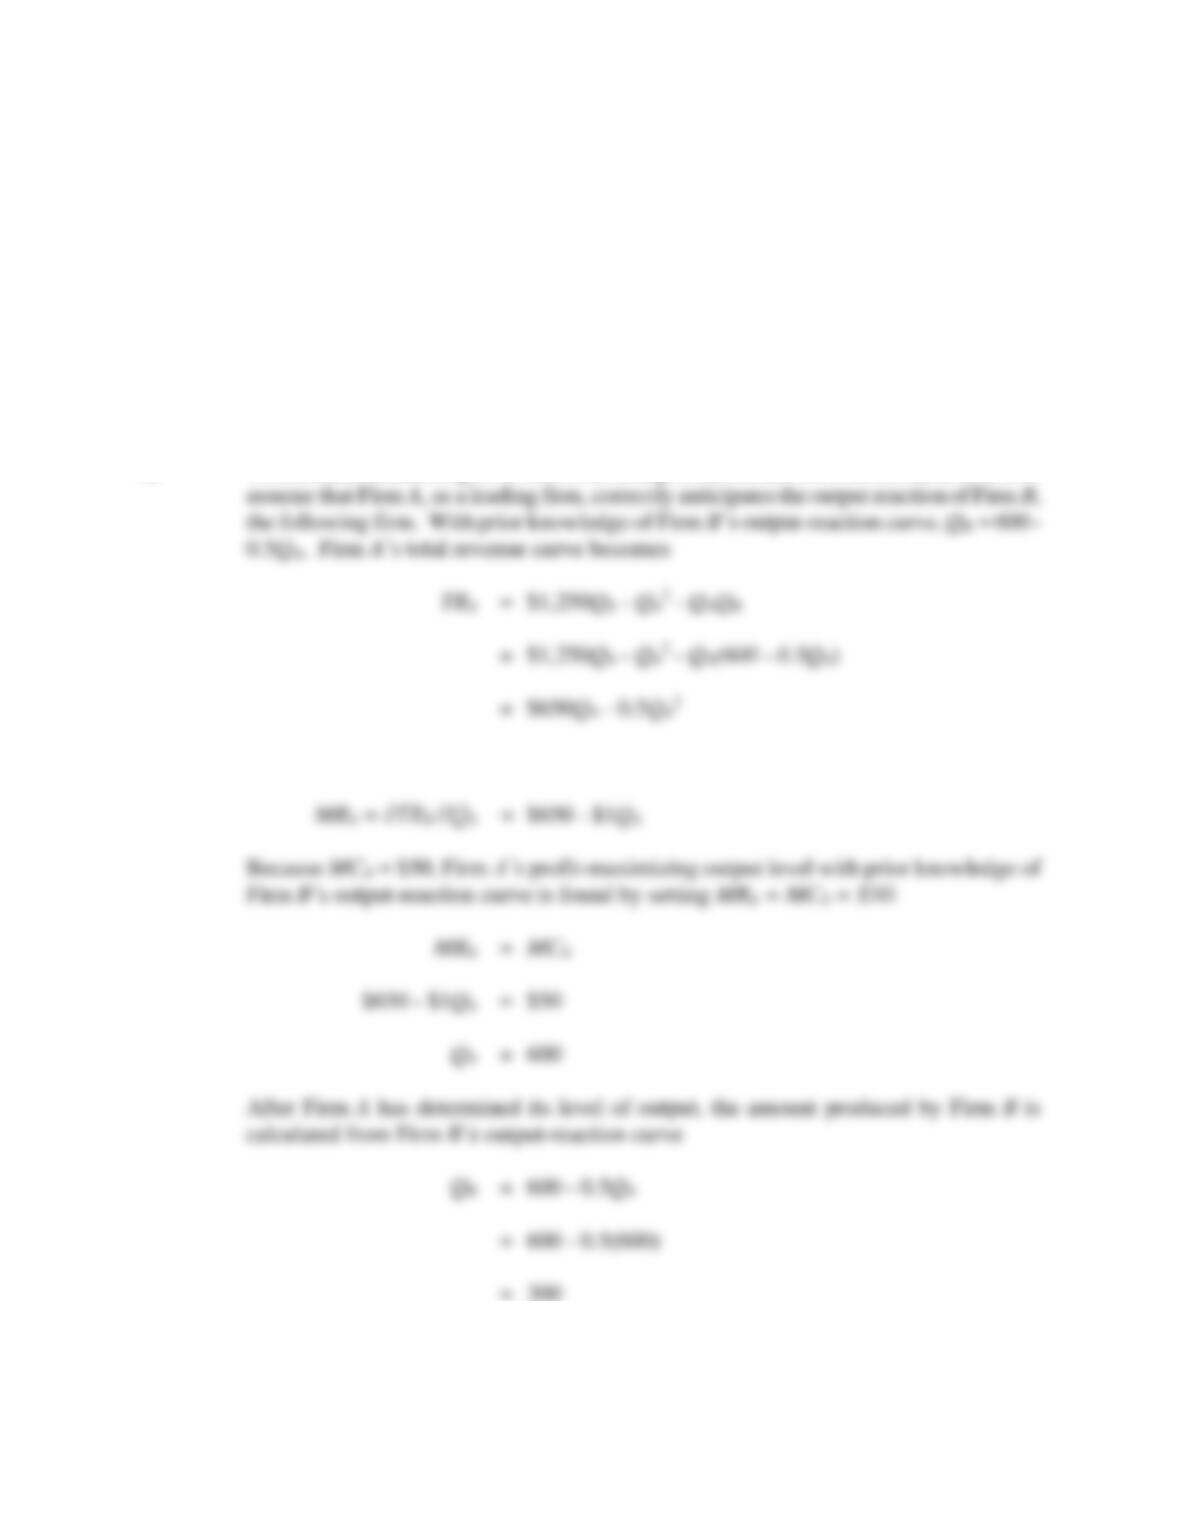
A. To illustrate Stackelberg first-mover advantages, reconsider the Cournot model but now
With prior knowledge of Firm B’s output-reaction curve, marginal revenue for Firm A is
With just two competitors, the Stackelberg market equilibrium level of output is
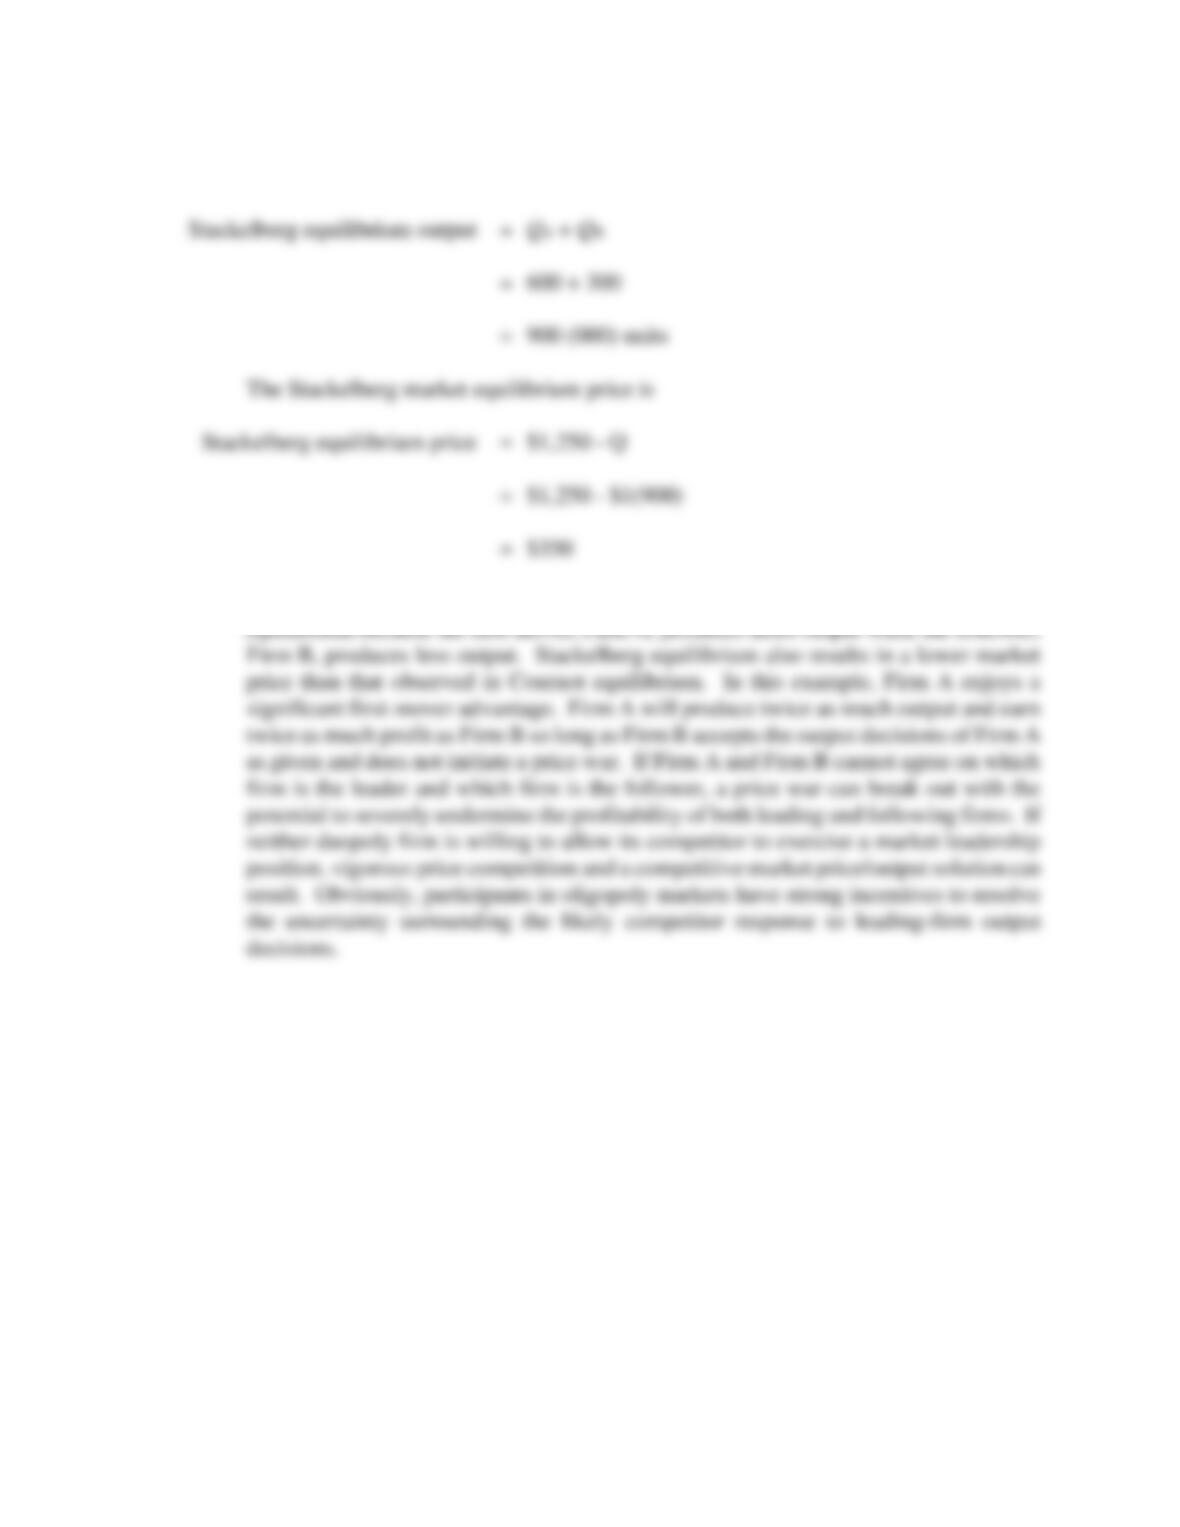
430 Chapter 13
B. Notice that market output is greater in Stackelberg equilibrium than in Cournot
P13.8 Bertrand Equilibrium. Coke and Pepsi dominate the U. S soft-drink market. Together,
they account for about 75% of industry sales. Suppose the quantity of Coke demanded
depends upon the price of Coke (PC) and the price of Pepsi (PP)
QC = 15 – 2.5PC + 1.25PP
where output (Q) is measured in millions of 24-packs per month, and price is the
wholesale price of a 24-pack. For simplicity, assume average costs are constant and AC
= MC = X dollars per unit. In that case, the total profit and change in profit with
respect to own price functions for Coke are
πC = TRC – TCC = PCQC – XQC = (PC – X) QC
∂πC/∂PC = 15 – 5PC + 1.25PP + 2.5X
Monopolistic Competition and Oligopoly 431
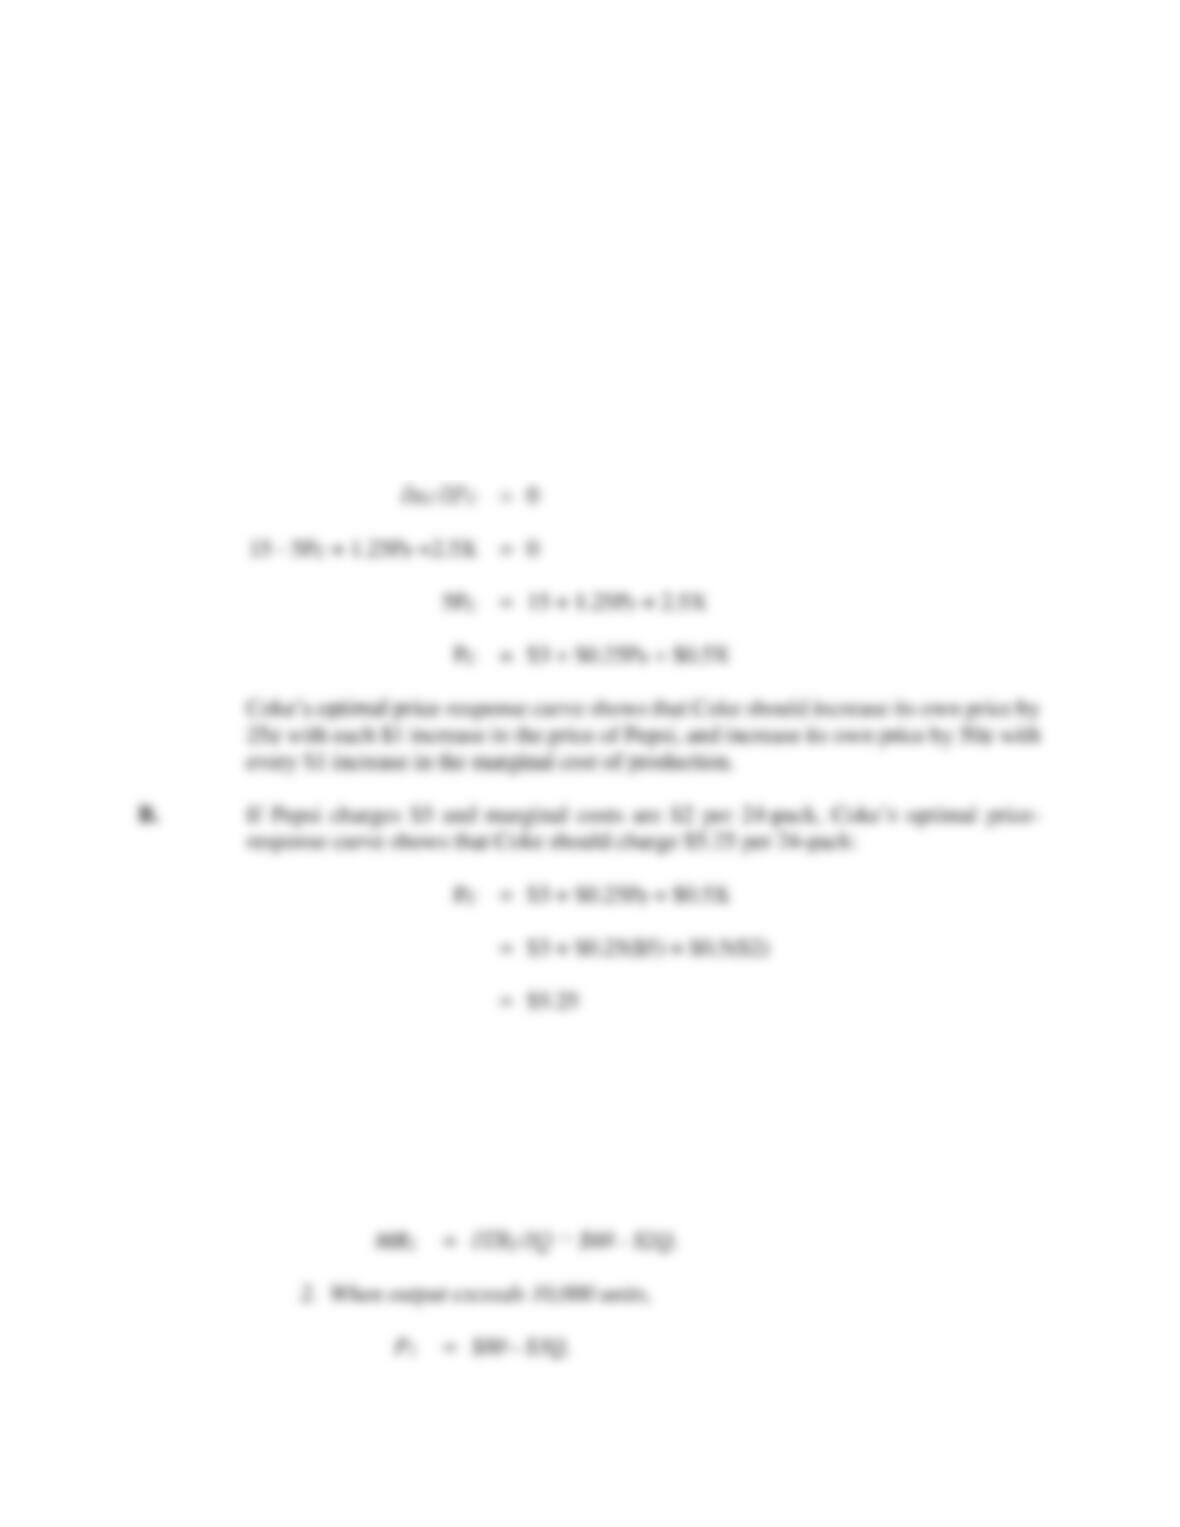
A. Set∂ πC/∂PC = 0 to derive Coke’s optimal price-response curve. Interpret your
answer.
B. Calculate Coke’s optimal price-output combination if Pepsi charges $5 and
marginal costs are $2 per 24-pack.
P13.8 SOLUTION
A. To derive Coke’s optimal price-response curve, set
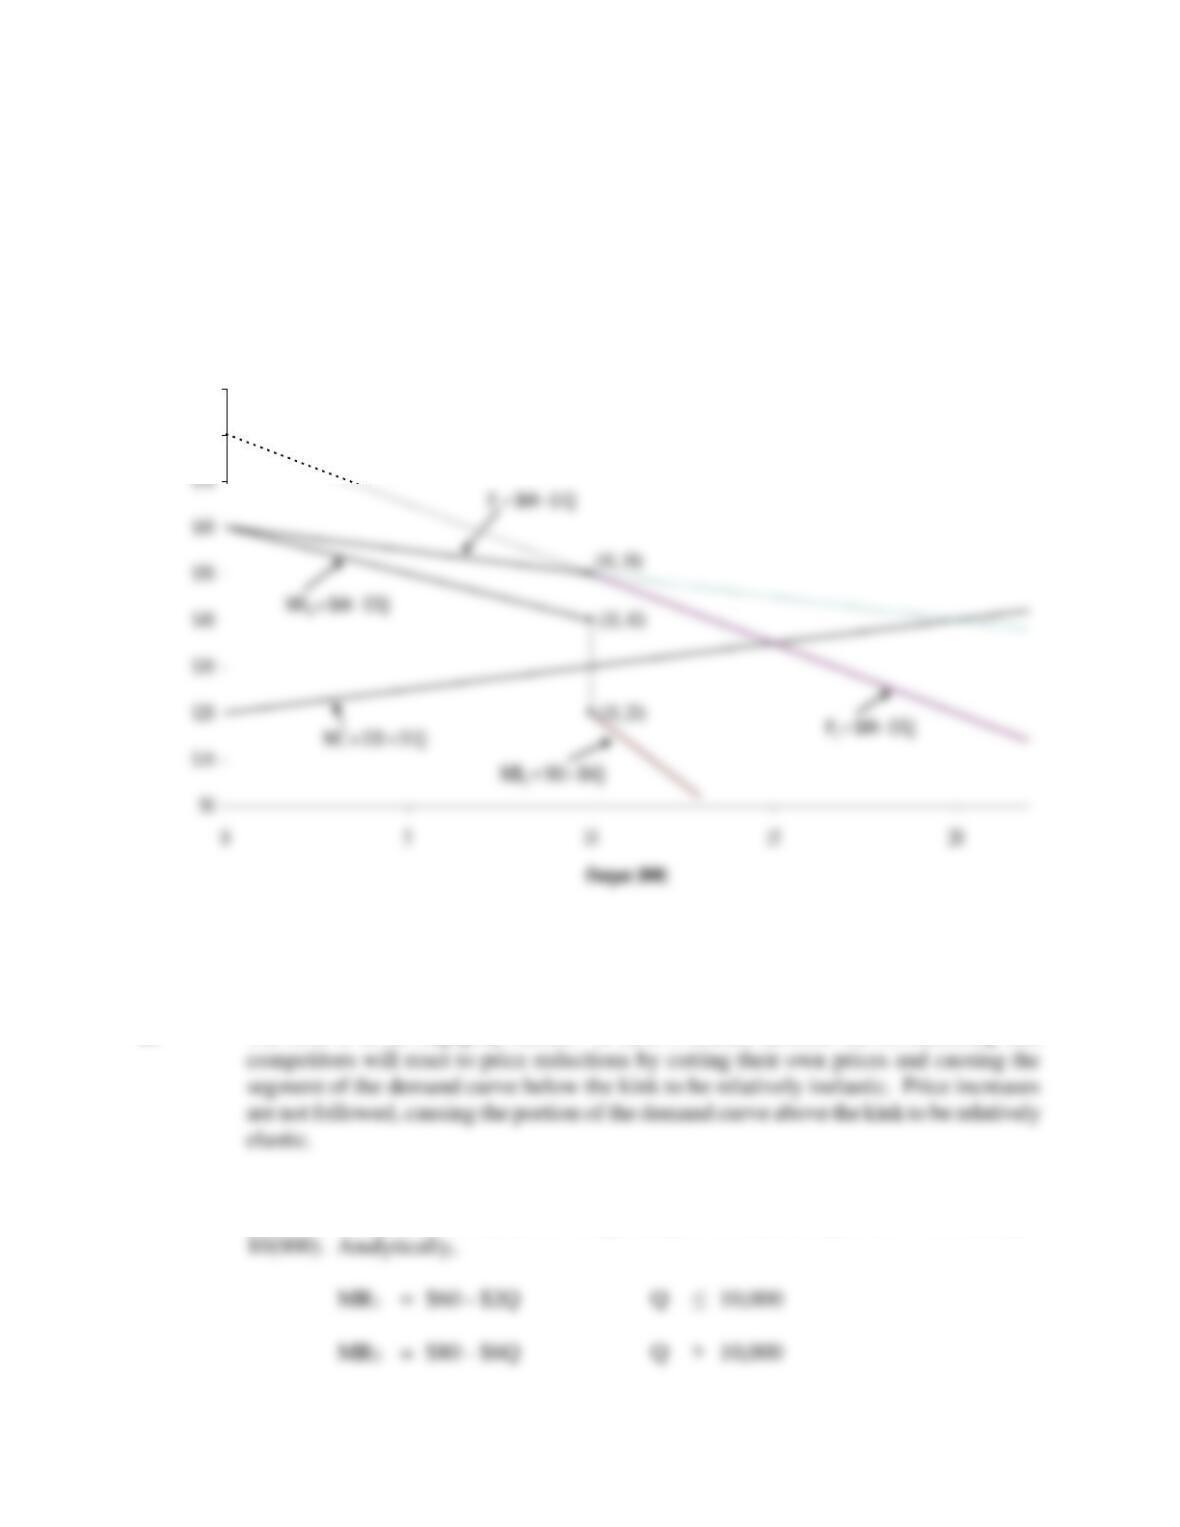
P13.9 Kinked Demand Curves. Assume Safety Service Products (SSP) faces the following
segmented demand and marginal revenue curves for its new infant safety seat:
1. Over the range from 0 to 10,000 units of output,
P1 = $60 – Q,
432 Chapter 13
MR2 = ∂TR2/∂Q = $80 – $6Q.
The company’s total and marginal cost functions are as follows:
TC = $100 + $20Q + $0.5Q2,
MC = ∂TC/∂Q = $20 + $1Q,
where P is price (in dollars); Q is output (in thousands); MR is marginal revenue; TC is
total cost; and MC is marginal cost, all in thousands of dollars.
A. Graph the demand, marginal revenue, and marginal cost curves.
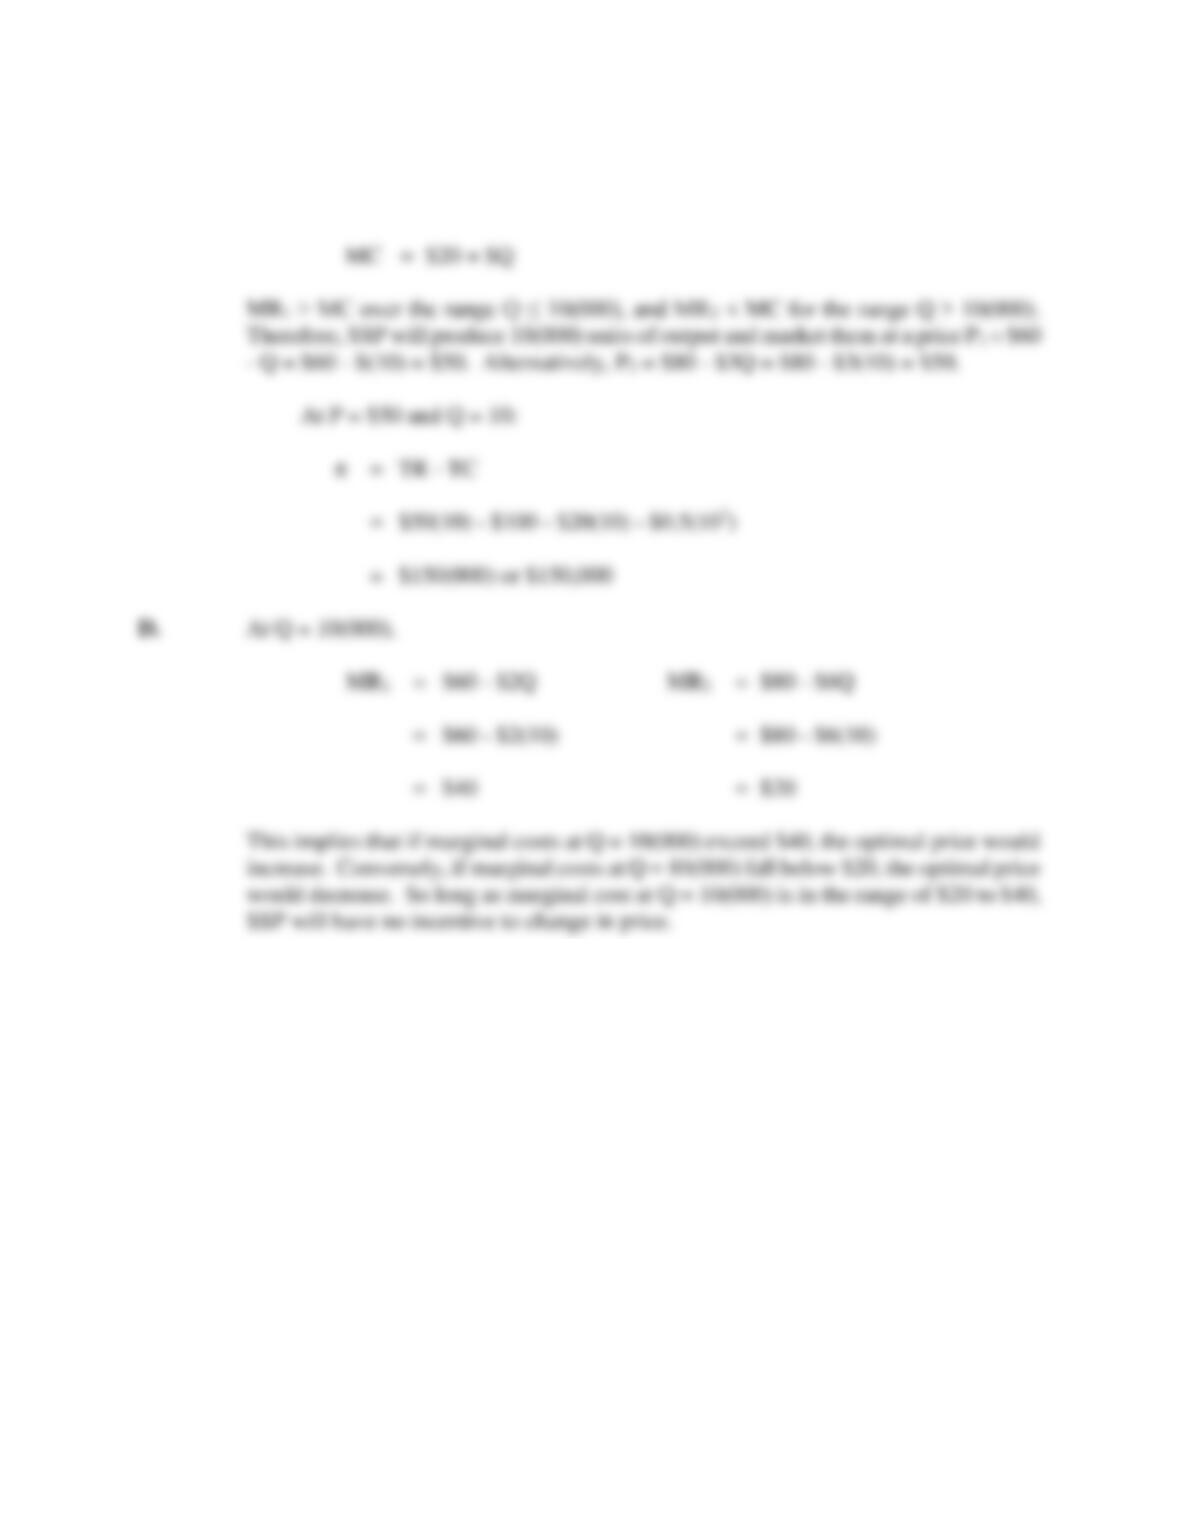
D. How much could marginal costs rise before the optimal price would increase?
How much could they fall before the optimal price would decrease?
P13.9 SOLUTION
A. Note that:
Monopolistic Competition and Oligopoly 433
B. The firm is in an oligopoly market. It faces a kinked demand curve, indicating that
C. An examination of the graph indicates that the marginal cost curve passes through the
gap in the marginal revenue curve. Graphically, this indicates optimal P = $50 and Q =
Safety Service Products (SSP)
Kinked Demand Curve Analysis
$80
$90
Dollars ($)
434 Chapter 13
P13.10 Market Structure Measurement. In 2005, Federated Department Stores, Inc. proposed
to acquire The May Department Stores Co., thereby combining the two largest chains in
the United States of so-called “traditional” or “conventional” department stores.
Conventional department stores typically anchor enclosed shopping malls, feature
products in the mid-range of price and quality, and sell a wide range of products. The
proposed transaction would create high levels of concentration among conventional
department stores in many metropolitan areas of the United States, and the merged firm
would become the only conventional department store at certain of the 1,200 malls in
the United States.
A. How is the cross-elasticity concept used to empirically define economic markets?
B. Explain how the government’s finding that conventional department stores
compete against specialty stores led them to approve the proposed merger.
Monopolistic Competition and Oligopoly 435
P13.10 SOLUTION
A. An economic market consists of all individuals and firms willing and able to buy or sell
competing products during a given period. The key criterion in identifying competing
products is similarity in use. Precise determination of whether a specific good is a
distinct consumer needs.
B. In examining the Federated proposal to acquire May Department Stores, the key
question is the extent to which conventional department stores represent a distinct
economic market. If traditional department stores compete against specialty stores and
This evidence provided support for the conclusion that the acquisition likely would
not create anticompetitive effects. Staff also found no evidence that competitive
436 Chapter 13
CASE STUDY FOR CHAPTER 13
Market Structure Analysis at Columbia Drugstores, Inc.
Demonstrating the tools and techniques of market structure analysis is made difficult by the fact that
firm competitive strategy is largely based upon proprietary data. Firms jealously guard price,
market share and profit information for individual markets. Nobody should expect Target, for
example, to disclose profit and loss statements for various regional markets or on a store-by-store
basis. Competitors like Wal-Mart would love to have such information available; it would provide a
ready guide for their own profitable market entry and store expansion decisions.
To measure the effects of superstore competition on current profitability, Columbia asked
management consultant Peter Parker to conduct a statistical analysis of the company’s profitability
in its various markets. To net out size-related influences, profitability was measured by Columbia’s
gross profit margin, or earnings before interest and taxes divided by sales. Columbia provided
proprietary company profit, advertising, and sales data covering the last year for all 30 outlets,
Both capital intensity, K/S, measured by the ratio of the book value of assets to sales, and
advertising intensity, A/S, measured by the advertising–to-sales ratio, are expected to exert positive
influences on profitability. Given that profitability is measured by Columbia’s gross profit margin,
the coefficient on capital intensity measured Columbia’s return on tangible investment. Similarly,
Monopolistic Competition and Oligopoly 437
A. Describe the overall explanatory power of this regression model, as well as the relative
importance of each continuous variable.
B. Based on the importance of the binary or dummy variable that indicates superstore
competition, do superstores pose a serious threat to Columbia’s profitability?
C. What factors might Columbia consider in developing an effective competitive strategy to
combat the superstore influence?
CASE STUDY SOLUTION
A. The coefficient of determination R2 = 77.7% means that 77.7% of the total variation in
Columbia’s profit-margins can be explained by the regression model. This is a relatively
438 Chapter 13
C. Development of an effective competitive strategy to combat the influence of superstores
involves the careful consideration of a wide range of factors related to Columbia’s
business. It might prove fruitful to begin this analysis by more carefully considering