A n s w e r s t o t h e R e v i e w Q u i z z e s
Page 328 (page 736 in Economics)
1. What is fiscal policy, who makes it, and what is it designed to influence?
2. What special role does the president play in creating fiscal policy?
3. What special roles do the Budget Committees of the House of Representatives and the Senate
play in creating fiscal policy?
Each year the Budget Committees of the House of Representatives and the Senate consider the budget
4. What is the timeline for the U.S. federal budget each year? When does a fiscal year begin and end?
Consider the budget for 2015 as an example in answering this question. In February 2014 the president
5. Is the federal government budget today in surplus or deficit?
Page 333 (page 741 in Economics)
1. How does a tax on labor income influence the equilibrium quantity of employment?
A tax on labor income drives a wedge between the after-tax wage rate of workers and the before-tax
13
FISCAL POLICY**
C h a p t e r
2. How does the tax wedge influence potential GDP?
3. Why are consumption taxes relevant for measuring the tax wedge?
4. Why are income taxes on capital income more powerful than those on labor income?
Given positive inflation, what appears to be a moderate tax on interest income dramatically decreases
5. What is the Laffer curve and why is it unlikely that the United States is on the “wrong” side of it?
The Laffer curve is the relationship between the tax rate and the amount of tax revenue collected. The
Page 336 (page 744 in Economics)
1. What is a present value?
2. Distinguish between fiscal imbalance and generational imbalance.
Fiscal imbalance is the present value of the government’s commitments to pay benefits minus the
3. How large was the estimated U.S. fiscal imbalance in 2014 and how did it divide between current
and future generations?
4. What is the source of the U.S. fiscal imbalance and what are the painful choices that we face?
5. How much of U.S. government debt is held by the rest of the world?
Page 341 (page 749 in Economics)
1. What is the distinction between automatic and discretionary fiscal policy?
2. How do taxes and needs-tested spending programs work as automatic fiscal policy to dampen the
business cycle?
3. How do we tell whether a budget deficit needs discretionary action to remove it?
4. How can the federal government use discretionary fiscal policy to stimulate the economy?
5. Why might fiscal stimulus crowd out investment?
1 7 0 C H A P T E R 1 3
A n s w e r s t o t h e S t u d y P l a n P r o b l e m s a n d A p p l i c a t i o n s
Use the following news clip to work Problems 1 and 2.
Economy Needs Treatment
It’s the debt, stupid! Only when the government sets out a credible business plan will confidence and
hiring rebound.
Source: The Wall Street Journal, October 7, 2010
1. How has the U.S. government debt changed since 2008? What are the sources of the change in
U.S. government debt?
2. What would be a “credible business plan” for the government to adopt?
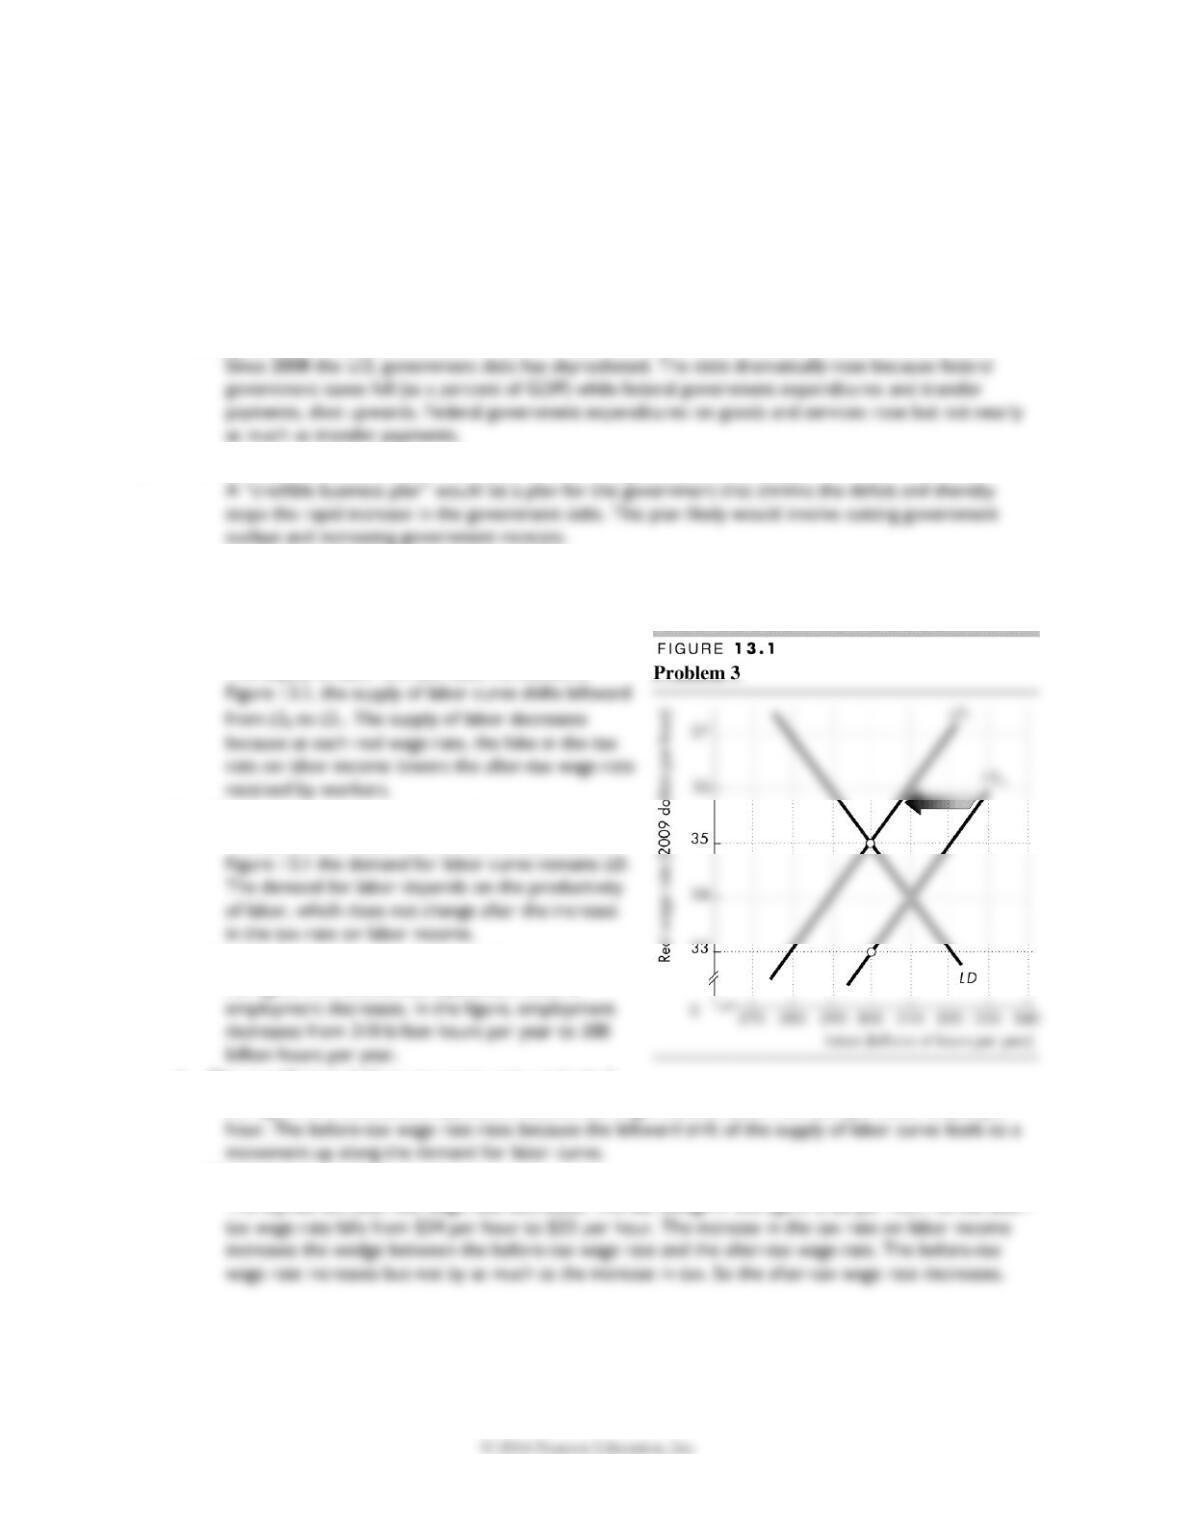
3. The government is considering raising the tax rate on labor income. Explain the supply-side
effects of such an action and use appropriate graphs to show the directions of change, not exact
magnitudes. What will happen to:
a. The supply of labor and why?
The supply of labor will decrease. As shown in
b. The demand for labor and why?
The demand for labor will remain the same so in
c. Equilibrium employment and why?
As Figure 13.1 shows, the equilibrium level of
d. The equilibrium before-tax wage rate and why?
As Figure 13.1 shows, the equilibrium before-tax wage rate increases from $34 per hour to $35 per
e. The equilibrium after-tax wage rate and why?
The equilibrium after-tax wage rate decreases. The tax wedge in the figure is $2 per hour, so the after–
F I S C A L P O L I C Y 1 7 1
f. Potential GDP?
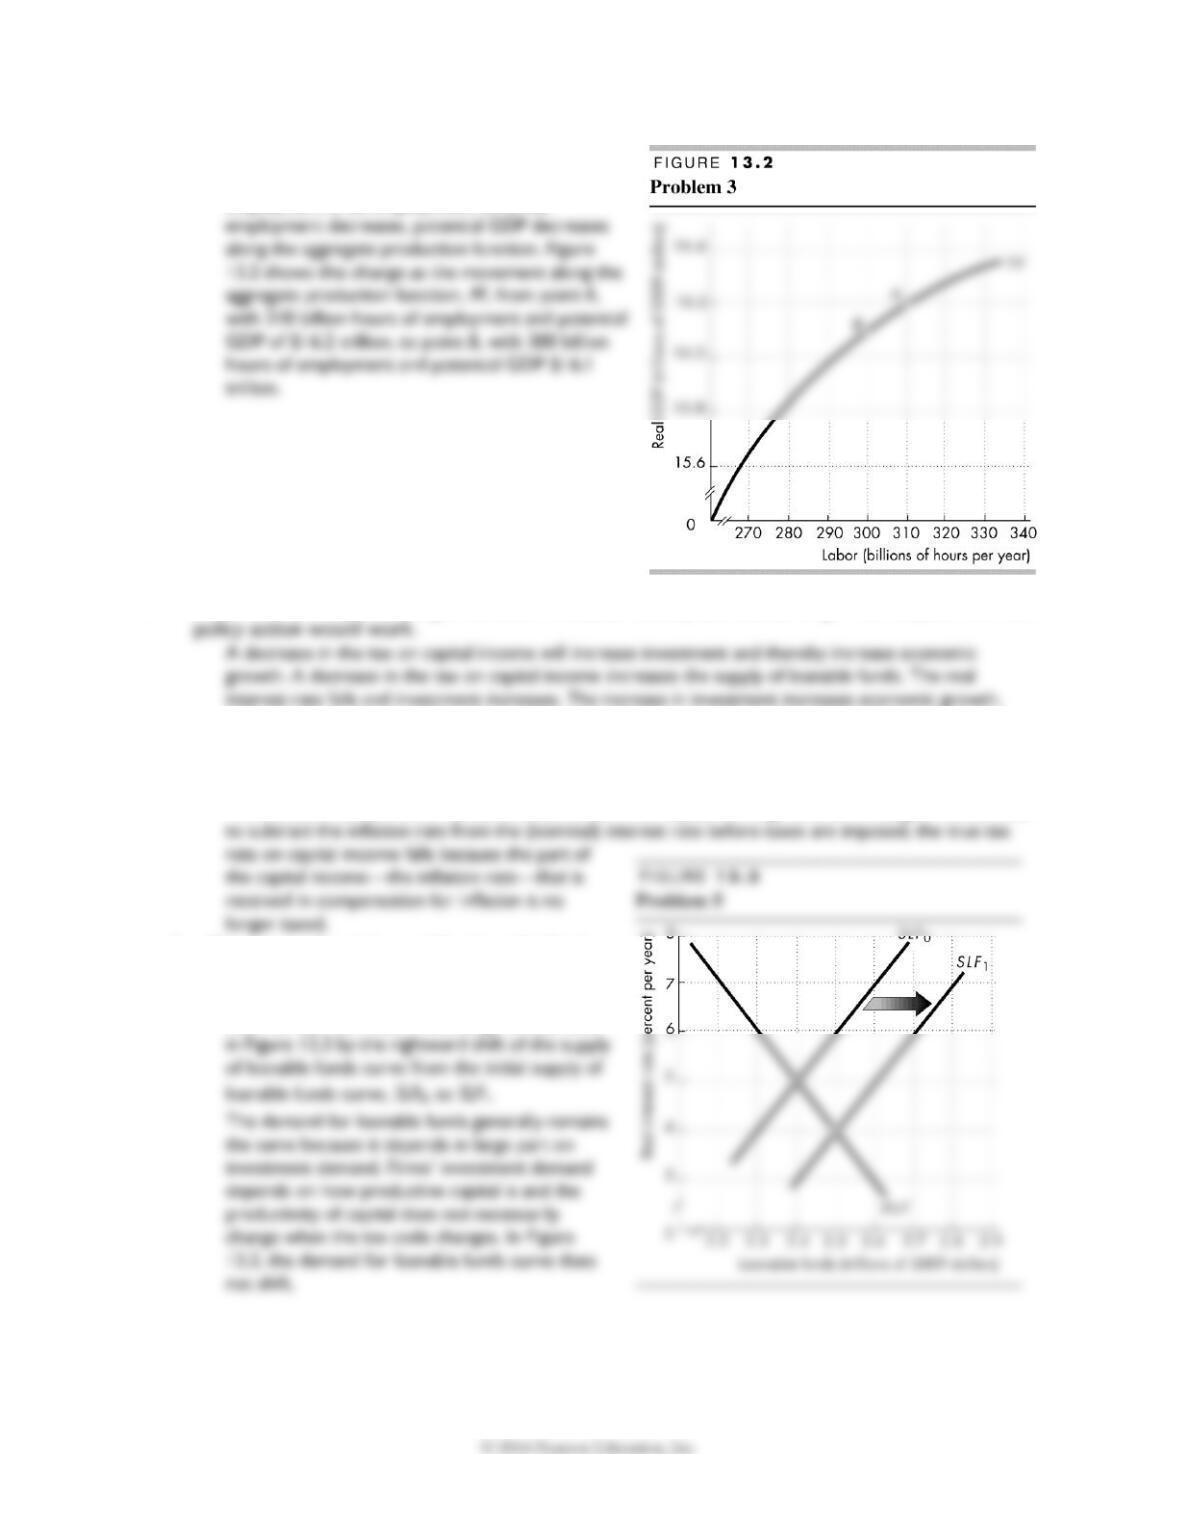
Potential GDP decreases. The equilibrium level of
employment is full employment. So as full
4. What fiscal policy action might increase investment and speed economic growth? Explain how the
5. Suppose that instead of taxing nominal capital income, the government taxed real capital income.
Use appropriate graphs to explain and illustrate the effect that this change would have on:
a. The tax rate on capital income.
The nominal interest rate is the (nominal) income from capital. If the government changes the tax code
b. The supply of and demand for loanable funds.
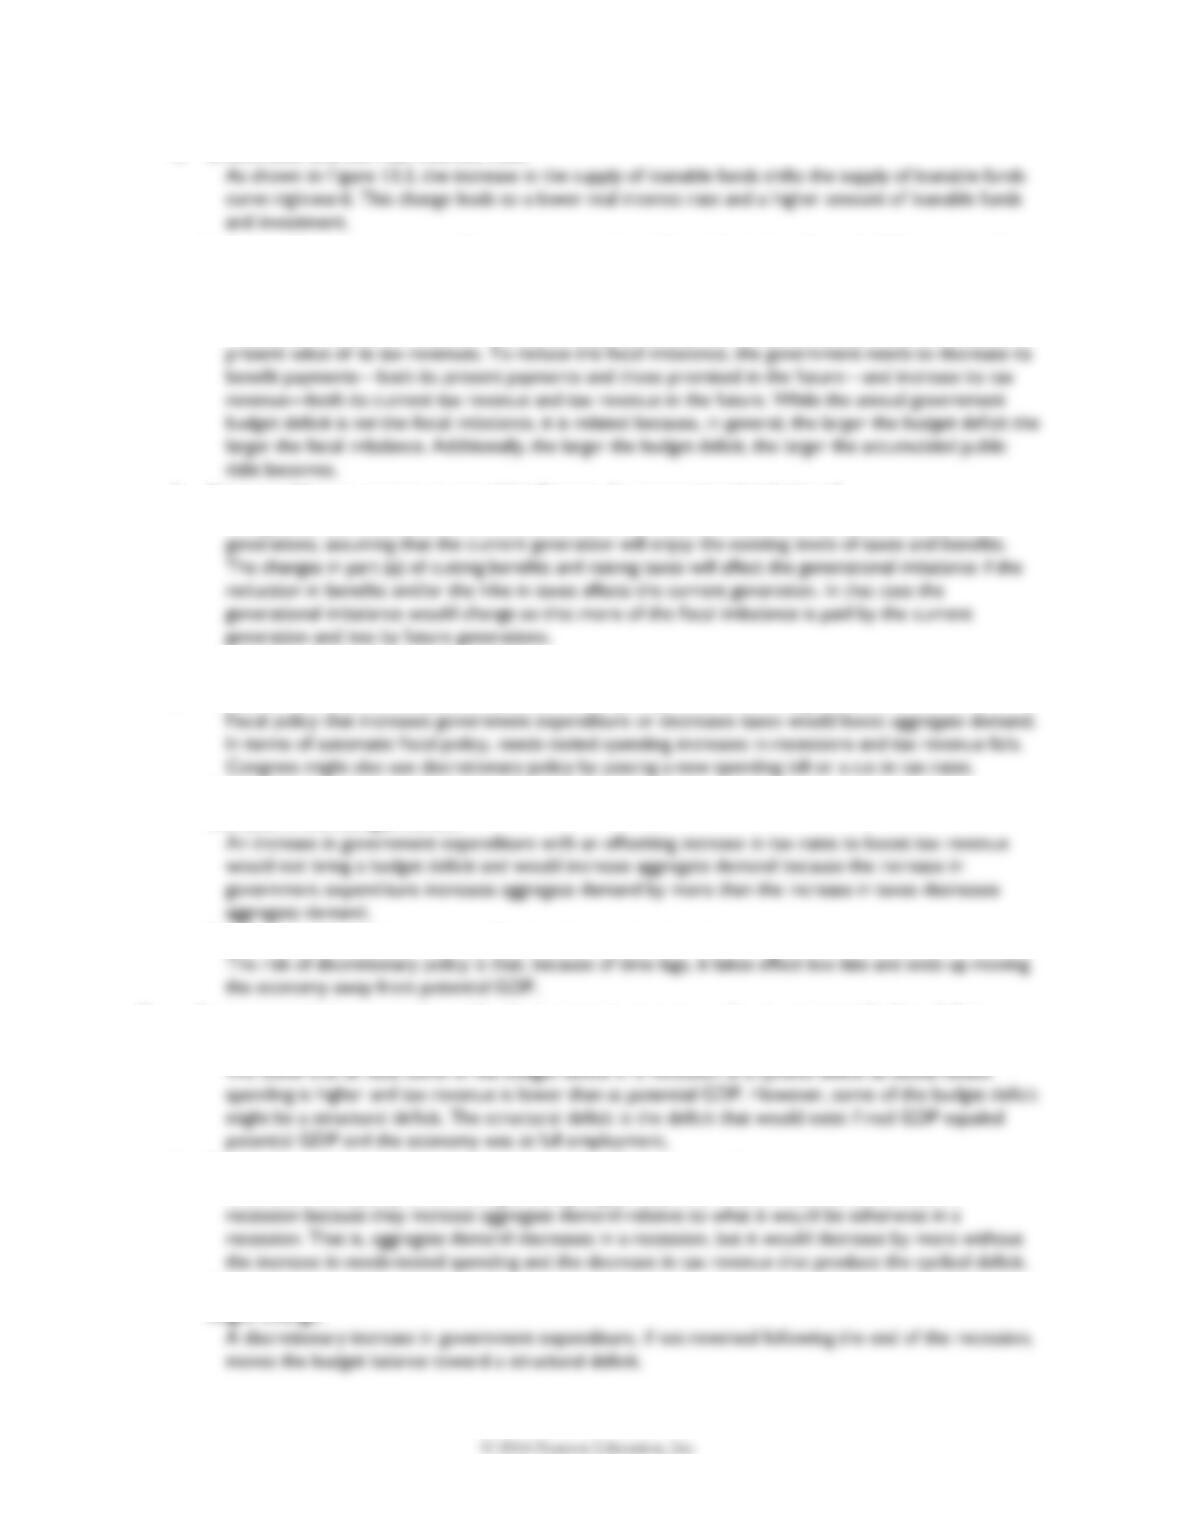
With a lower tax rate on capital income, the
supply of loanable funds increases as the after-tax
real interest rate rises. This change is illustrated
1 7 2 C H A P T E R 1 3
c. Investment and the real interest rate.
6. Under current policies, a plausible projection is that U.S. public debt will reach 250 percent of
GDP in 30 years and 500 percent in 50 years.
a. What is a fiscal imbalance? How might the U.S. government reduce the fiscal imbalance?
The fiscal imbalance is the present value of the government’s commitments to pay benefits minus the
b. How would your answer to part (a) influence the generational imbalance?
The generational imbalance is the division of the fiscal imbalance between the current and future
7. The economy is in a recession, and the recessionary gap is large.
a. Describe the discretionary and automatic fiscal policy actions that might occur.
b. Describe a discretionary fiscal stimulation package that could be used that would not bring an
increase in the budget deficit.
c. Explain the risks of discretionary fiscal policy in this situation.
8. An economy is in a recession with a large recessionary gap and a government budget deficit.
a. Do we know whether the budget deficit is a structural deficit or a cyclical deficit? Explain.
b. Explain how automatic fiscal policy is changing the output gap?
Automatic fiscal policy is decreasing the output gap relative to what it would be otherwise in a
c. If the government increases its discretionary expenditure, explain how the structural deficit
might change.
F I S C A L P O L I C Y 1 7 3
Use the following news clip and fact to work Problems 9 to 11.
Senate Approves Obama Tax Cut Plan
The U.S. Senate has passed legislation extending Bush-era tax cuts for high-income earners to middle-
class Americans earning up to $250,000 per year.
Source: Financial Times, July 26, 2012
Fact: Middle and low-income earners spend almost all their disposable incomes. High-income earners
save a significant part of their disposable incomes.
9. a. Explain the intended effect of extending tax
cuts for middle-class Americans but not for
high-income families. Draw a graph to
illustrate the intended effect.
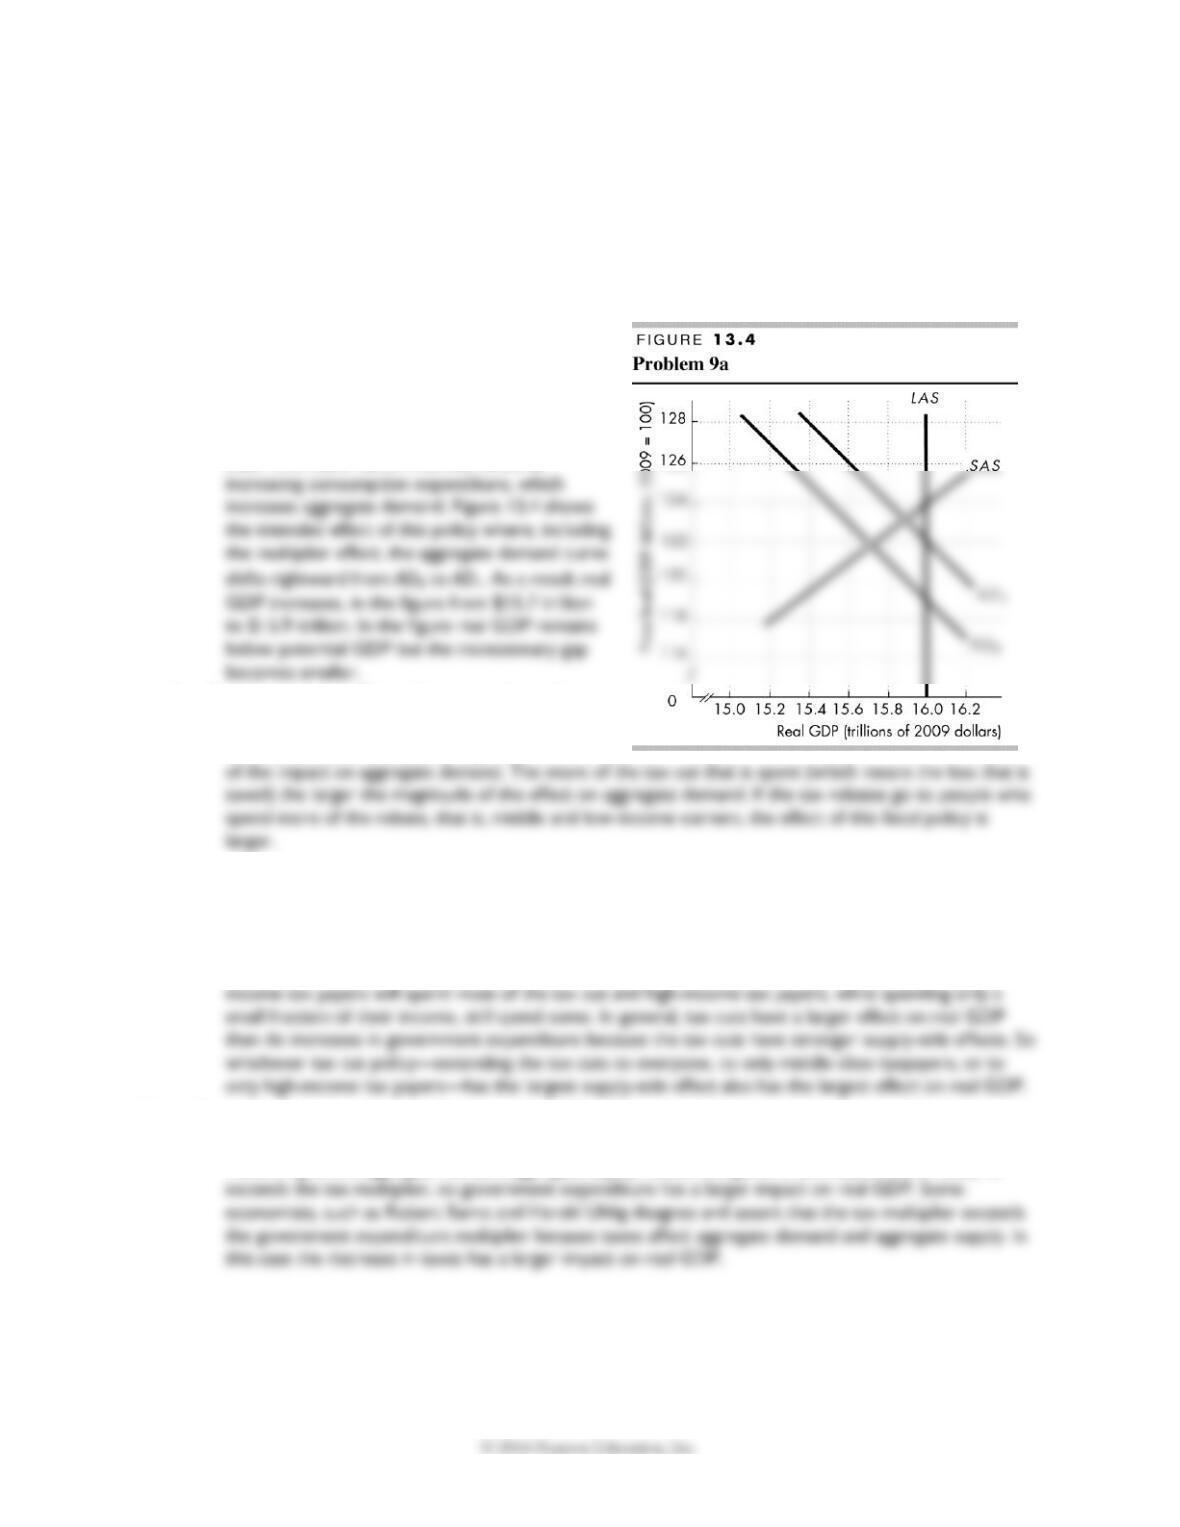
The goal of extending the tax cuts for middle-
class Americans has an intended effect of
b. Explain why the effect of tax cuts depends on
who receives them.
The effect of this fiscal policy depends on the size
10. What would have a larger effect on aggregate demand: extending the Bush-era tax cuts to
everyone; extending them for middle-class only; or extending them for high-income earners only?
How would each alternative compare with no tax cuts but an equivalent increase in government
expenditure?
Extending the income tax cuts to everyone will have the largest effect on aggregate demand. Middle–
11. Compare the impact on equilibrium real GDP of a same-sized decrease in taxes and increase in
government expenditure on goods and services.
According to the aggregate demand/aggregate supply model, the government expenditure multiplier
1 7 4 C H A P T E R 1 3
Answers to Additional Problems and Applications
12. 2012 Deficit: Smaller, But Still Big
The Congressional Budget Office said the budget deficit was about $1.1 trillion in fiscal year 2012.
That is about $200 billion smaller than in 2011, but still ranks as the fourth-largest deficit since
World War II.
Source: The Congressional Budget Office, October 5, 2012
Of the components of government outlays and receipts, which have changed most to contribute
to the huge budget deficits in 2011 and 2012?
In general, since 2008 outlays have increased substantially while receipts have risen slightly. The major
Use the following information to work Problems 13 and 14.
Suppose that investment is $1,600 billion, saving is $1,400 billion, government expenditure on goods and
services is $1,500 billion, exports are $2,000 billion, and imports are $2,500 billion.
13. Calculate the amount of tax revenue and the government budget balance.
14. a. Explain the impact of the government budget balance on investment.
b. What fiscal policy action might increase investment and speed economic growth? Explain how
the policy action would work.
15. Suppose that capital income taxes are based (as they are in the United States) on nominal interest
rates. If the inflation rate increases by 5 percent a year, explain and use appropriate graphs to
illustrate the effect of the rise in inflation on:
a. The tax rate on capital income.
F I S C A L P O L I C Y 1 7 5
b. The supply of loanable funds.
With a higher tax rate on capital income, the
c. The demand for loanable funds.
The demand for loanable funds generally remains
d. Equilibrium investment.
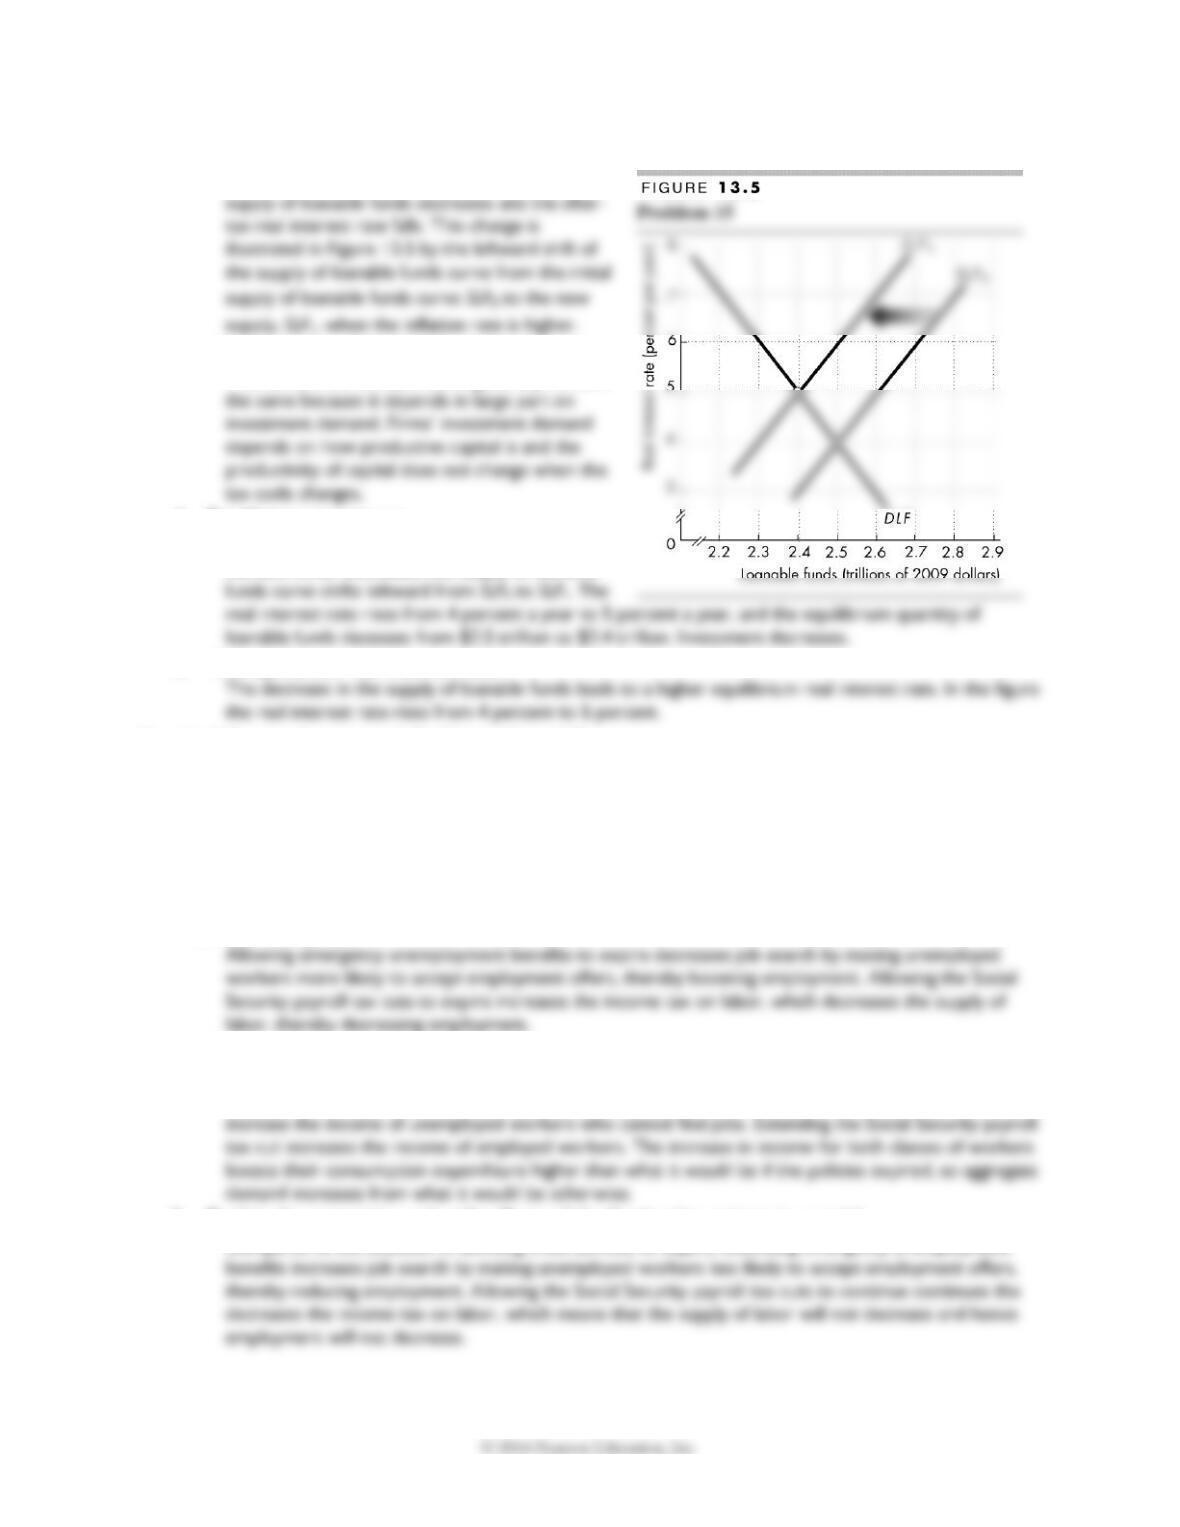
As illustrated in Figure 13.5, when the supply of
loanable funds decreases, the supply of loanable
e. The equilibrium real interest rate.
Use the following data to work Problems 16 and 17.
Policy Changes Scheduled to Take Effect in 2013
A host of significant provisions of the Job Creation Act of 2010 are set to expire on January 1, 2013,
including the emergency unemployment benefits and a temporary reduction of 2 percentage points in
the Social Security payroll tax.
Source: The Congressional Budget Office, October 5, 2012
16. Explain the supply-side effects of allowing unemployment benefits and the Social Security payroll
tax cut to expire.
17. a. Explain the potential demand-side effects of extending unemployment benefits and not increasing
the Social Security payroll tax.
Compared to the situation of allowing these policies to expire, extending unemployment benefits will
b. Explain the potential supply-side effects of the fiscal policy actions in part (a).
Compared to the situation of allowing these policies to expire, extending emergency unemployment
1 7 6 C H A P T E R 1 3
c. Draw a graph to illustrate the combined demand-side and supply-side effect of the fiscal policy
actions in part (a).
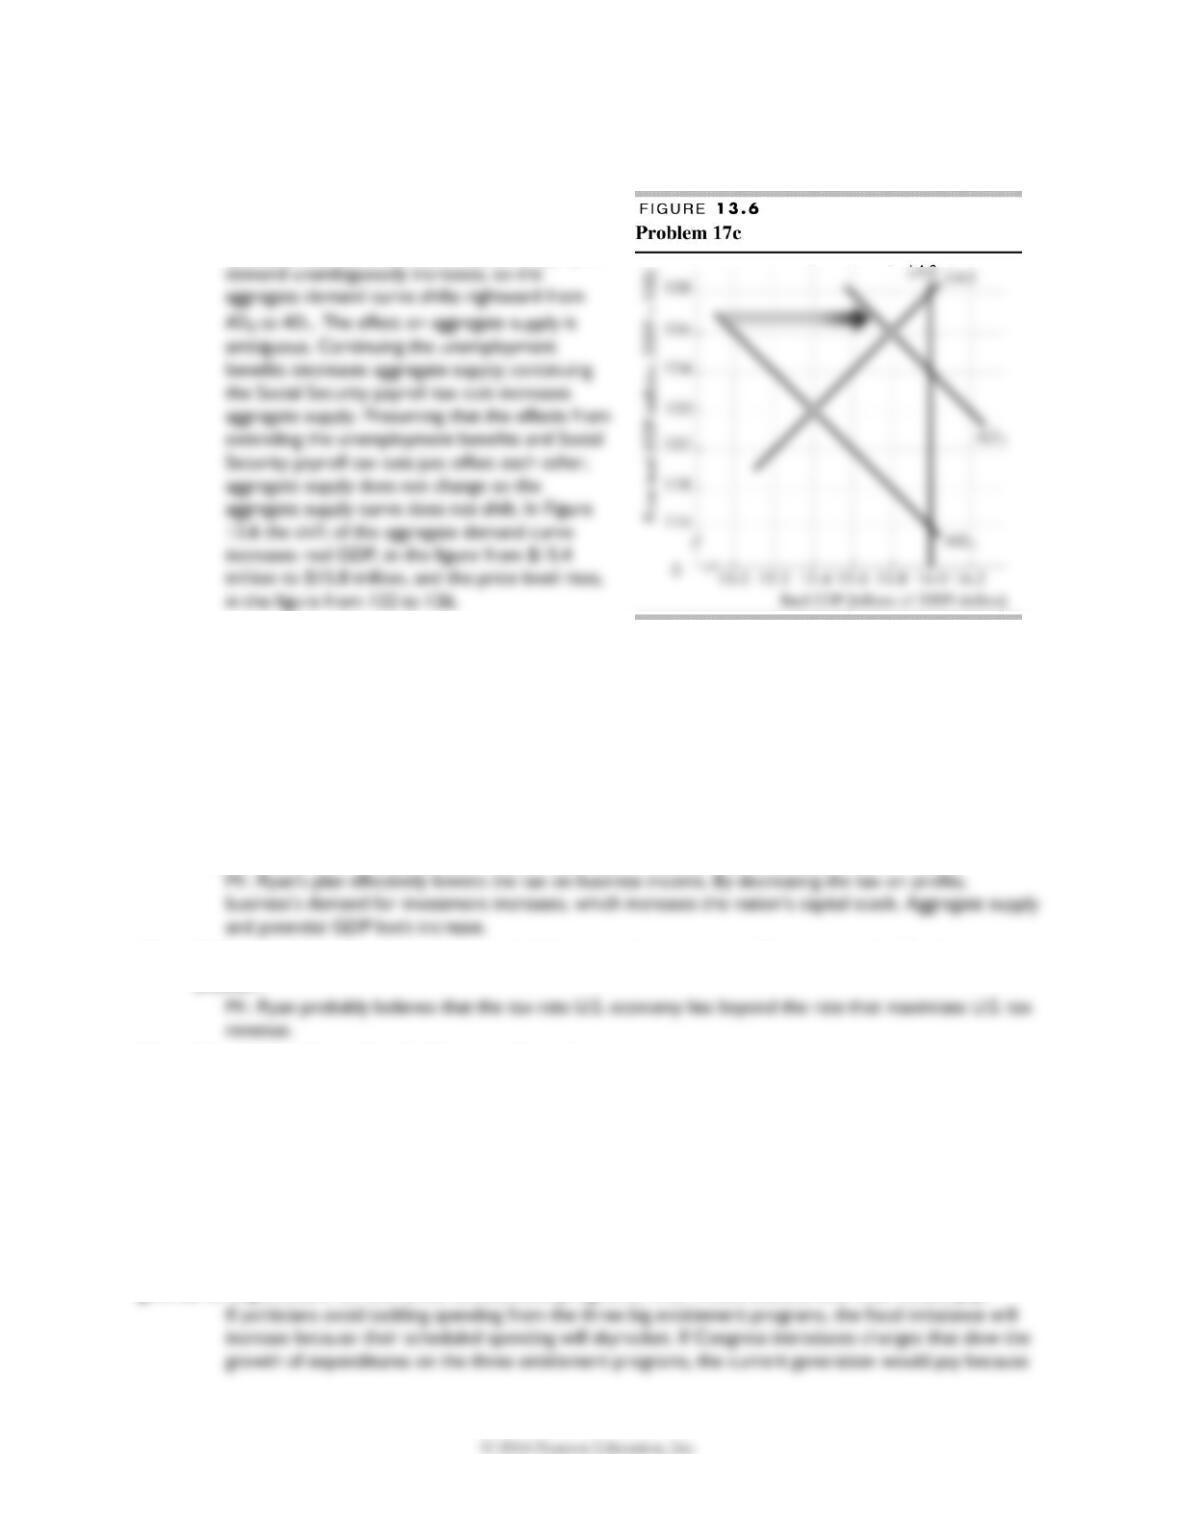
Figure 13.6 shows the combined effects of these
policies compared to what the situation would be
if the policies were allowed to expire. Aggregate
Use the following news clip to work Problems 18 and 19.
Paul Ryan’s Roadmap Business Tax
Paul Ryan has proposed replacing the corporate income tax, which is among the highest in the
industrialized world, with what he calls a business consumption tax but what is in effect a tax of a firm’s
value added. He proposes that this tax be set at 8.5 percent, which is half that of the value-added taxes
in the rest of the industrialized world.
Source: A Roadmap for America’s Future, http://roadmap.republicans.budget.house.gov/
18. Explain the potential supply-side effects of Paul Ryan’s tax plan.
19. Where on the Laffer curve do you think Paul Ryan believes the U.S. economy lies? Explain your
answer.
20. Mandatory Spending Is Hard to Contain
In Fiscal 2012, spending on the big three entitlement programs—Social Security, Medicare, and
Medicaid—was $2.1 trillion. The CBO baseline projection sees this expenditure rising by 70 percent to
$3.55 trillion by 2022. Over that same period, discretionary expenditure, mainly national defense, is
projected to grow by only 17 percent from $1.2 trillion to $1.4 trillion. The deficit is projected to fall
from $1 trillion to $200 billion.
Source: Congressional Budget Office, 2012
If politicians continue to avoid debating the projected increases in the three big entitlement programs,
how do you think the fiscal imbalance will change? If Congress introduced changes that slowed the
growth of expenditure on the three entitlement programs, who would benefit and who would pay?
21. The economy is in a boom and the inflationary gap is large.
a. Describe the discretionary and automatic fiscal policy actions that might occur.
b. Describe a discretionary fiscal restraint package that could be used that would not produce
serious negative supply-side effects.
c. Explain the risks of discretionary fiscal policy in this situation.
22. The economy is growing slowly, the inflationary gap is large, and there is a budget deficit.
a. Do we know whether the budget deficit is structural or cyclical? Explain your answer.
b. Do we know whether automatic stabilizers are increasing or decreasing aggregate demand?
Explain your answer.
c. If a discretionary decrease in government expenditure occurs, what happens to the structural
budget balance? Explain your answer.
Use the following news clip to work Problems 23 to 25.
Is Fiscal Stimulus Necessary?
China’s economy is slowing from its normal 9 percent or higher rate to just below 9 percent. The
source of the slowdown is the global economic slowdown that is restricting exports growth and the
government’s deliberate decision to discourage unproductive investment. The situation now is not like
that in 2008 when real GDP growth dropped from 9 percent to 6.8 percent and fiscal stimulus does not
appear to be urgently needed.
Source: China Daily, June 8, 2012
23. Explain why fiscal stimulus was needed in 2008 but not in 2012.
24. Would you expect automatic stabilizers to be operating in 2012 and if so, what effects might they
have?
25. Why might a stimulus come too late? What are the potential consequences of a stimulus coming
too late?
Stimulus might come too late because forecasters’ predictions that the slowdown in China’s growth will
Economics in the News
26. After you have studied Reading Between the Lines on pp. 342–343 (750–751 in Economics), answer
the following questions.
a. What was the state of the Japanese economy in 2013?
b. Explain the effects of Japan’s high level of government spending and debt the level of
employment and potential GDP.
c. Explain how inflation and faster growth might lower Japan’s government debt ratio and why
neither is an attractive option.
Increasing either inflation or faster growth reduces the ratio of debt to nominal GDP. Faster growth is
F I S C A L P O L I C Y 1 7 9
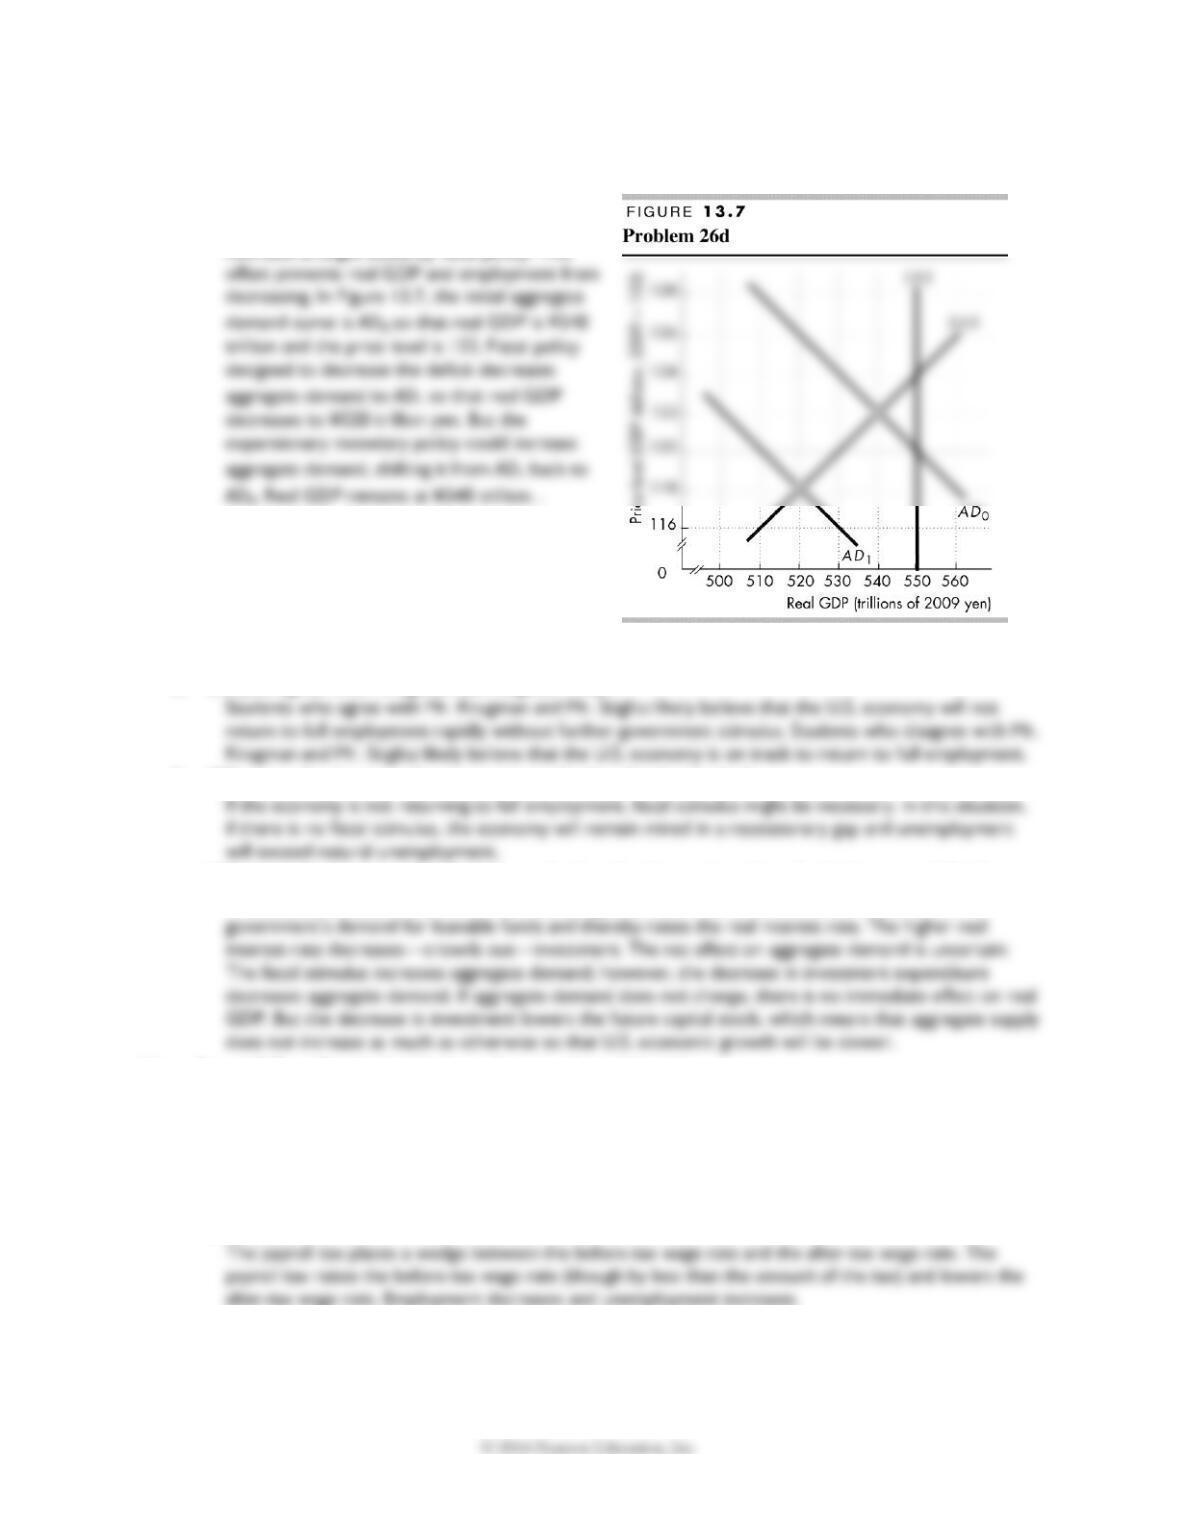
d. Explain how monetary policy might be used to offset a fiscal-policy induced decrease in
aggregate demand and draw a graph to illustrate your answer.
Monetary policy can be used to increase
aggregate demand, thereby offsetting the
decrease brought about by fiscal policy. This
27. More Fiscal Stimulus Needed?
In New York Times articles and in blogs, economists
Paul Krugman and Joseph Stiglitz say there is a need
for more fiscal stimulus in both the United States and
Europe despite the large federal budget deficit and
large deficits in some European countries.
a. Do you agree with Krugman and Stiglitz? Why?
b. What are the dangers of not engaging in further fiscal stimulus?
c. What are the dangers of embarking on further fiscal stimulus when the budget is in deficit?
The fiscal stimulus will further increase the budget deficit. The rise in the deficit increases the
28. Payroll Tax Cut Is Unlikely to Survive Into Next Year
The payroll tax holiday in 2012 reduced workers’ tax by $700 for an income of $35,000 a year and by
$2,202 for incomes of $110,100 and over. If the tax holiday ends, the Economic Policy Institute
recommends replacing the payroll tax cut with infrastructure spending.
Source: The New York Times, September 30, 2012
a. Explain how a payroll tax affects the before-tax and after-tax wage rate and employment and
unemployment.
after-tax wage rate. Employment decreases and unemployment increases.
b. Explain the effects of an increase in infrastructure spending on employment and unemployment.
In the short-run, an increase in infrastructure increases aggregate demand, which increases real GDP
and thereby increases employment and decreases unemployment. In the longer-run, an increase in
1 8 0 C H A P T E R 1 3
c. Which fiscal policy action would have the bigger effect on employment: continuing the payroll
tax cut or new infrastructure spending?