Unlock document.
This document is partially blurred.
Unlock all pages and 1 million more documents.
Get Access
Chapter 13 - Fiscal Policy, Deficits, and Debt
13-1
Chapter 13 Fiscal Policy, Deficits, and Debt
QUESTIONS
1. What is the role of the Council of Economic Advisers (CEA) as it relates to fiscal policy? Use
an Internet search to find the names and university affiliations of the present members of the
CEA. LO1
Answer: The CEA advises the President on economic matters, and provides
2. What are government’s fiscal policy options for ending severe demand-pull inflation? Which
of these fiscal options do you think might be favored by a person who wants to preserve the size
of government? A person who thinks the public sector is too large? How does the “ratchet effect”
affect anti-inflationary fiscal policy? LO1
Answer: Options are to reduce government spending, increase taxes, or some
combination of both. See Figure 30.2. If the price level is flexible downward, it will fall.
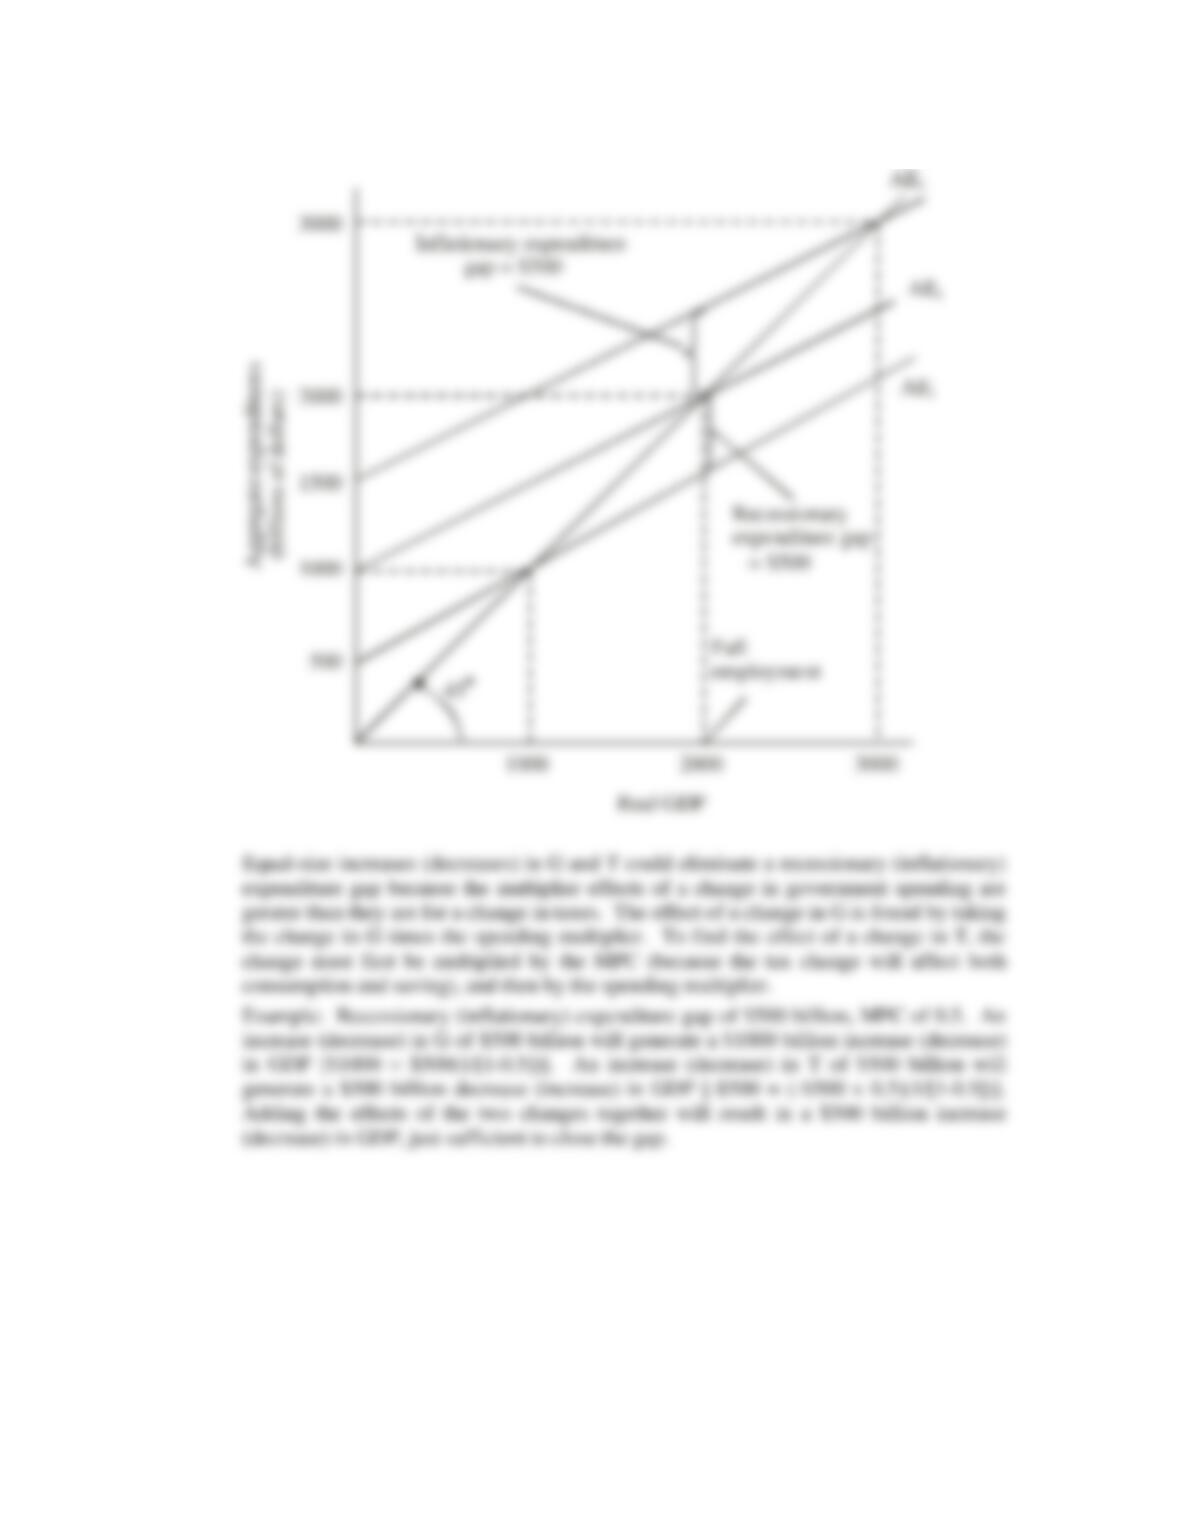
3. (For students who were assigned Chapter 28) Use the aggregate expenditures model to show
how government fiscal policy could eliminate either a recessionary expenditure gap or an
inflationary expenditure gap (Figure 28.7). Explain how equal-size increases in G and T could
eliminate a recessionary gap and how equal-size decreases in G and T could eliminate an
inflationary gap. LO1
Answer: Consider the figure below. At AE2 there is an inflationary expenditure gap of
$500 (assuming full-employment output is $2000). The fiscal authority could increase
Chapter 13 - Fiscal Policy, Deficits, and Debt
13-2
4. Some politicians have suggested that the United States enact a constitutional amendment
requiring that the Federal government balance its budget annually. Explain why such an
amendment, if strictly enforced, would force the government to enact a contractionary fiscal
policy whenever the economy experienced a severe recession. LO1
Chapter 13 - Fiscal Policy, Deficits, and Debt
13-3
Answer: When the economy enters a recession, net tax revenue falls. Specifically,
revenues from income and excise taxes decline as unemployment rises and consumer
5. Briefly state and evaluate the problem of time lags in enacting and applying fiscal policy.
Explain the idea of a political business cycle. How might expectations of a near-term policy
reversal weaken fiscal policy based on changes in tax rates? What is the crowding-out effect, and
why might it be relevant to fiscal policy? In view of your answers, explain the following
statement: “Although fiscal policy clearly is useful in combating the extremes of severe recession
and demand-pull inflation, it is impossible to use fiscal policy to fine-tune the economy to the
full-employment, noninflationary level of real GDP and keep the economy there indefinitely.”
LO1
Answer: It takes time to ascertain the direction in which the economy is moving
(recognition lag), to get a fiscal policy enacted into law (administrative lag); and for the
Chapter 13 - Fiscal Policy, Deficits, and Debt
13-4
6. Explain how built-in (or automatic) stabilizers work. What are the differences between
proportional, progressive, and regressive tax systems as they relate to an economy’s built-in
stability? LO2
Answer: In a phrase, “net tax revenues vary directly with GDP.” When GDP is rising so
are tax collections, both income taxes and sales taxes. At the same time, government
payouts—transfer payments such as unemployment compensation, and welfare—are
decreasing. Since net taxes are taxes less transfer payments, net taxes definitely rise with
7. Define the cyclically-adjusted budget, explain its significance, and state why it may differ from
the actual budget. Suppose the full-employment, noninflationary level of real output is GDP3 (not
GDP2) in the economy depicted in Figure 30.3. If the economy is operating at GDP2, instead of
GDP3, what is the status of its cyclically-adjusted budget? The status of its current fiscal policy?
What change in fiscal policy would you recommend? How would you accomplish that in terms of
the G and T lines in the figure? LO3
Chapter 13 - Fiscal Policy, Deficits, and Debt
13-5
Answer: The cyclically-adjusted budget measures what the Federal deficit or surplus
would be if the economy reached full-employment level of GDP with existing tax and
spending policies. If the cyclically-adjusted budget is balanced, then the government is
8. How do economists distinguish between the absolute and relative sizes of the public debt? Why
is the distinction important? Distinguish between refinancing the debt and retiring the debt. How
does an internally held public debt differ from an externally held public debt? Contrast the effects
of retiring an internally held debt and retiring an externally held debt. LO4
Answer: There are two ways of measuring the public debt: (1) measure its absolute
dollar size; (2) measure its relative size as a percentage of GDP. The distinction is
important because the absolute size doesn’t tell you about an economy’s capacity to
9. True or false? If false, explain why. LO4
a. The total public debt is more relevant to an economy than the public debt as a percentage of
GDP.
b. An internally held public debt is like a debt of the left hand owed to the right hand.
c. The Federal Reserve and Federal government agencies hold more than three-fourths of the
public debt.
d. The portion of the U.S. debt held by the public (and not by government entities) was larger as a
percentage of GDP in 2009 than it was in 2000.
Chapter 13 - Fiscal Policy, Deficits, and Debt
13-6
e. As a percentage of GDP, the total U.S. public debt is the highest such debt among the world's
advanced industrial nations.
Answer: (a) False. See question 30-8.
10. Why might economists be quite concerned if the annual interest payments on the U.S. public
debt sharply increased as a percentage of GDP? LO4
Answer: The weight of the debt is not its absolute size. Indeed, if there were no interest
to be paid on the debt and refinancing were automatic, there would be no debt-load at all.
11. Trace the cause-and-effect chain through which financing and refinancing of the public debt
might affect real interest rates, private investment, the stock of capital, and economic growth.
How might investment in public capital and complementarities between public capital and private
capital alter the outcome of the cause-effect chain? LO4
Answer: Cause and effect chain: Government borrowing to finance the debt competes
with private borrowing and drives up the interest rate; the higher interest rate causes a
12. LAST WORD What do economists mean when they say Social Security and Medicare are
"pay-as-you-go" plans? What are the Social Security and Medicare trust funds, and how long will
they have money left in them? What is the key long-run problem of both Social Security and
Medicare? Do you favor increasing taxes or do you prefer reducing benefits to fix the problem?
Answer: Social Security and Medicare are largely an annual “pay-as-you-go” plan,
Chapter 13 - Fiscal Policy, Deficits, and Debt
13-7
PROBLEMS
1. Assume that a hypothetical economy with an MPC of .8 is experiencing severe recession. By
how much would government spending have to rise to shift the aggregate demand curve
rightward by $25 billion? How large a tax cut would be needed to achieve the same increase in
aggregate demand? Determine one possible combination of government spending increases and
tax increases that would accomplish the same goal without changing the amount of outstanding
Feedback: Consider the following example. Assume that a hypothetical economy with
an MPC of .8 is experiencing severe recession.
By how much would government spending have to rise to shift the aggregate demand
curve rightward by $25 billion?
The first step is to find the expenditure multiplier.
expenditure multiplier = 1/(1-MPC) = 1/(1-0.8) = 1/0.2 = 5
The second step is to find the change in government spending required to shift the
Chapter 13 - Fiscal Policy, Deficits, and Debt
13-8
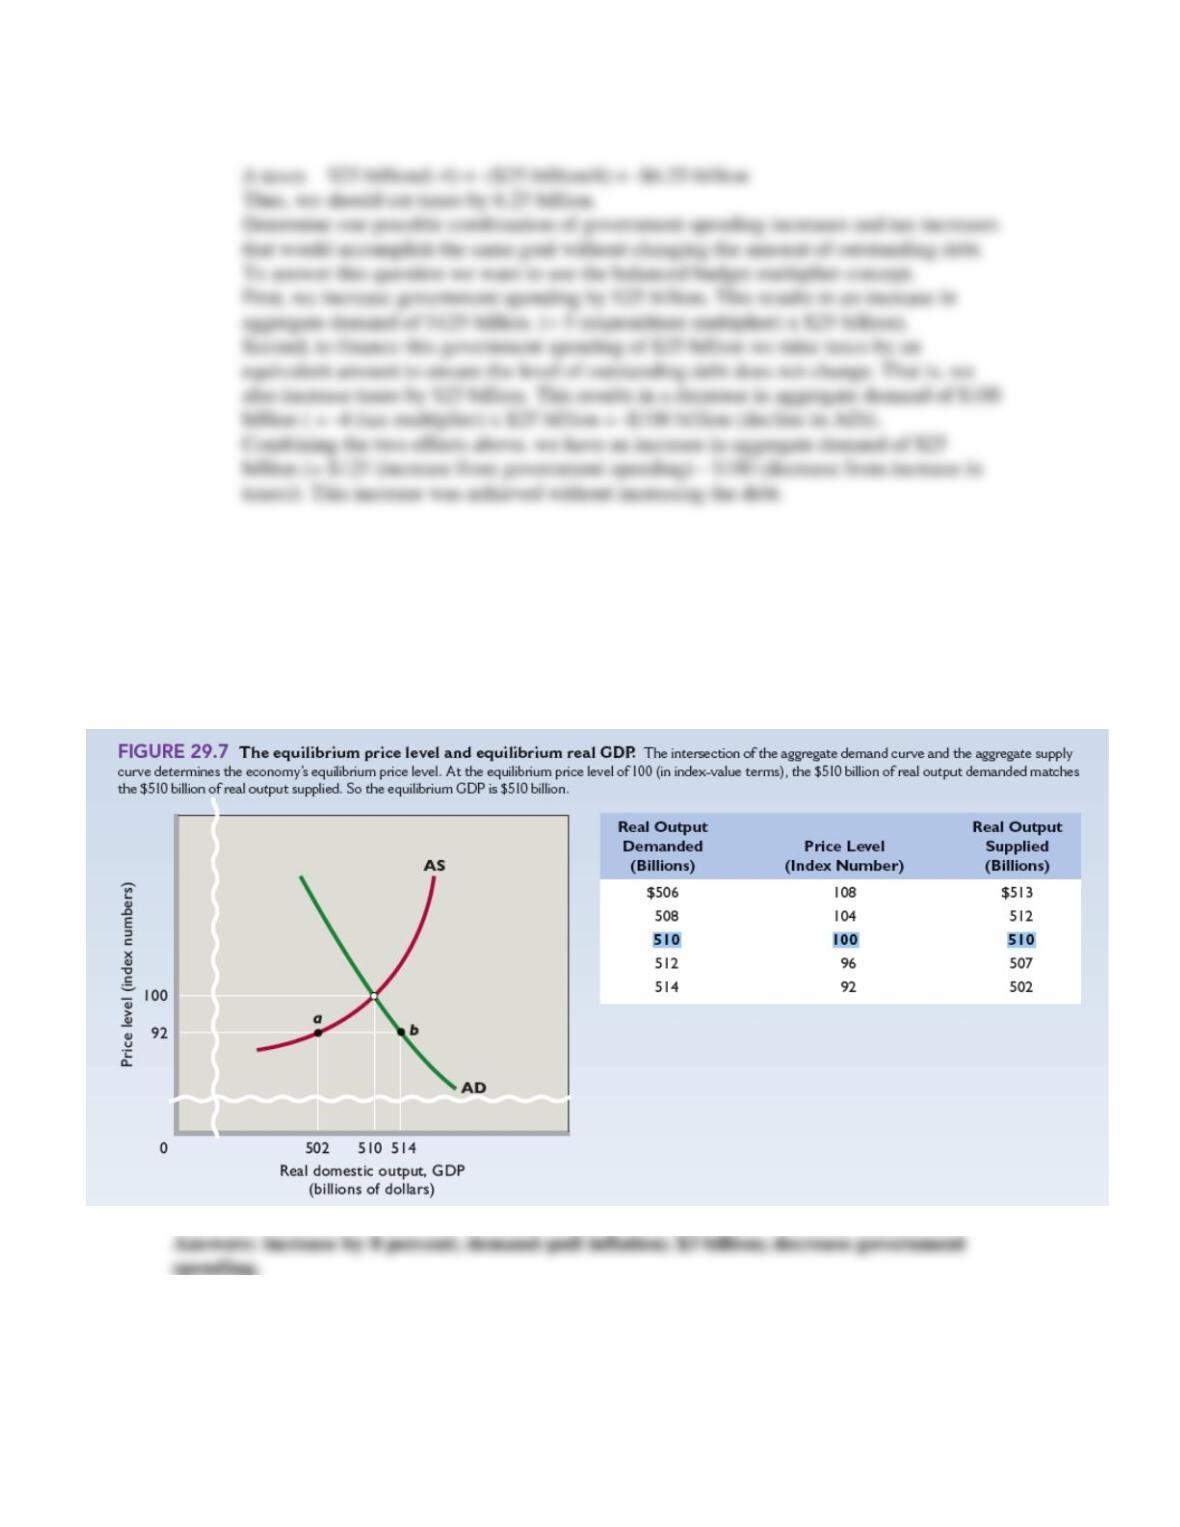
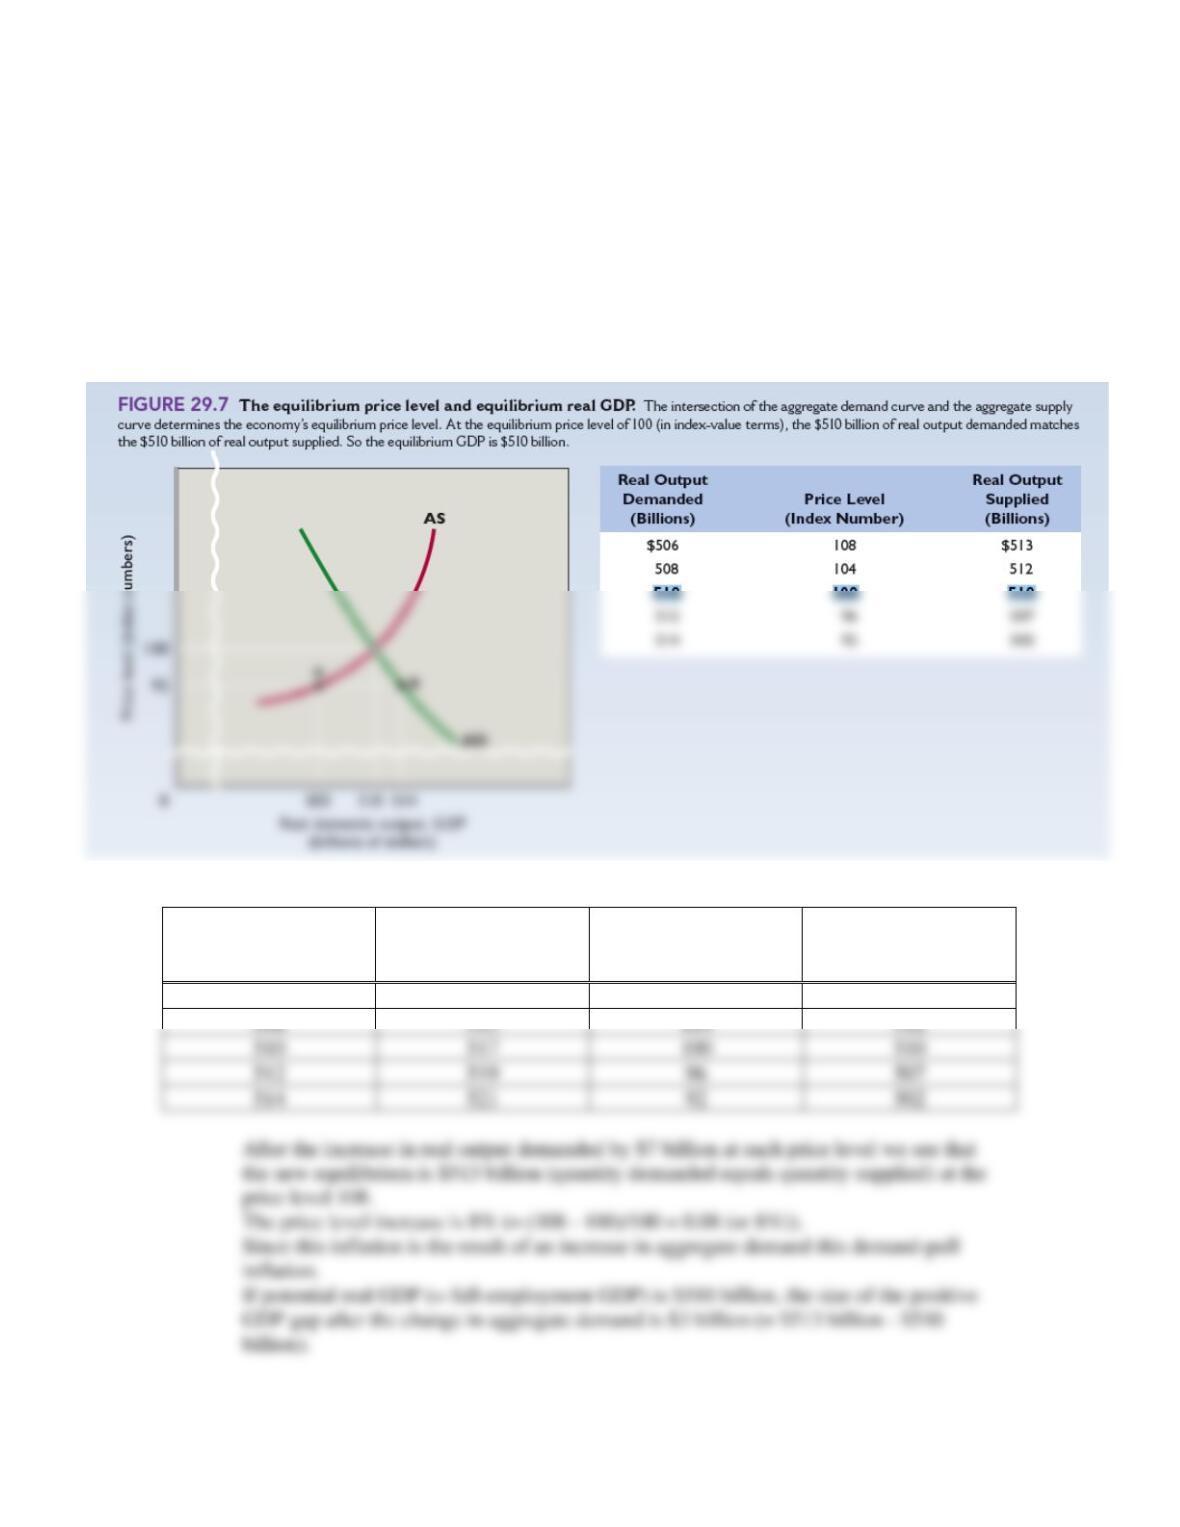
2. Refer back to the table in Figure 29.7 in the previous chapter. Suppose that aggregate demand
increases such that the amount of real output demanded rises by $7 billion at each price level. By
what percent will the price level increase? Will this inflation be demand-pull inflation or will it be
cost-push inflation? If potential real GDP (that is, full-employment GDP) is $510 billion, what
will be the size of the positive GDP gap after the change in aggregate demand? If government
wants to use fiscal policy to counter the resulting inflation without changing tax rates, would it
increase government spending or decrease it? LO1
Chapter 13 - Fiscal Policy, Deficits, and Debt
13-9
Feedback: Consider the following example. Refer to the table and figure below. Suppose
that aggregate demand increases such that the amount of real output demanded rises by
$7 billion at each price level. By what percent will the price level increase? Will this
inflation be demand-pull inflation or will it be cost-push inflation? If potential real GDP
(= full-employment GDP) is $510 billion, what will be the size of the positive GDP after
the change in aggregate demand? If government wants to use fiscal policy to counter the
resulting inflation without changing tax rates, would it increase government spending or
decrease it?
Real Output
Demanded
(ORIGINAL)
Real Output
Demanded
(NEW)
Price Level
Real Output
Supplied
$506
$513
108
$513
Chapter 13 - Fiscal Policy, Deficits, and Debt
13-10
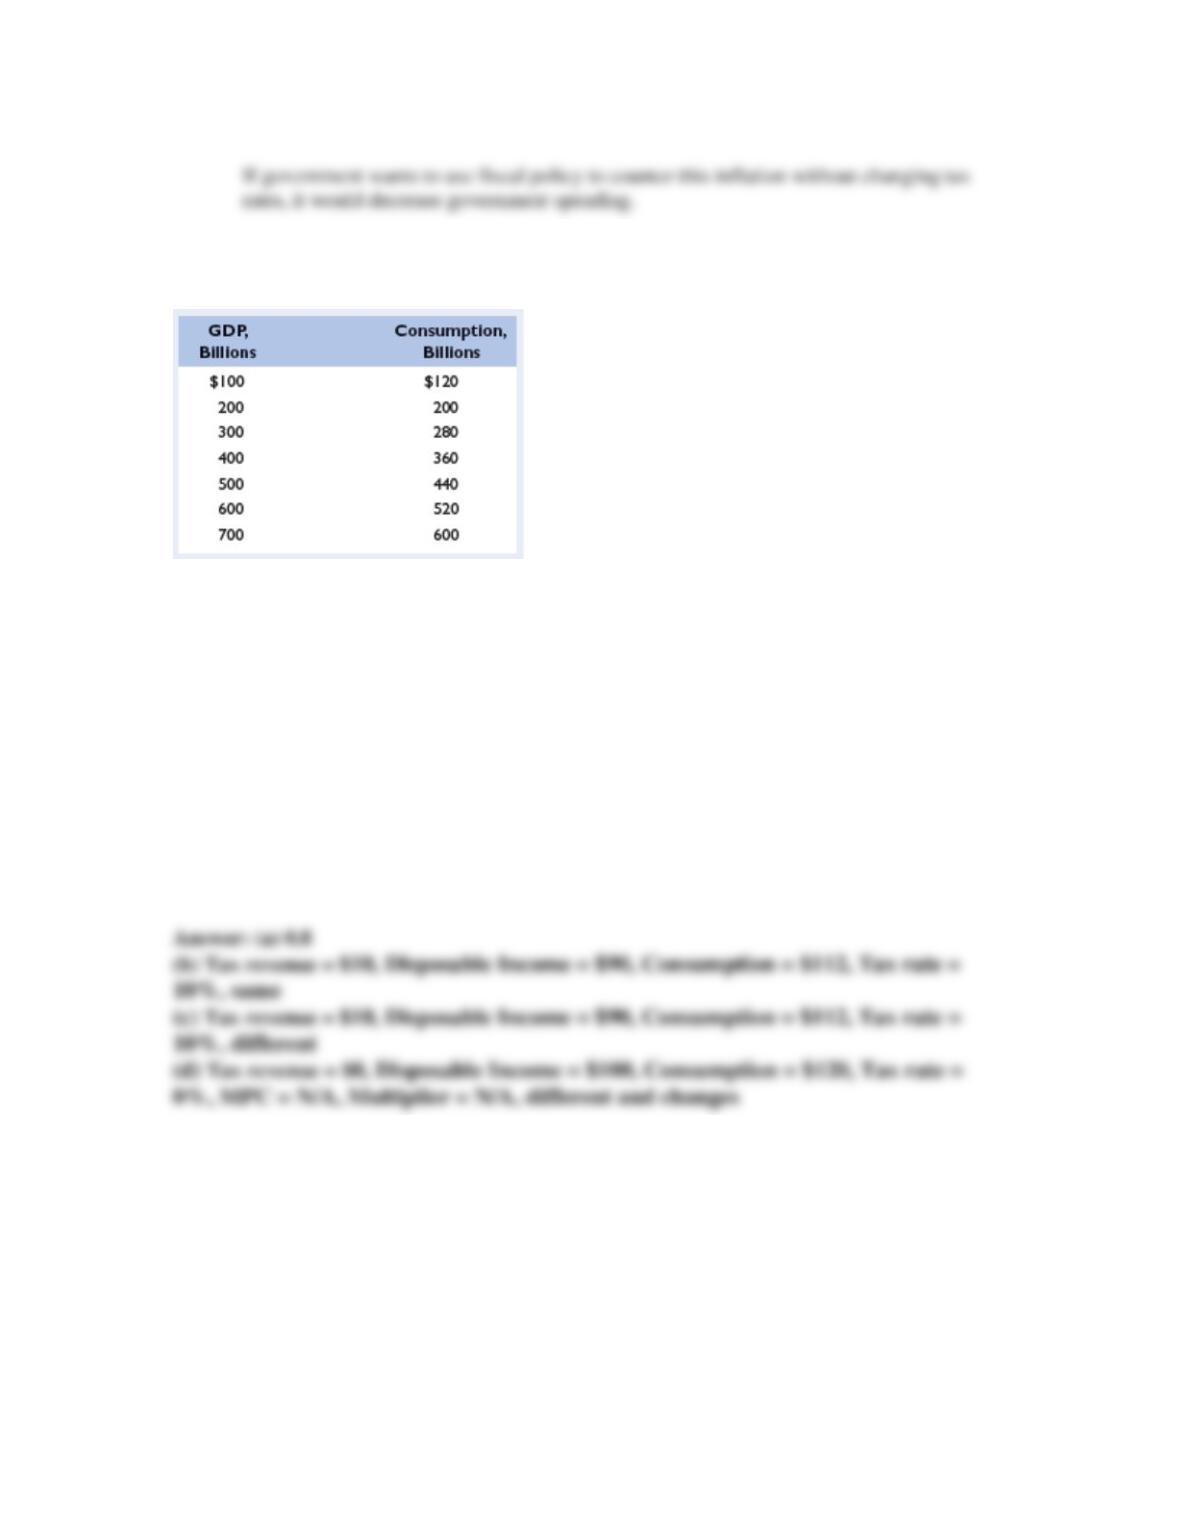
3. (For students who were assigned Chapter 28) Assume that, without taxes, the consumption
schedule for an economy is as shown below: LO1
a. Graph this consumption schedule. What is the size of the MPC?
b. Assume that a lump-sum (regressive) tax of $10 billion is imposed at all levels of GDP.
Calculate the tax rate at each level of GDP. Graph the resulting consumption schedule and
compare the MPC and the multiplier with those of the pretax consumption schedule.
c. Now suppose a proportional tax with a 10 percent tax rate is imposed instead of the regressive
tax. Calculate and graph the new consumption schedule and note the MPC (tax inclusive) and the
multiplier.
d. Finally, impose a progressive tax such that the tax rate is 0 percent when GDP is $100, 5
percent at $200, 10 percent at $300, 15 percent at $400, and so forth. Determine and graph the
new consumption schedule, noting the effect of this tax system on the MPC (tax inclusive) and
the multiplier.
e. Use a graph similar to Figure 30.3 to show why proportional and progressive taxes contribute
to greater economic stability, while a regressive tax does not.
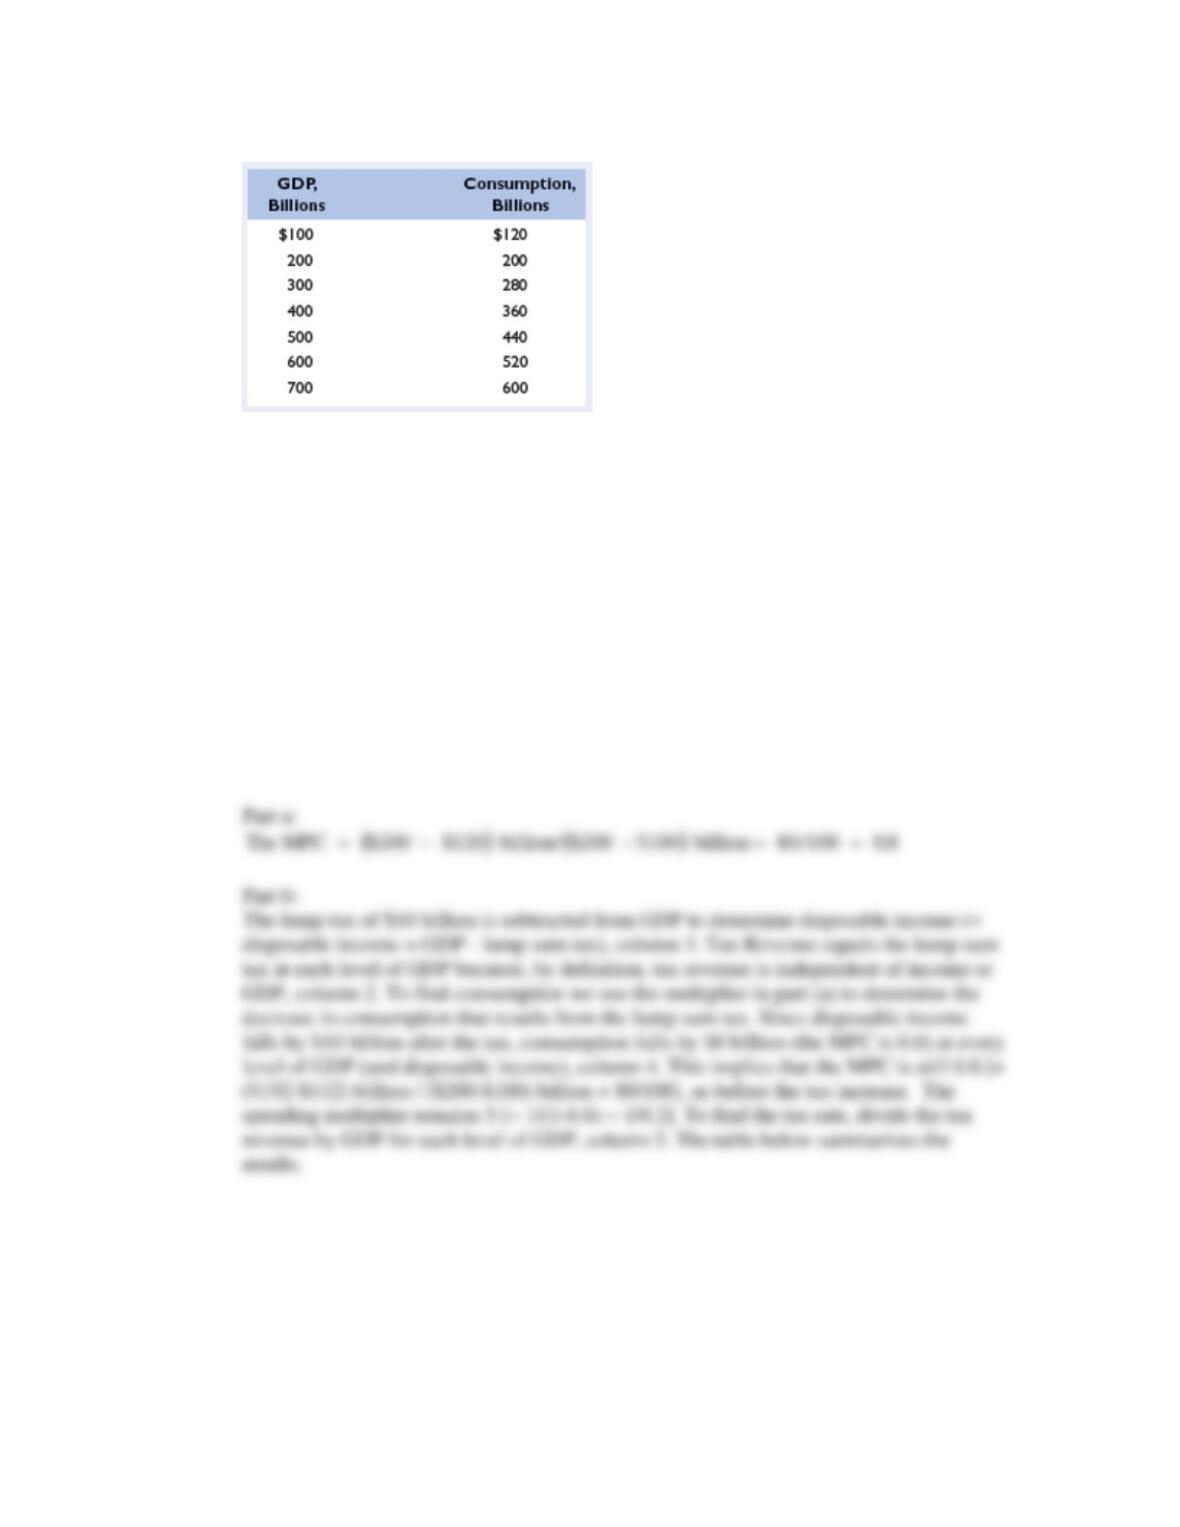
Feedback: Consider the following example. . (For students who were assigned Chapter
28) Assume that, without taxes, the consumption schedule for an economy is as shown
below:
Chapter 13 - Fiscal Policy, Deficits, and Debt
13-11
a. Graph this consumption schedule. What is the size of the MPC?
b. Assume that a lump-sum (regressive) tax of $10 billion is imposed at all levels of
GDP. Calculate the tax rate at each level of GDP. Graph the resulting consumption
schedule and compare the MPC and the multiplier with those of the pretax consumption
schedule.
c. Now suppose a proportional tax with a 10 percent tax rate is imposed instead of the
regressive tax. Calculate and graph the new consumption schedule and note the MPC (tax
inclusive) and the multiplier.
d. Finally, impose a progressive tax such that the tax rate is 0 percent when GDP is $100,
5 percent at $200, 10 percent at $300, 15 percent at $400, and so forth. Determine and
graph the new consumption schedule, noting the effect of this tax system on the MPC
(tax inclusive) and the multiplier.
e. Use a graph similar to Figure 30.3 to show why proportional and progressive taxes
contribute to greater economic stability, while a regressive tax does not.
Chapter 13 - Fiscal Policy, Deficits, and Debt
13-12
GDP,
billions
Tax,
billions
DI,
billions
Consumption
after tax
Tax rate,
percent
billions
$100
200
$10
10
$ 90
190
$112
192
10%
5.0
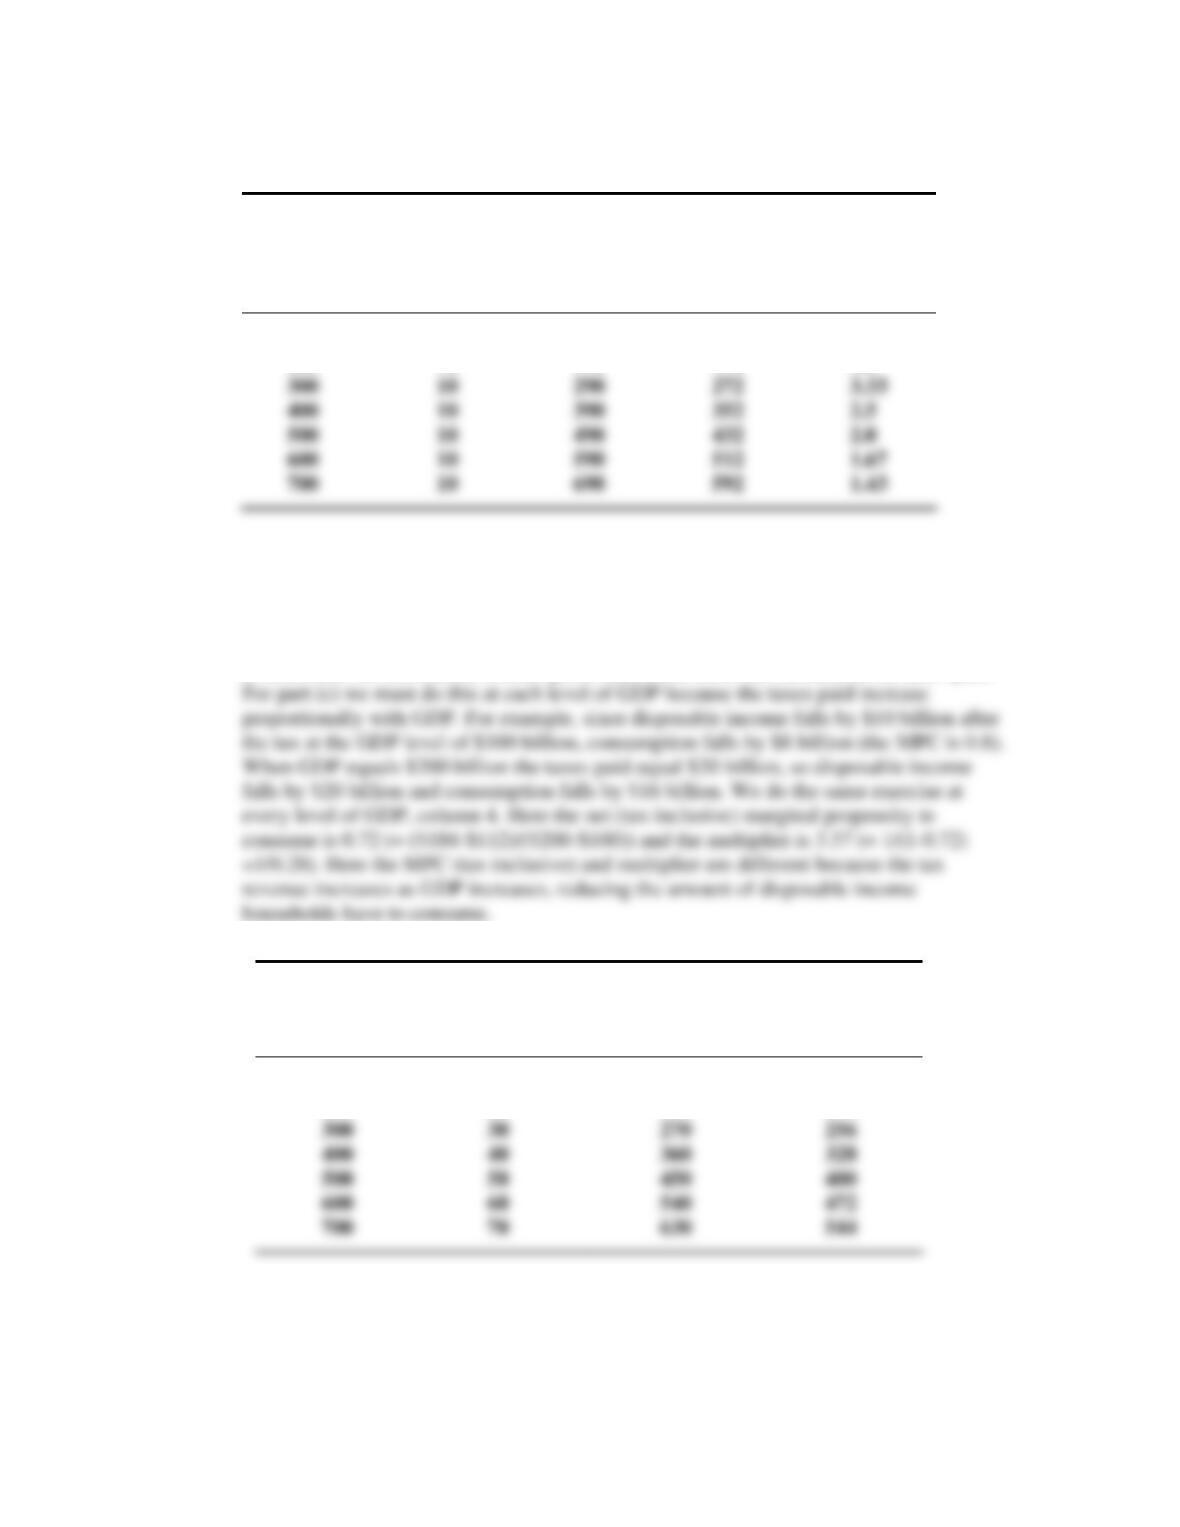
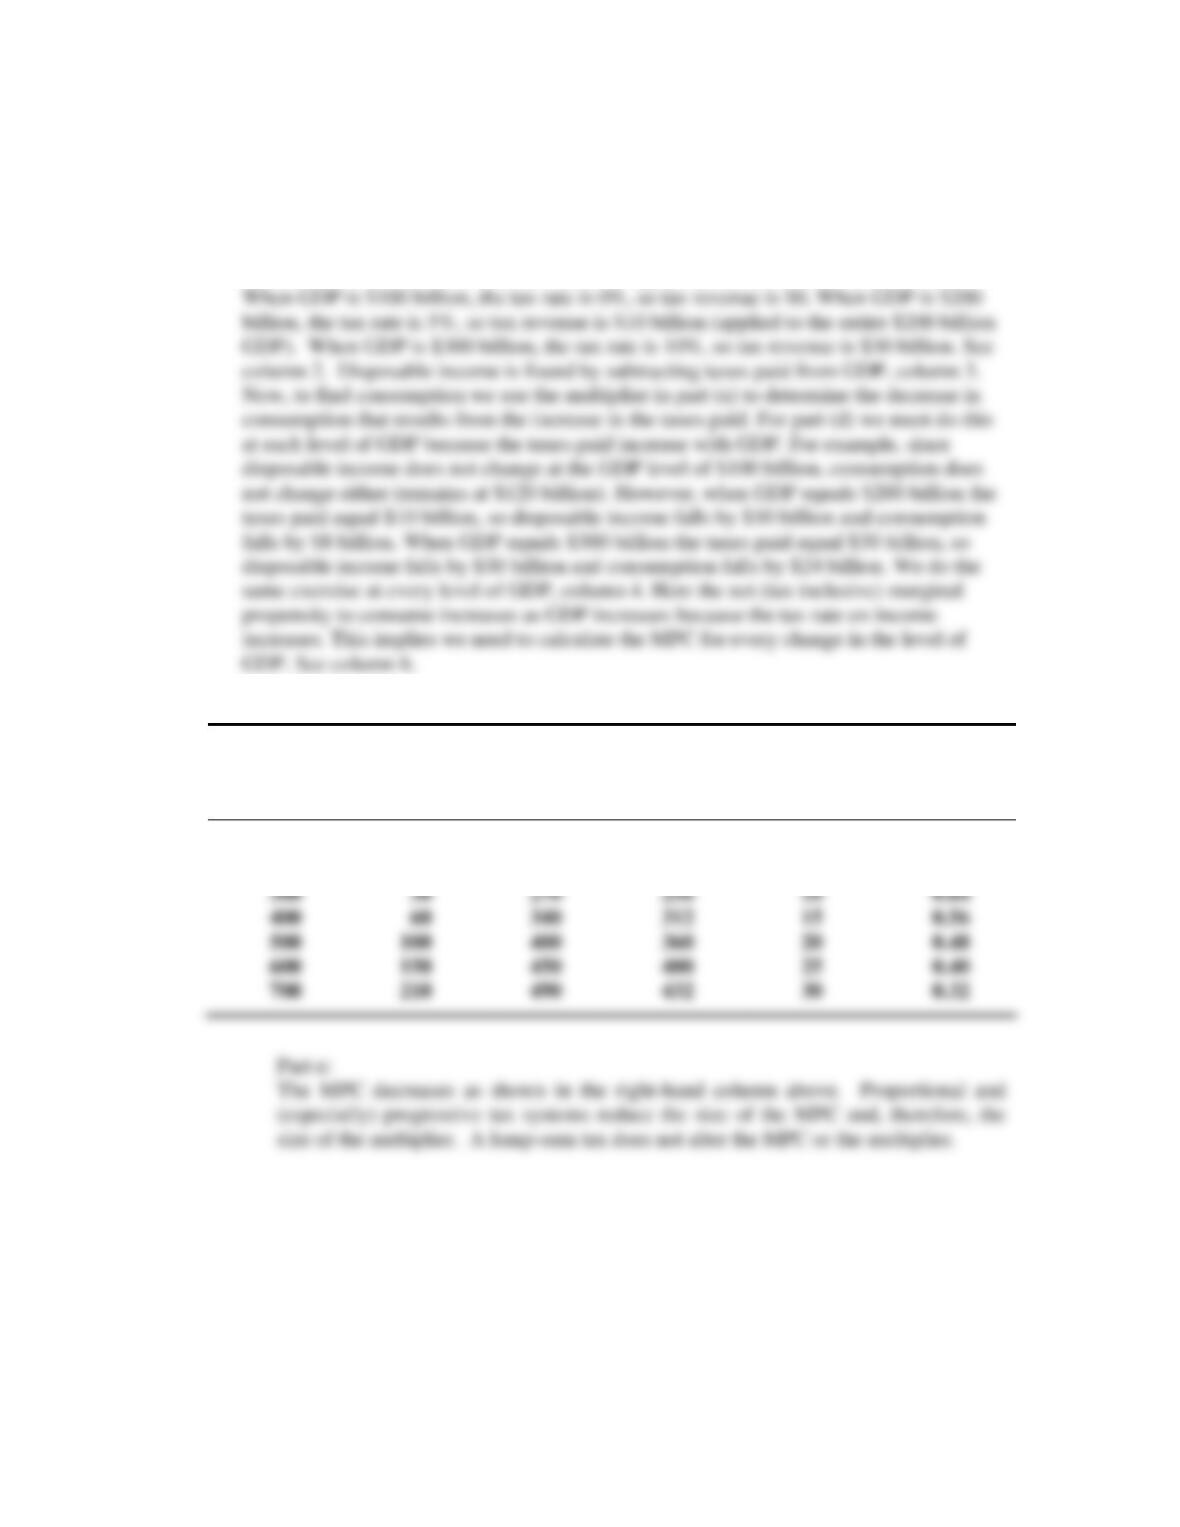
Part c:
With the 10% tax rate we find the tax revenue by taking 10% of GDP, column 2. We then
find disposable income by subtracting the tax revenue from GDP (disposable income =
GDP - tax revenue), column 3. Now, to find consumption we use the multiplier in part (a)
to determine the decrease in consumption that results from the increase in the taxes paid.
GDP,
billions
Tax,
billions
DIs
billions
Consumption
after tax,
billions
$100
200
$10
20
$90
180
$112
184
Part d:
Chapter 13 - Fiscal Policy, Deficits, and Debt
13-13
For this part of the problem we impose a progressive tax such that the tax rate is 0 percent
when GDP is $100, 5 percent at $200, 10 percent at $300, 15 percent at $400, and so
forth, column 5. Note that this tax structure is not a standard progressive tax system. The
tax rate is applied to all income at the different GDP and income levels rather than to the
incremental brackets. To find tax revenue we apply the tax rate at each level of GDP.
GDP
billions
Tax,
billions
DI,
billions
Consumption
after tax
Tax rate,
percent
billions
MPC
$100
200
$ 0
10
$100
190
$120
192
0%
5
0.72
Chapter 13 - Fiscal Policy, Deficits, and Debt
13-14
NOTE: For instructors who assign the graphs, the following would be true. For each
graph (a) through (d), plot the consumption schedule against the GDP. Graph (a) will
have a slope of .8 and will cross the 45 degree line at C = GDP = 200. Graph (b) is
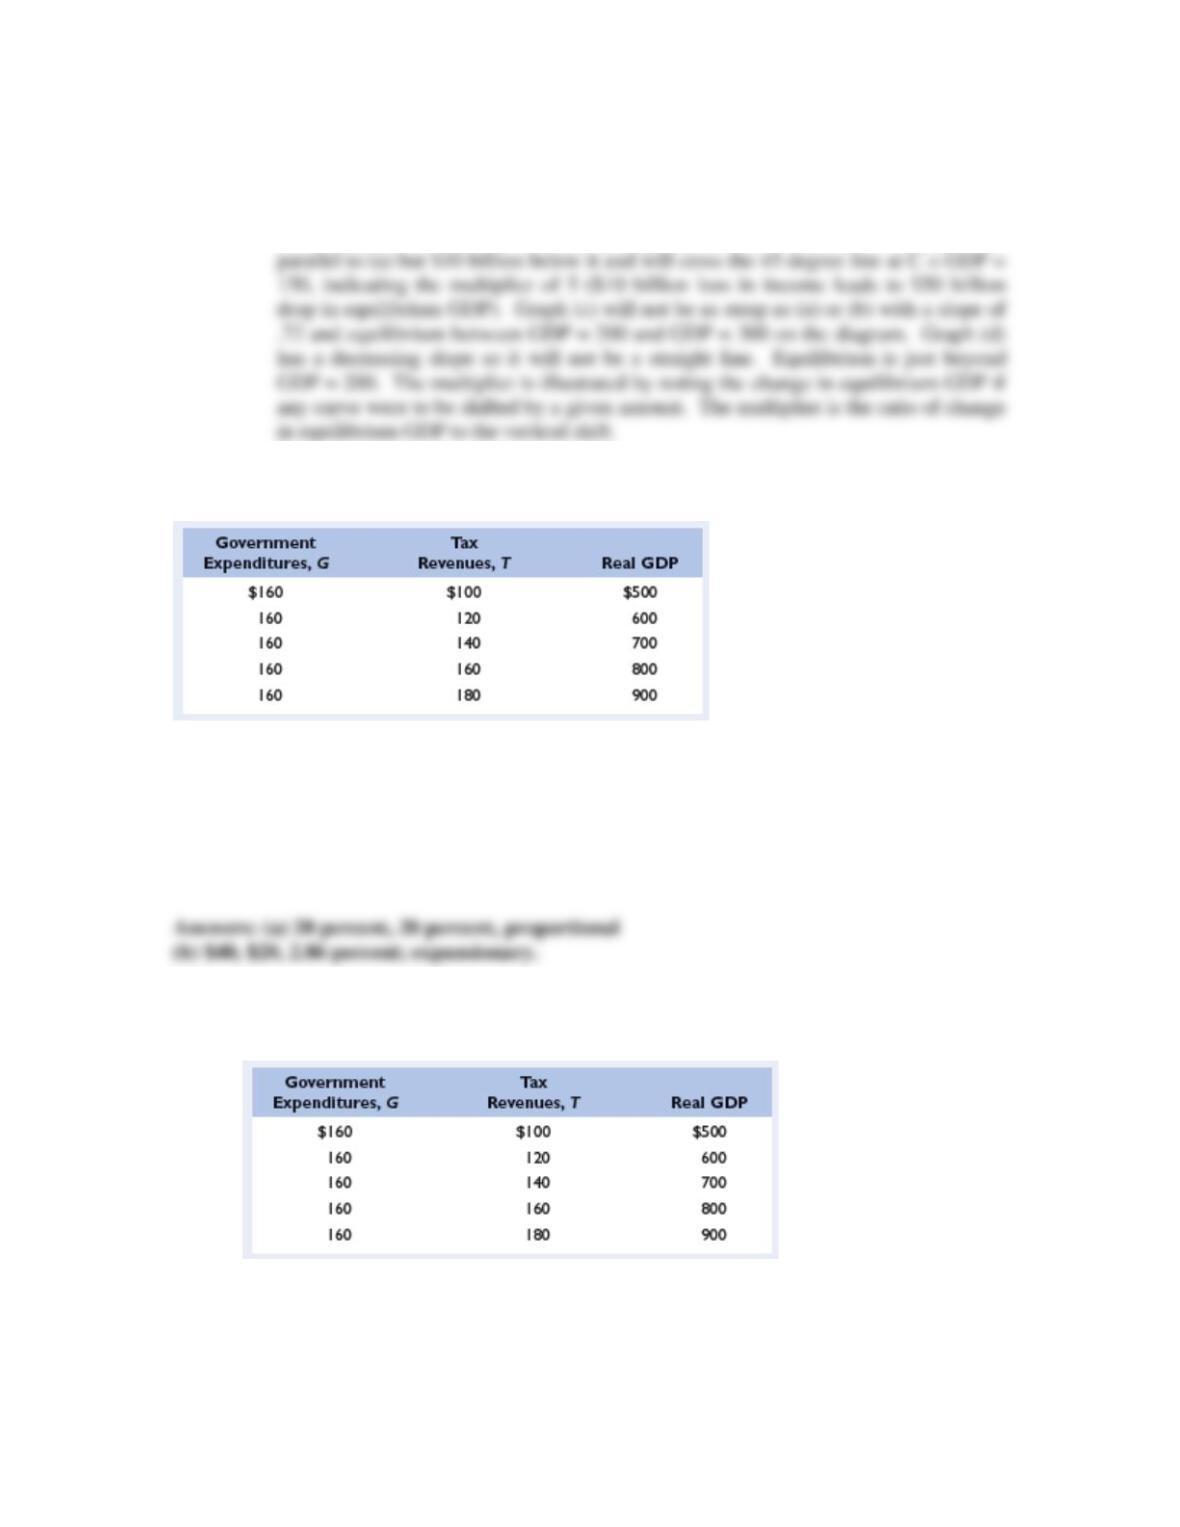
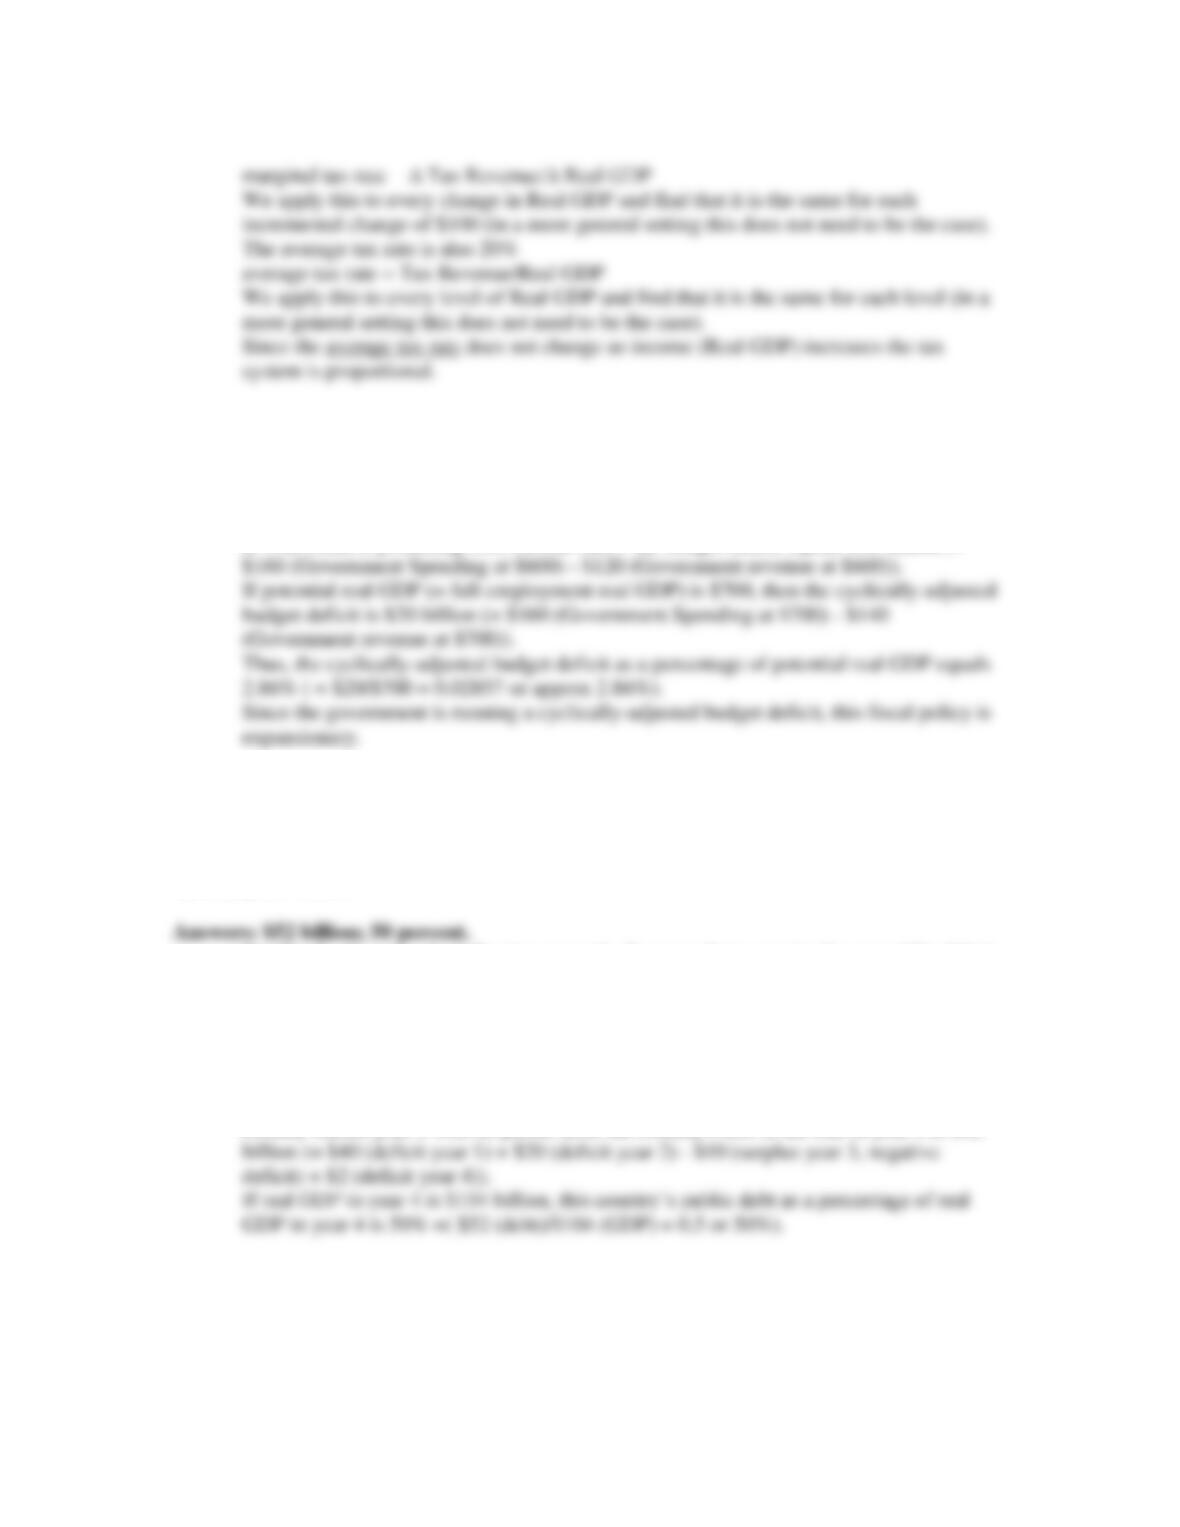
4. Refer to the accompanying table for Waxwania: L02, LO3
a. What is the marginal tax rate in Waxwania? The average tax rate? Which of the following
describes the tax system: proportional, progressive, regressive?
b. Suppose Waxwania is producing $600 of real GDP, whereas the potential real GDP (or full-
employment real GDP) is $700. How large is its budget deficit? Its cyclically-adjusted budget
deficit? Its cyclically-adjusted budget deficit as a percentage of potential real GDP? Is
Waxwania’s fiscal policy expansionary or is contractionary?
Feedback: Consider the following example. Refer to the accompanying table for
Waxwania: L02, LO3
Part a:
What is the marginal tax rate in Waxwania? The average tax rate? Which of the
following describes the tax system: proportional, progressive, regressive?
The marginal tax rate is 20%:
Chapter 13 - Fiscal Policy, Deficits, and Debt
13-15
Part b:
Suppose Waxwania is producing $600 of real GDP, whereas the potential real GDP (=
full-employment real GDP) is $700. How large is its budget deficit? Its cyclically-
adjusted budget deficit? Its cyclically-adjusted budget deficit as a percentage of potential
real GDP? Is Waxwania’s fiscal policy expansionary or is contractionary?
If Waxwania is producing $600 of real GDP, the budget deficit equals $40 billion (=
5. Suppose that a country has no public debt in year 1 but experiences a budget deficit of $40
billion in year 1, a budget deficit of $20 billion in year 2, a budget surplus of $10 billion in year 3,
and a budget deficit of $2 billion in year 4. What is the absolute size of its public debt in year 4?
If its real GDP in year 4 is $104 billion, what is this country’s public debt as a percentage of real
GDP in year 4? LO4
Feedback: Consider the following example. Suppose that a country has no public debt in
year 1 but experiences a budget deficit of $40 billion in year 1, a budget deficit of $20
billion in year 2, a budget surplus of $10 billion in year 3, and a budget deficit of $2
billion in year 4. What is the absolute size of its public debt in year 4? If its real GDP in
year 4 is $104 billion, what is this country’s public debt as a percentage of real GDP in
year 4?
Public debt is the sum of deficits and surpluses (negative deficits) over time. Since the
country started year 1 with no public debt, the country's debt at the end of year 4 is $52
Chapter 13 - Fiscal Policy, Deficits, and Debt
13-16
6. Suppose that the investment demand curve in a certain economy is such that investment
declines by $100 billion for every 1 percentage point increase in the real interest rate. Also,
suppose that the investment demand curve shifts rightward by $150 billion at each real interest
rate for every 1 percentage point increase in the expected rate of return from investment. If
stimulus spending (an expansionary fiscal policy) by government increases the real interest rate
by 2 percentage points, but also raises the expected rate of return on investment by 1 percentage
point, how much investment, if any, will be crowded out? LO4
Feedback: Consider the following example. Suppose that the investment demand curve
in a certain economy is such that investment declines by $100 billion for every 1
percentage point increase in the real interest rate. Also, suppose that the investment
demand curve shifts rightward by $150 billion at each real interest rate for every 1


