Questions for Review
1. In this chapter we looked at two models of the short-run aggregate supply curve. Both
models attempt to explain why, in the short run, output might deviate from its long-run
“natural rate”—the level of output that is consistent with the full employment of labor
and capital. Both models result in an aggregate supply function in which output devi-
ates from its natural rate Ywhen the price level deviates from the expected price level:
2. In this chapter, we argued that in the short run, the supply of output depends on the
natural rate of output and on the difference between the price level and the expected
price level. This relationship is expressed in the aggregate-supply equation:
Y= Y+ α(P–
E
P).
3. Inflation is inertial because of the way people form expectations. It is plausible to
assume that people’s expectations of inflation depend on recently observed inflation.
These expectations then influence the wages and prices that people set. For example, if
prices have been rising quickly, people will expect them to continue to rise quickly.
These expectations will be built into the contracts people set, so that actual wages and
prices will rise quickly. In addition, both the Phillips curve and the short-run aggregate
supply curve show that inflation and unemployment move in opposite directions.
144
CHAPTER 13 Aggregate Supply and the Short-Run
Tradeoff Between Inflation and
Unemployment
Chapter 13 Aggregate Supply 145
4. Demand-pull inflation results from high aggregate demand: the increase in demand
“pulls” prices and output up. Cost-push inflation comes from adverse supply shocks
that push up the cost of production—for example, the increases in oil prices in the mid-
5. The Phillips curve relates the inflation rate to the expected inflation rate and to the
difference between unemployment and its natural rate. So one way to reduce inflation
is to have a recession, raising unemployment above its natural rate. It is possible to
6. One way in which a recession might raise the natural rate of unemployment is by
affecting the process of job search, increasing the amount of frictional unemployment.
For example, workers who are unemployed lose valuable job skills. This reduces their
ability to find jobs after the recession ends because they are less desirable to firms.
Also, after a long period of unemployment, individuals may lose some of their desire to
work, and hence search less hard.
Problems and Applications
1. In this question, we examine two special cases of the sticky-price model developed in
this chapter. In the sticky-price model, all firms have a desired price pthat depends on
the overall level of prices Pas well as the level of aggregate demand Y– Y. We wrote
this as
p= P+ a(Y– Y).
The overall price level is a weighted average of the prices set by the two types of firms:
P= sEP + (1 – s)[P+ a(Y– Y)].
2. The economy has the Phillips curve:
π= π–1 –0.5(u– 0.06).
a. The natural rate of unemployment is the rate at which the inflation rate does not
deviate from the expected inflation rate. Here, the expected inflation rate is just
146 Answers to Textbook Questions and Problems
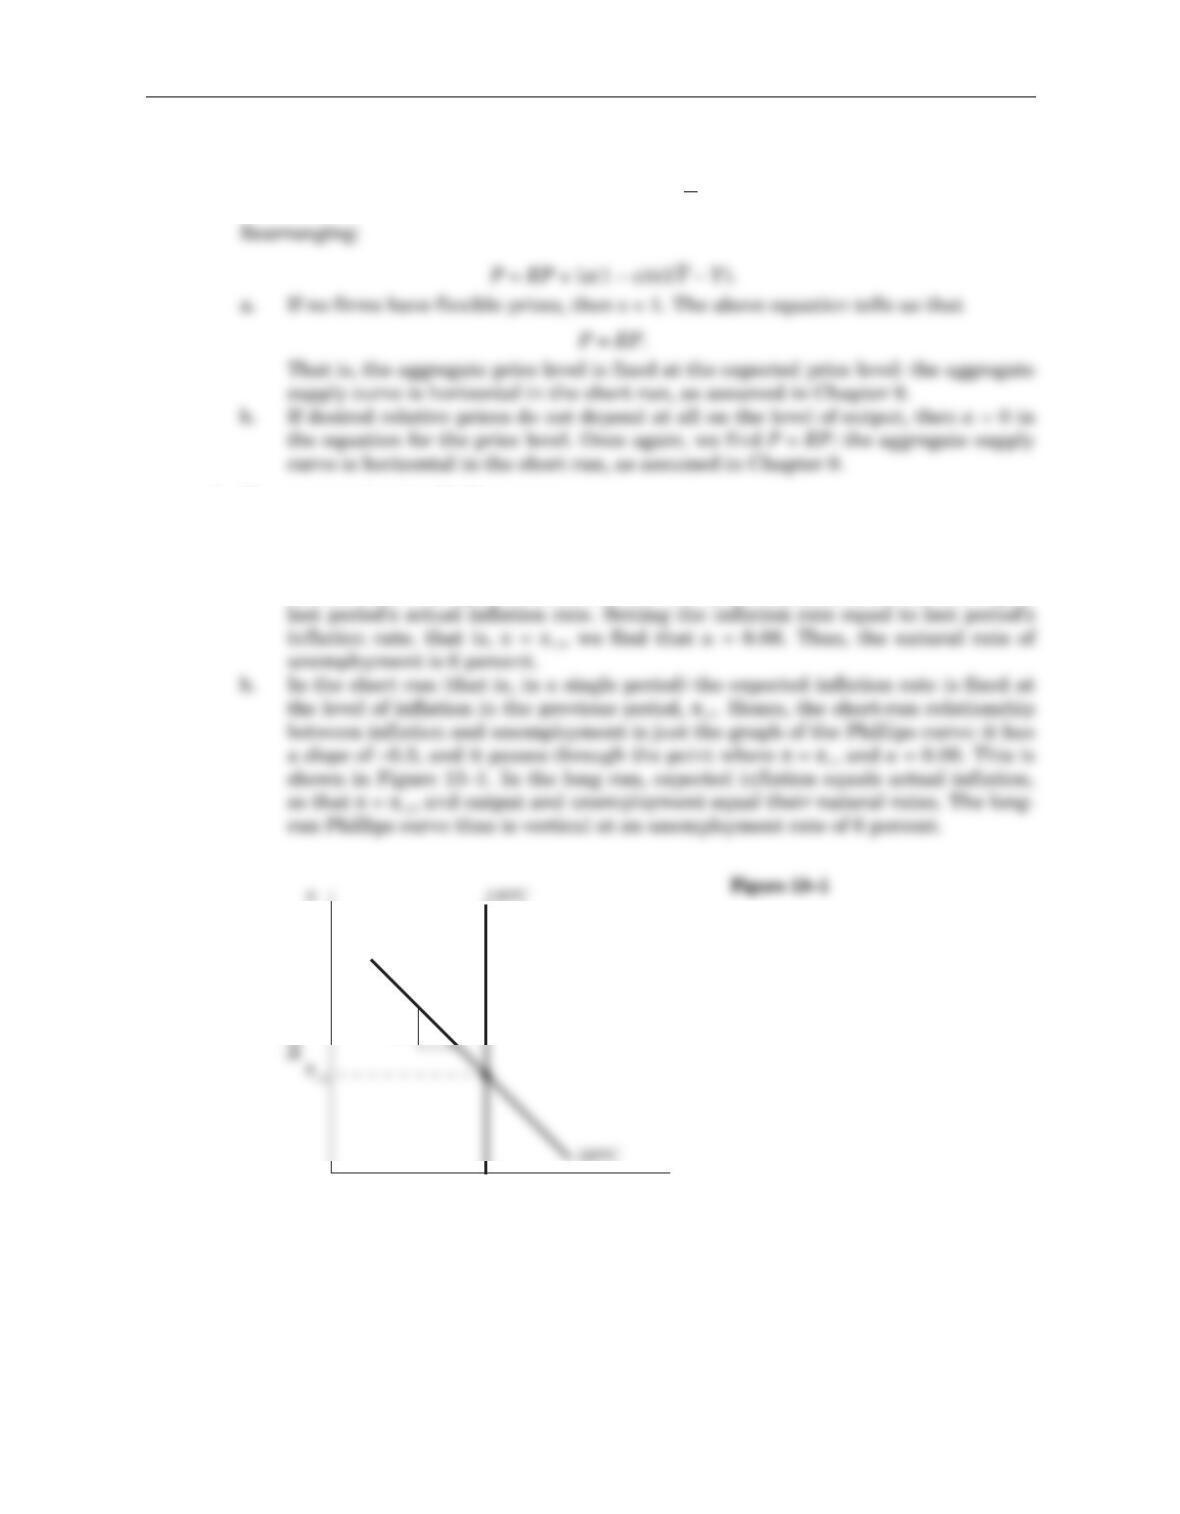
u
0.06
Unemployment
0.5
π
c. To reduce inflation, the Phillips curve tells us that unemployment must be above
its natural rate of 6 percent for some period of time. We can write the Phillips
curve in the form
Hence, we need 10 percentage points of cyclical unemployment above the natural
rate of 6 percent.
Okun’s law says that a change of 1 percentage point in unemployment trans-
lates into a change of 2 percentage points in GDP. Hence, an increase in unem-
ployment of 10 percentage points corresponds to a fall in output of 20 percentage
points. The sacrifice ratio is the percentage of a year’s GDP that must be forgone
to reduce inflation by 1 percentage point. Dividing the 20 percentage-point
decrease in GDP by the 5 percentage-point decrease in inflation, we find that the
sacrifice ratio is 20/5 = 4.
3. The cost of reducing inflation comes from the cost of changing people’s expectations
about inflation. If expectations can be changed costlessly, then reducing inflation is
also costless. Algebraically, the Phillips curve tells us that
π= Eπ– β(u– un) + v.
If the government can lower expected inflation Eπto the desired level of inflation, then
there is no need for unemployment to rise above its natural rate.
According to the rational-expectations approach, people form expectations about
inflation using all of the information that is available to them. This includes informa-
Chapter 13 Aggregate Supply 147
148 Answers to Textbook Questions and Problems
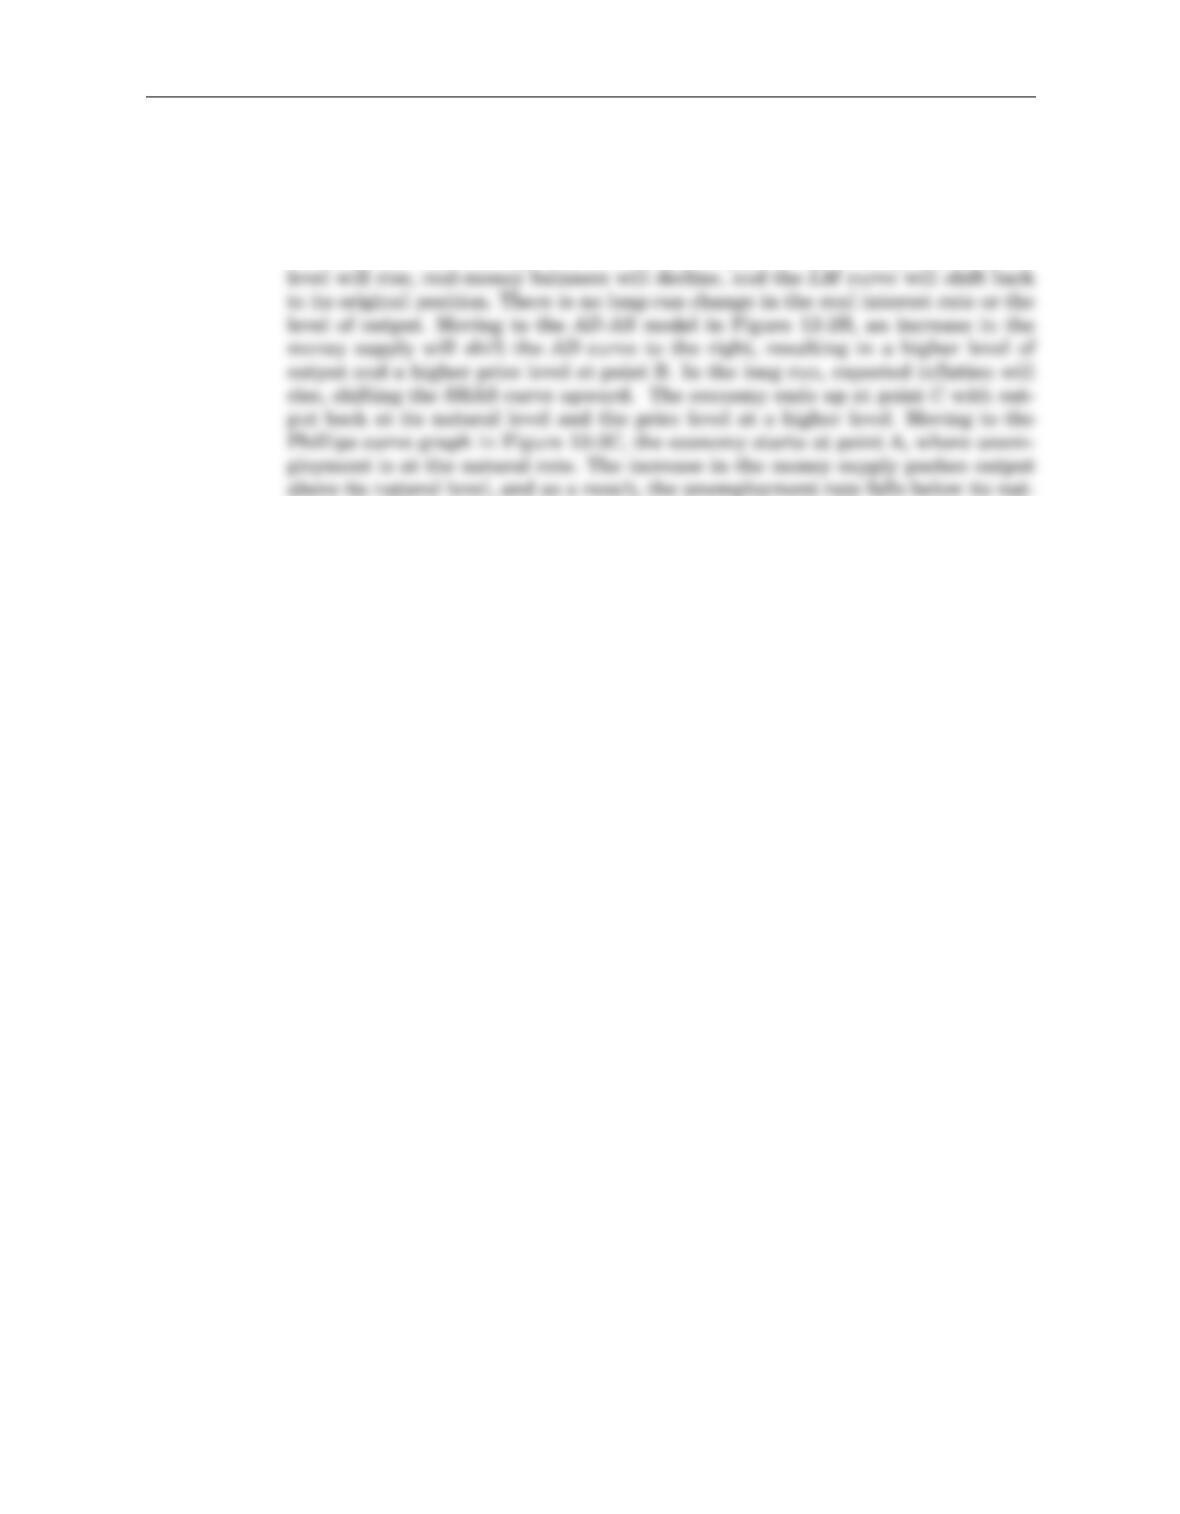
4. a. Beginning in long-run equilibrium, where output is at the natural level, if the
Federal Reserve increases the money supply, this will cause the economy to go
through an expansionary phase. Starting with the IS-LM model in Figure 13-2A,
an increase in the money supply will shift the LM curve to the right, resulting in a
lower interest rate and higher level of output at point B. In the long run, the price
ural level. This causes a movement along the short-run Phillips curve to point B,
where inflation is higher and unemployment is lower. In the long run, expected
inflation will rise, causing the Phillips curve to shift upward. The economy ends
up at point C with higher inflation and no change in the unemployment rate. The
economy moves through this expansionary cycle because the increase in the
money supply does not immediately cause expected inflation to rise.
Chapter 13 Aggregate Supply 149
r
A. IS–LM Model
LM1 = LM3
P
B. AD–AS Model
SRAS2
LRAS
SRAS1
P2
C
π
C. Phillips Curve
LRPC
C
π3
Figure 13–2
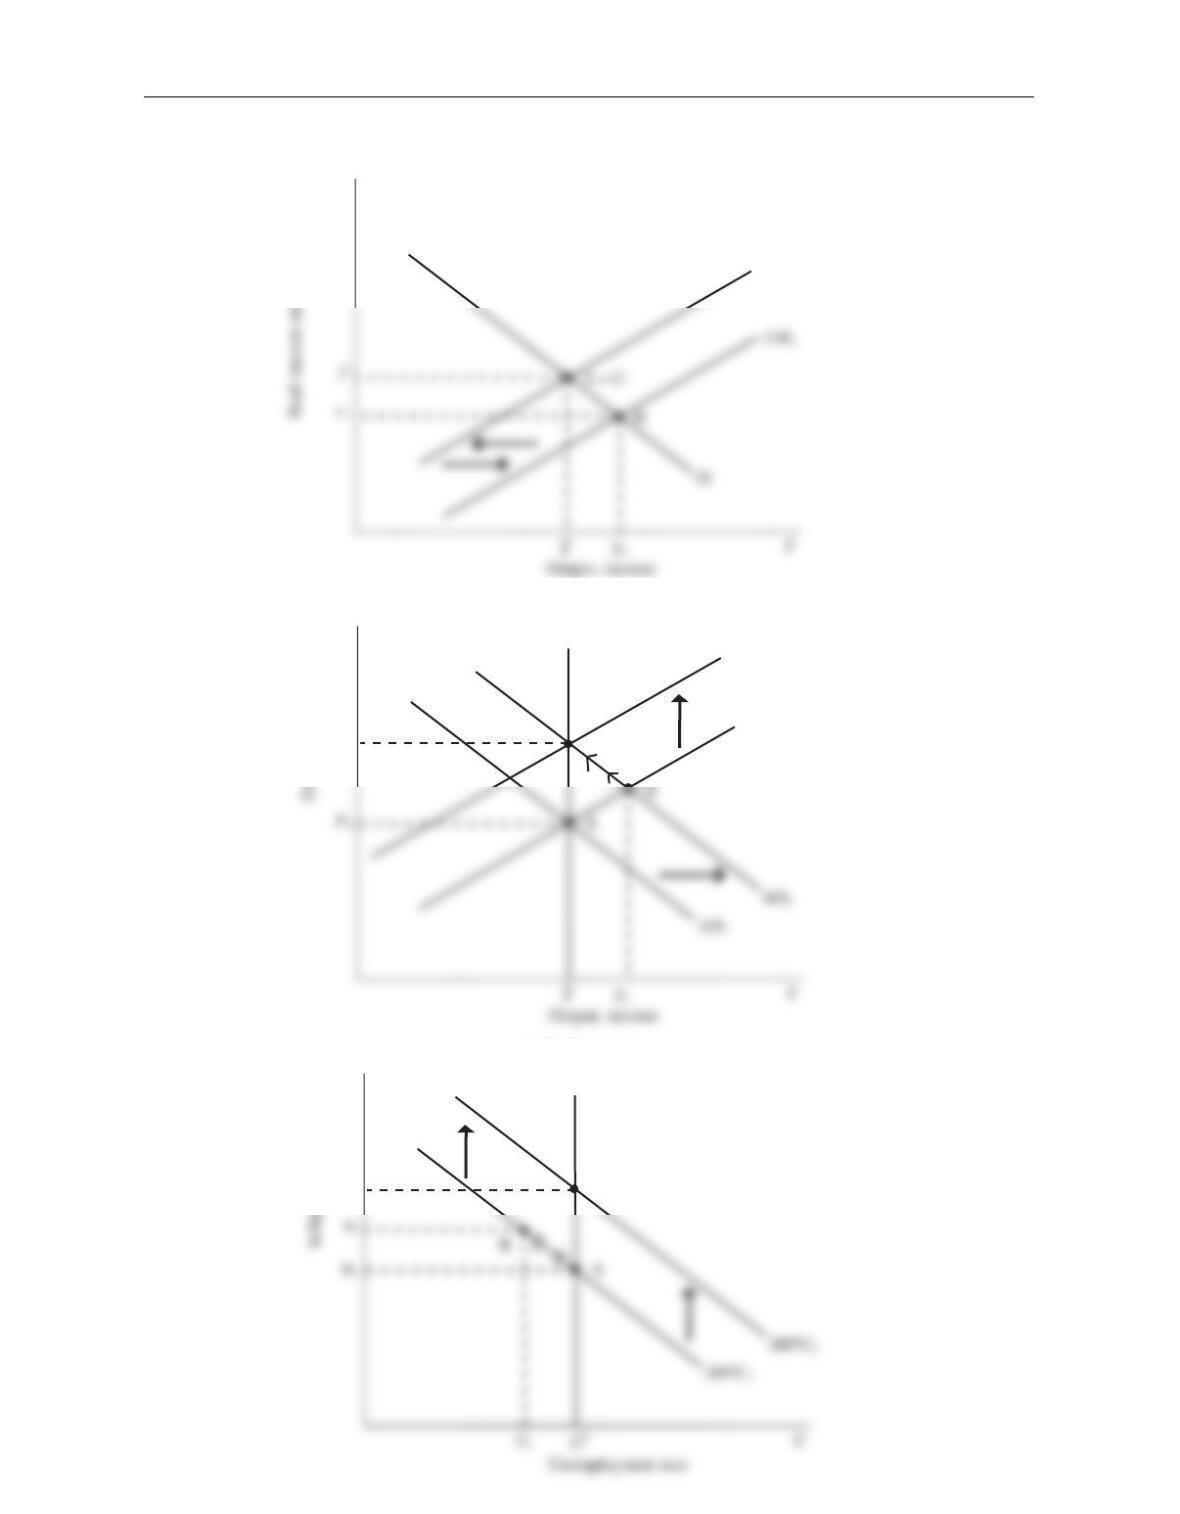
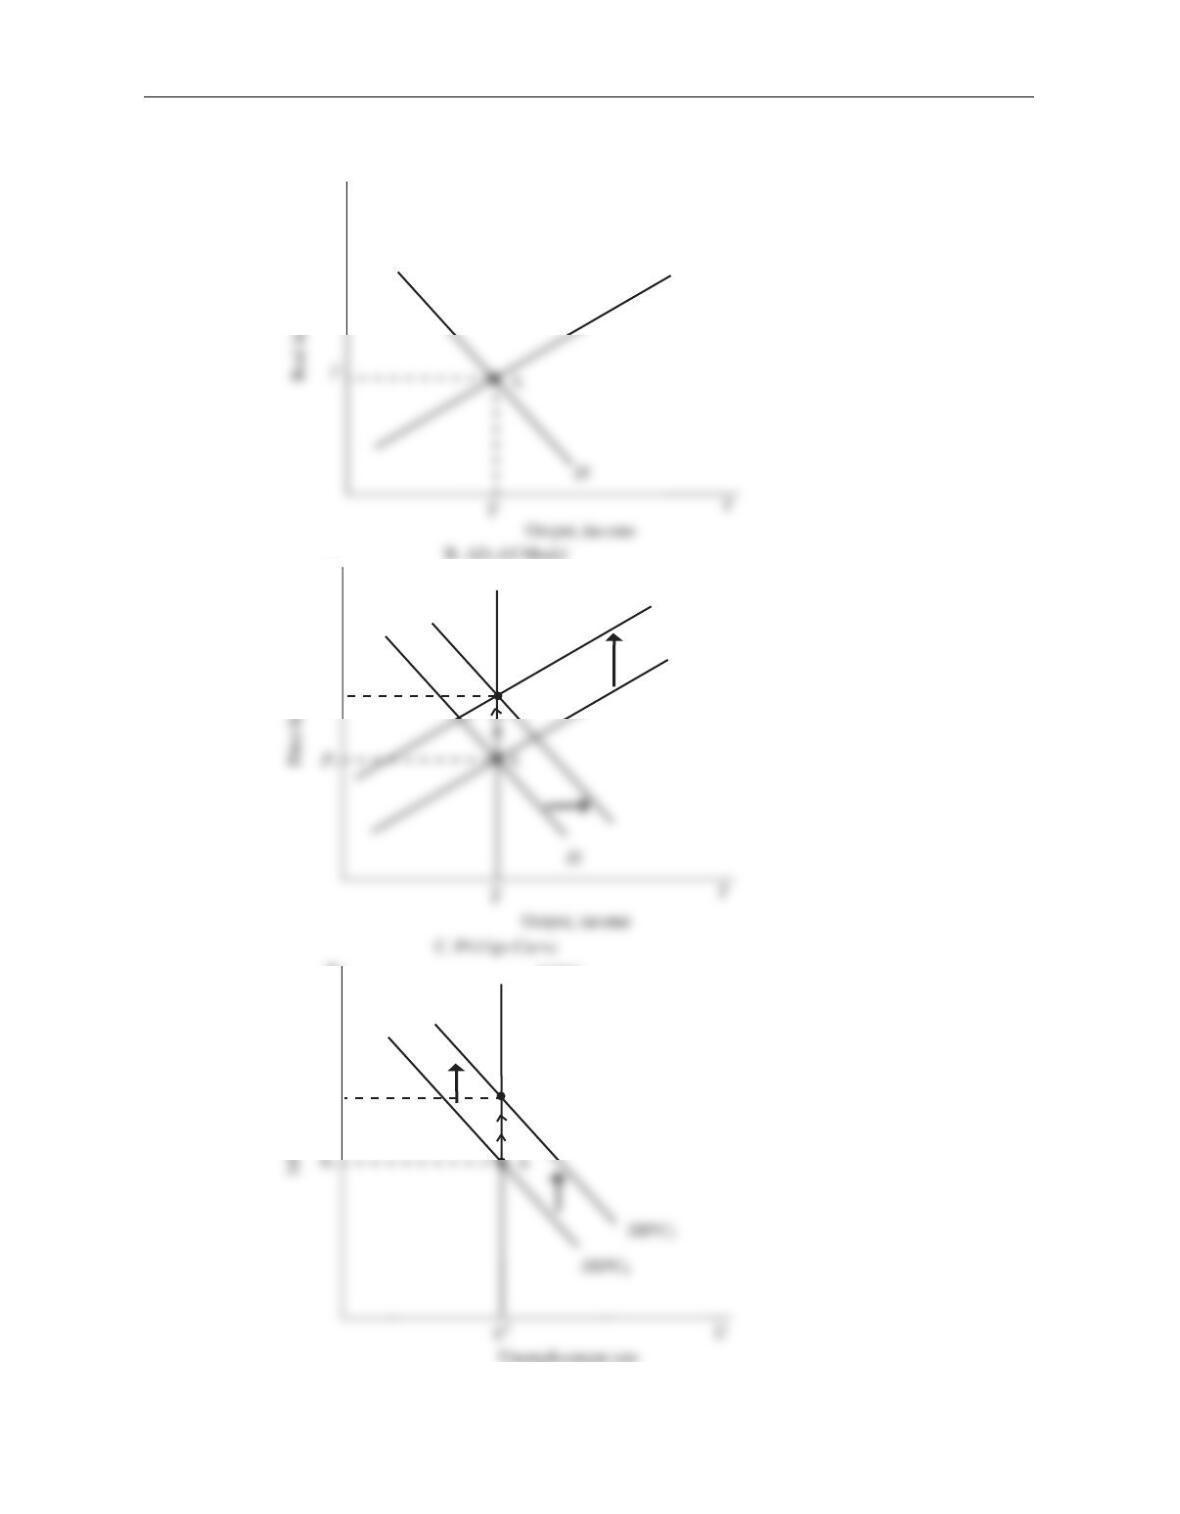
b. Beginning in long-run equilibrium with output at its natural level, if the Federal
Reserve increases the money supply and people immediately expect inflation to
rise, then nothing changes except for the price level and the inflation rate. In the
IS-LM model, the increase in the money supply will cause the price level to rise at
150 Answers to Textbook Questions and Problems
Chapter 13 Aggregate Supply 151
r
LM
π
B
LRPC
π2
P
LRAS
P2
B
SRAS2
SRAS1
A. IS–LM Model
B. AD–AS Model
Figure 13–3
5. In this question we consider several implications of rational expectations—the assump-
tion that people optimally use all of the information available to them in forming their
expectations—for the model of sticky prices that we considered in this chapter. This
model implies an aggregate supply curve in which output varies from its natural rate
only if the price level varies from its expected level:
prices increase by 15 percent when people expect them to increase by only 10 per-
cent. Since P> EP, output rises. But it is only the unanticipated part of money
growth that increases output.
b. The Fed often tries to stabilize the economy by offsetting shocks to output and
unemployment. For example, it might increase the money supply during re-
the same as a policy of keeping the money supply constant, assuming the Fed
chooses the level of the money supply at the same time people set prices so every-
one has the same information.
c. If the Fed sets the money supply after people set wages and prices, then the Fed
can use monetary policy systematically to stabilize output. The assumption of
6. In this model, the natural rate of unemployment is an average of the unemployment
rates in the past two years. Hence, if a recession raises the unemployment rate in some
year, then the natural rate of unemployment rises as well. This means that the model
exhibits hysteresis: short-term cyclical unemployment affects the long-term natural
rate of unemployment.
a. The natural rate of unemployment might depend on recent unemployment for at
least two reasons, suggested by the theory of hysteresis. First, recent unemploy-
ment rates might affect the level of frictional unemployment. Unemployed work-
152 Answers to Textbook Questions and Problems
ers lose job skills and find it harder to get jobs; also, unemployed workers might
lose some of their desire to work, and hence search less hard for a job. Second,
recent unemployment rates might affect the level of structural unemployment. If
1) = 2.
That is, we require an unemployment rate 2 percentage points above the original
natural rate u. Next period, however, the natural rate will rise as a result of the
cyclical unemployment. The new natural rate uwill be
u= 0.5[u1+ u0]
= 0.5[(un
1+ 2) + un
1]
= un
1+ 1.
Hence, the natural rate of unemployment rises by 1 percentage point. If the Fed
wants to keep inflation at its new level, then unemployment in period 2 must
equal the new natural rate u. Hence,
Unemployment always remains above its original natural rate. In fact, we can
show that it is always at least 1 percent above its original natural rate. Thus, to
reduce inflation by 1 percentage point, unemployment rises above its original level
by 2 percentage points in the first year, and by 1 or more percentage points in
every year after that.
c. Because unemployment is always higher than it started, output is always lower
than it would have been. Hence, the sacrifice ratio is infinite.
d. Without hysteresis, we found that there was a short-run tradeoff but no long-run
tradeoff between inflation and unemployment. With hysteresis, we find that there
is a long-run tradeoff between inflation and unemployment: to reduce inflation,
unemployment must rise permanently.
Chapter 13 Aggregate Supply 153
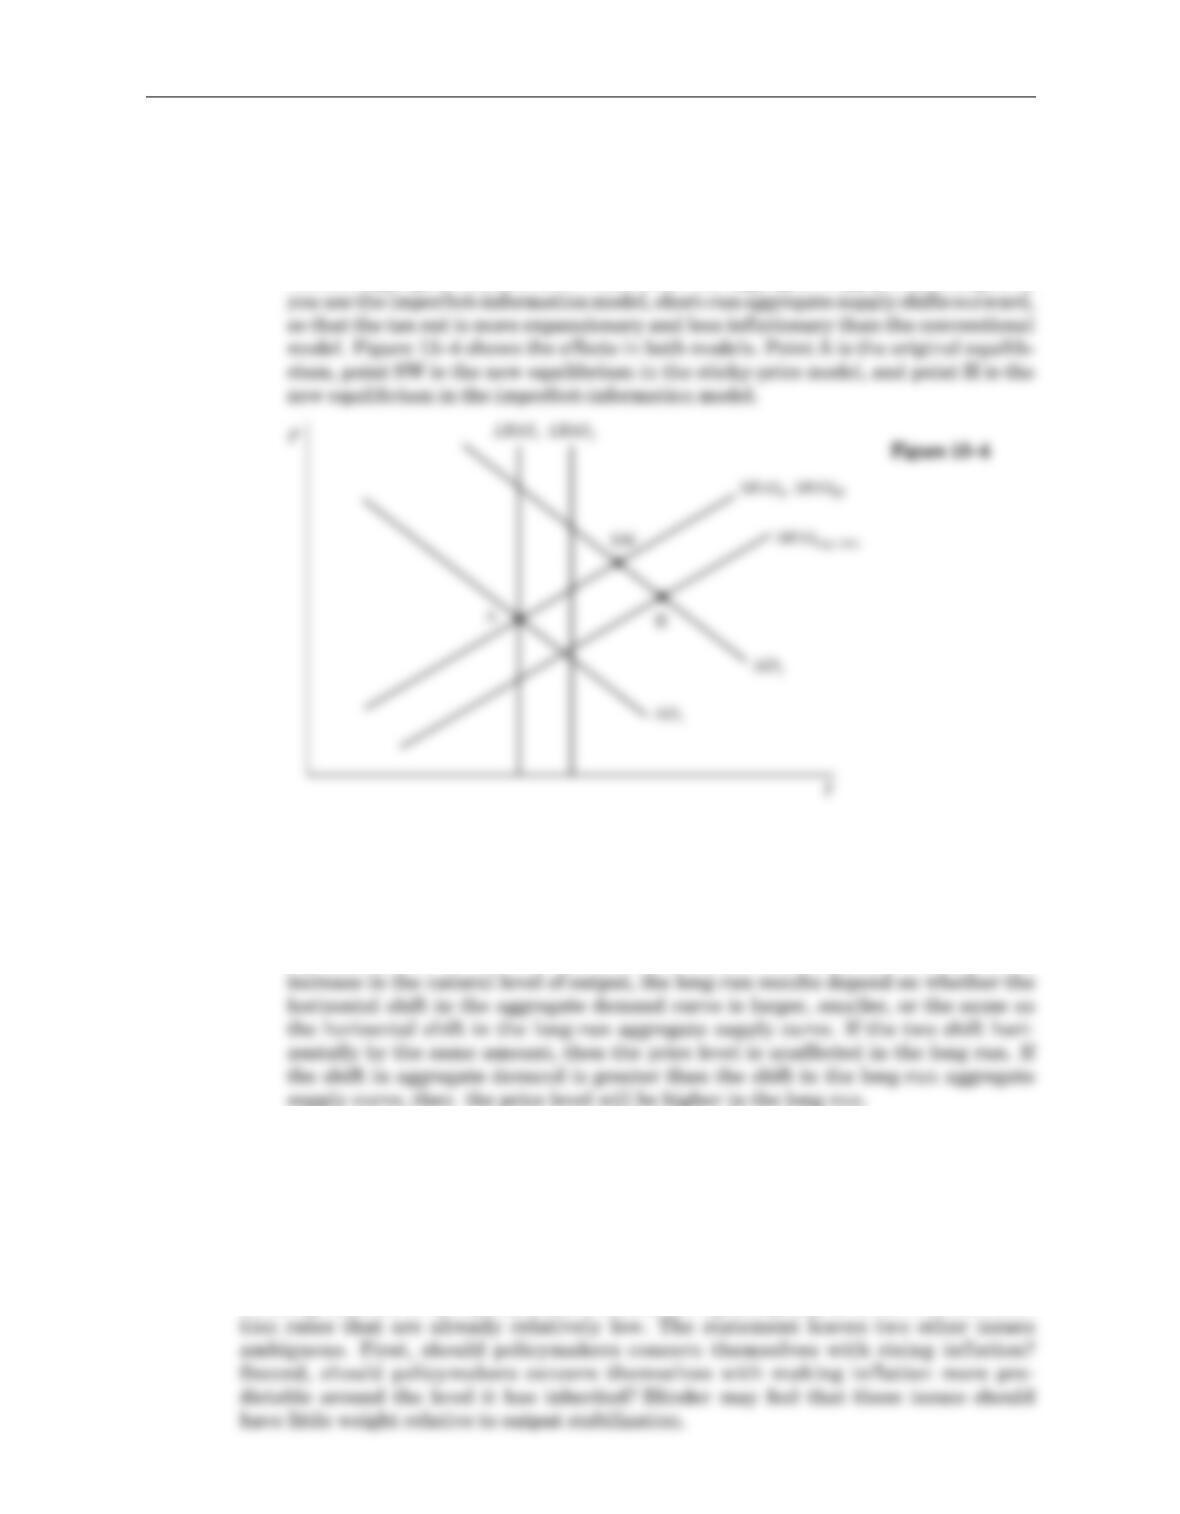
fect-information model assumes that the labor market is always in equilibrium, so
the greater supply of labor leads to higher employment immediately: the SRAS
shifts out.
c. If you are using the sticky-price model, the short-run analysis is the same as the con-
ventional model without the labor-supply effect. That is, output and prices both rise
because aggregate demand rises while short-run aggregate supply is unchanged. If
d. In the normal model, where the tax cut does not lead to a shift of labor supply that
increases the natural level of output, the long-run price level will be higher as a
result of the tax cut and output will return to the same natural level. The tax cut
led to a rightward shift of the aggregate demand curve in the short run. In the
long run, the short-run aggregate supply curve will shift up and to the left as the
expected price level rises. In the alternative model, where the tax cut leads to an
8. In this quote, Alan Blinder argues that in low-inflation countries like the United
States, the benefits of reducing inflation are small whereas the costs are large. That is,
menu costs, shoeleather costs, and tax distortions simply do not add up to much, so
eliminating inflation offers only small benefits. By contrast, the costs in terms of unem-
ployment and lost output that are associated with lowering inflation are easily quantifi-
able and very large.
The basic policy implication of these beliefs about the relative benefits and costs of
reducing inflation is that policymakers should not tighten policy in order to lower infla-
154 Answers to Textbook Questions and Problems
9. From the BLS web site (www.bls.gov), there are various ways to get the CPI data. For
the years 2004–2008, I obtained the following for “all urban consumers”:
Year 20042005 2006 2007 2008
Overall CPI 3.8 2.8 3.2 3.4 2.7
More Problems and Applications to Chapter 13
1. a. The classical large open economy model (from the Appendix to Chapter 5) is
similar to special case 2 in the text, except that it allows the interest rate to
deviate from the world interest rate. That is, this is the special case where
EP = P,L(i,Y) = (1/V)Y, and CF = CF(r-r*), with a non-infinitely elastic inter-
national capital flow. Because capital flows do not respond overwhelmingly
to any differences between the domestic and world interest rates, these rates
can, in fact, vary in this case.
Chapter 13 Aggregate Supply 155