Chapter 13: Capital Structure and Leverage
Learning Objectives
363
Chapter 13
Capital Structure and Leverage
Learning Objectives
After reading this chapter, students should be able to do the following:
◆ Explain why there may be differences in a firm’s capital structure when measured on a book-value
basis, a market-value basis, or a target basis.
364
Lecture Suggestions
Chapter 13: Capital Structure and Leverage
Lecture Suggestions
This chapter is rather long, but it is also modular, hence sections can be omitted without loss of
continuity. Therefore, if you are experiencing a time crunch, you could skip selected sections.
DAYS ON CHAPTER: 4 OF 56 DAYS (50-minute periods)
Chapter 13: Capital Structure and Leverage
Answers and Solutions
365
Answers to End-of-Chapter Questions
13-1 Operating leverage is the extent to which fixed costs are used in a firm’s operations. If operating
13-2 a. The break-even point will be lowered.
b. The effect on the break-even point is indeterminant. An increase in fixed costs will increase
13-3 If sales tend to fluctuate widely, then cash flows and the ability to service fixed charges will also
13-4 An increase in the personal tax rate makes both stocks and bonds less attractive to investors
because it raises the tax paid on dividend and interest income. Changes in personal tax rates will
have differing effects, depending on what portion of an investment’s total return is expected in the
13-5 a. An increase in the corporate tax rate would encourage a firm to increase the amount of debt
in its capital structure because a higher tax rate increases the interest deductibility feature of
debt.
b. An increase in the personal tax rate would cause investors to shift from bonds to stocks due
to the attractiveness of the deferral of capital gains taxes. This would raise the cost of debt
relative to equity; thus, firms would be encouraged to use less debt in their capital
structures.
13-6 Biotechnology companies use relatively little debt because their industries tend to be cyclical,
oriented toward research, or subject to huge product liability suits. Utility companies, on the
13-7 EBIT depends on sales and operating costs that generally are not affected by the firm’s use of
financial leverage, because interest is deducted from EBIT. At high debt levels, however, firms
13-8 Expected EPS is generally measured as EPS for the coming years, and we typically do not reflect
in this calculation any bankruptcy-related costs. Also, EPS does not reflect (in a major way) the
13-9 The tax benefits from debt increase linearly, which causes a continuous increase in the firm’s
13–10 With increased competition after the breakup of AT&T, the new AT&T and the seven Bell
operating companies’ business risk increased. With this component of total company risk
13–11 The firm may want to assess the asset investment and financing decisions jointly. For instance,
the highly automated process would require fancy, new equipment (capital intensive) so fixed
costs would be high. A less automated production process, on the other hand, would be labor
intensive, with high variable costs. If sales fell, the process that demands more fixed costs might
Solutions to End-of-Chapter Problems
13-1 QBE =
VP
F
−
13-2 The optimal capital structure is that capital structure where WACC is minimized and stock price is
13-3 a. Expected EPS for Firm C:
b. According to the standard deviations of EPS, Firm B is the least risky, while C is the riskiest.
However, this analysis does not consider portfolio effects—if C’s earnings increase when most
other companies’ decline (that is, its beta is low), its apparent riskiness would be reduced.
Also, standard deviation is related to size, or scale, and to correct for scale we could calculate a
coefficient of variation (/mean):
13–4 From the Hamada equation, b = bU[1 + (1 – T)(D/E)], we can calculate bU as bU = b/[1 + (1 – T)(D/E)].
368
Answers and Solutions
Chapter 13: Capital Structure and Leverage
13-5 a. ROIC =
capital Total
)TEBIT(1−
.
b. LL: Debt/Capital = 30%; Debt = 0.3 × $20,000,000 = $6,000,000.
EBIT $4,000,000
Interest ($6,000,000 0.10) 600,000
c. LL: Debt/Capital = 60%; Debt = 0.6 × $20,000,000 = $12,000,000.
EBIT $4,000,000
Interest ($12,000,000 0.15) 1,800,000
Although LL’s return on equity is higher than it was at the 30% leverage ratio, it is lower
than the 21.0% return of HL.
13-6 a. 9,000 units 15,000 units
Sales $234,000 $390,000
Chapter 13: Capital Structure and Leverage
Answers and Solutions
369
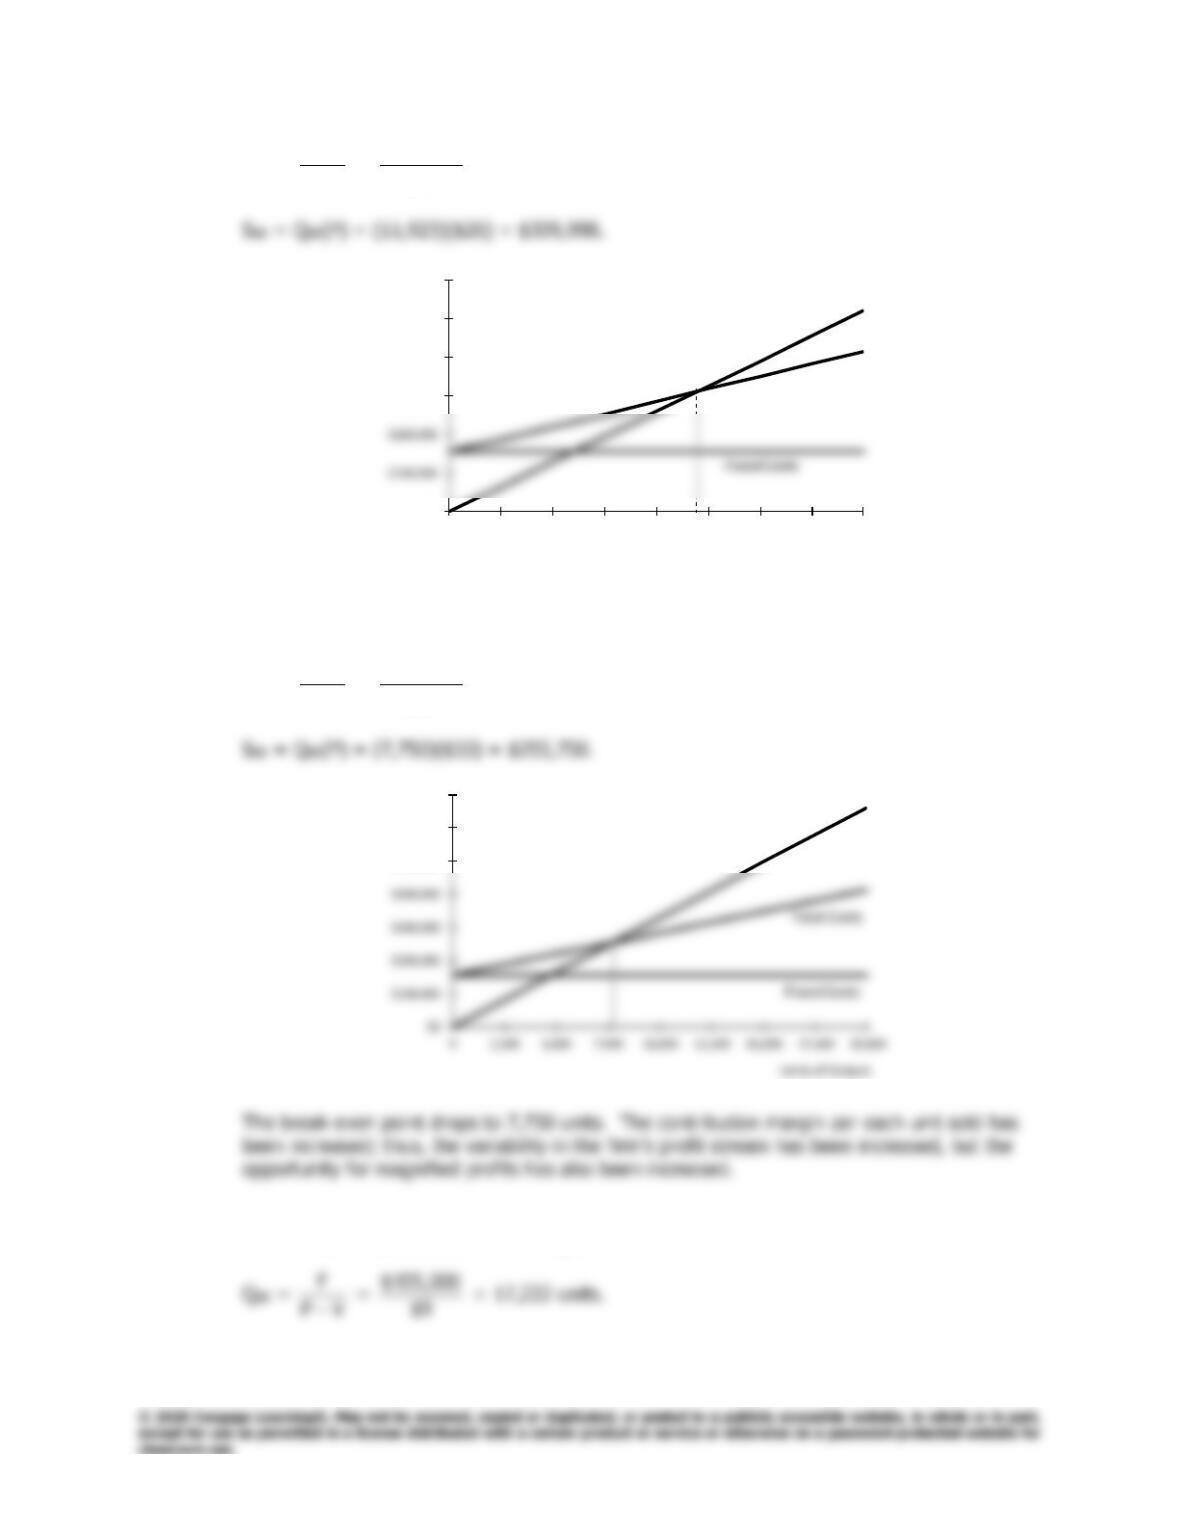
b. QBE =
V P
F
−
=
3$1
,00055$1
= 11,923 units.
$0
$300,000
$400,000
$500,000
$600,000
0 2,500 5,000 7,500 10,000 12,500 15,000 17,500 20,000
Units of Output
Revenues
Total Costs
c. If the selling price rises to $33, while the variable cost per unit remains fixed, P – V rises to
$20. The end result is that the break-even point is lowered.
QBE =
V P
F
−
=
20$
,00055$1
= 7,750 units.
$500,000
$600,000
$700,000
Revenues
d. If the selling price rises to $33 and the variable cost per unit rises to $24, P – V falls to $9.
The end result is that the break-even point increases.
,00055$1
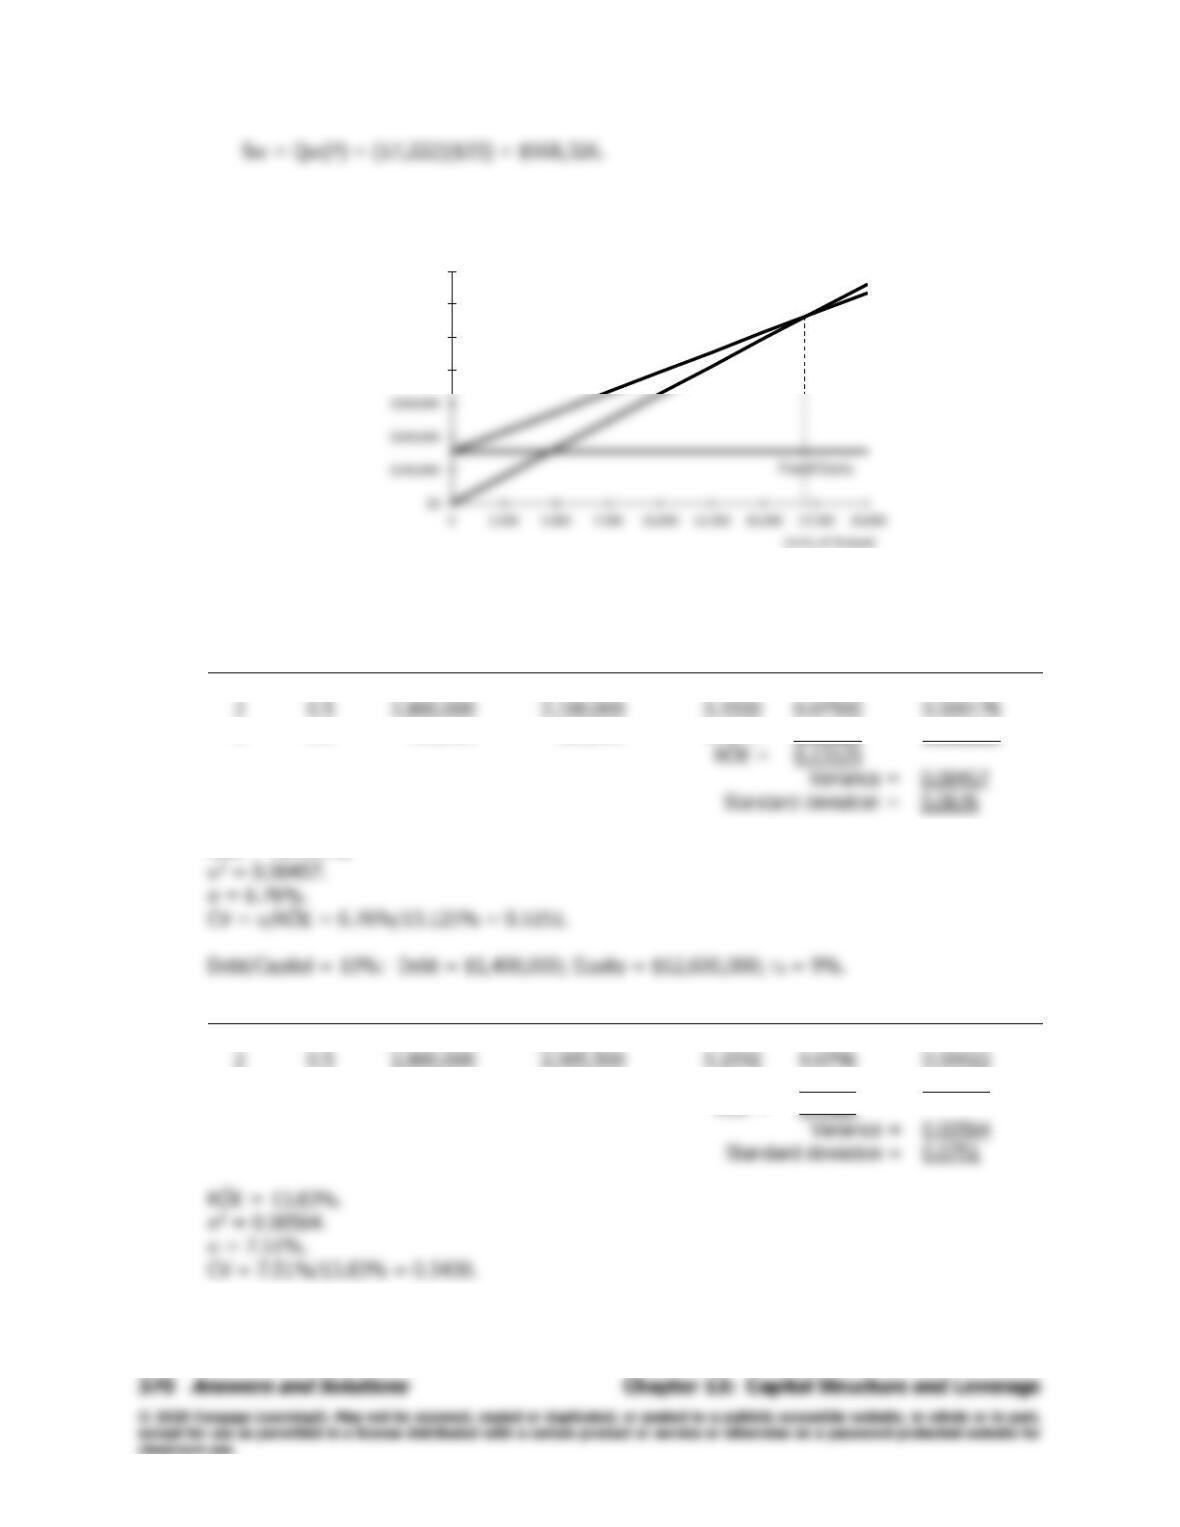
The break-even point increases to 17,222 units because the contribution margin per each
unit sold has decreased.
$400,000
$500,000
$600,000
$700,000
Total Costs
Revenues
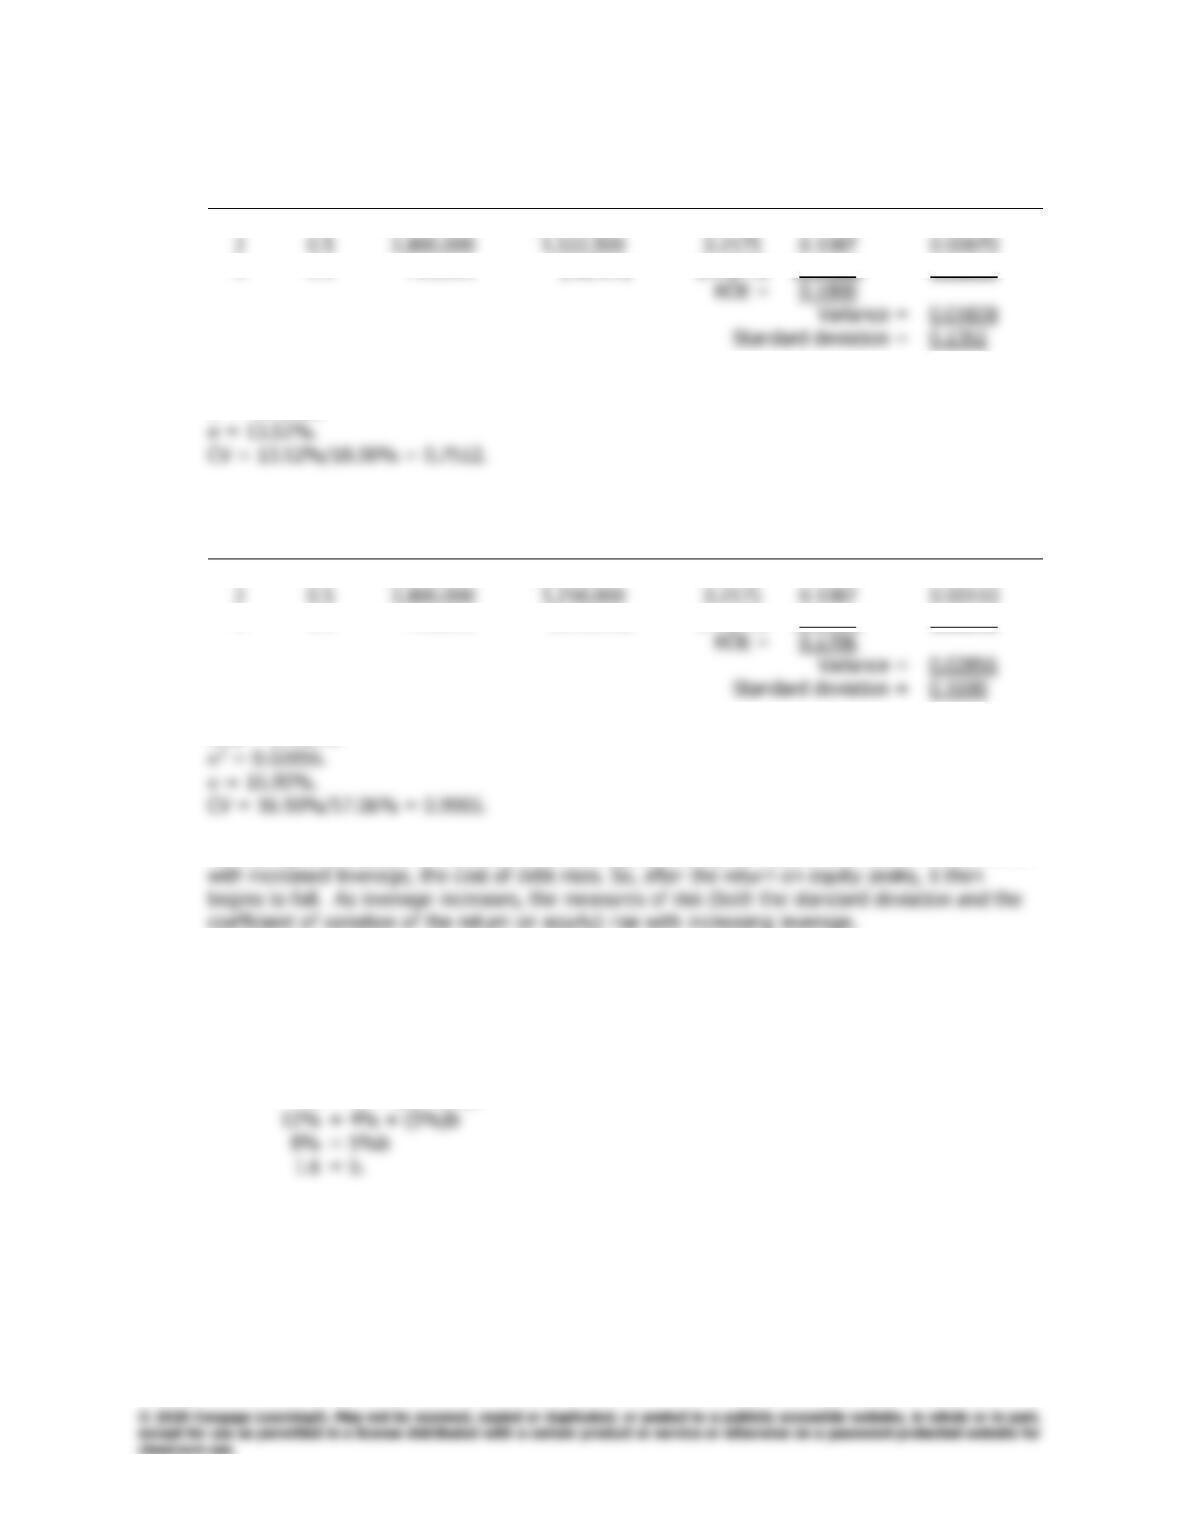
13-7 No leverage: Debt = 0; Equity = $14,000,000.
State
Ps
EBIT
(EBIT – rdD)(1 – T)
ROES
PS(ROE)
PS(ROES – RÔE)2
1
0.2
$4,200,000
$3,150,000
0.2250
0.04500
0.001758
2
0.5
2,800,000
2,100,000
0.1500
0.000176
3
0.3
700,000
525,000
0.0375
0.01125
0.002637
RÔE =
0.13125
0.00457
RÔE = 13.125%.
State
Ps
EBIT
(EBIT – rdD)(1 – T)
ROES
PS(ROE)
PS(ROES – RÔE)2
1
0.2
$4,200,000
$3,055,500
0.2425
0.0485
0.00217
2
0.5
2,800,000
2,005,500
0.1592
0.0796
0.00022
3
0.3
700,000
430,500
0.0342
0.0102
0.00326
RÔE =
0.1383
0.00564
Chapter 13: Capital Structure and Leverage
Answers and Solutions
371
Debt/Capital = 50%: Debt = $7,000,000; Equity = $7,000,000; rd = 11%.
State
Ps
EBIT
(EBIT – rdD)(1 – T)
ROES
PS(ROE)
PS(ROES – RÔE)2
1
0.2
$4,200,000
$2,572,500
0.3675
0.0735
0.00703
2
0.5
2,800,000
0.2175
0.1087
0.00070
3
0.3
700,000
(52,500)
(0.0075)
(0.0022)
0.01055
0.1800
0.01828
RÔE = 18.0%.
2 = 0.01828.
Debt/Capital = 60%: D = $8,400,000; E = $5,600,000; rd = 14%.
State
Ps
EBIT
(EBIT – rdD)(1 – T)
ROES
PS(ROE)
PS(ROES – RÔE)2
1
0.2
$4,200,000
$2,268,000
0.4050
0.0810
0.01099
2
0.5
2,800,000
1,218,000
0.2175
0.1087
0.00110
3
0.3
700,000
(357,000)
(0.0638)
(0.0191)
0.01648
0.1706
0.02856
RÔE = 17.06%.
As leverage increases, the expected return on equity rises up to a point. But as the risk increases
13-8 Facts as given: Current capital structure: 25% debt, 75% equity; rRF = 4%; rM – rRF = 5%;
T = 25%; rs = 12%.
Step 1: Determine the firm’s current beta.
rs = rRF + (rM – rRF)b
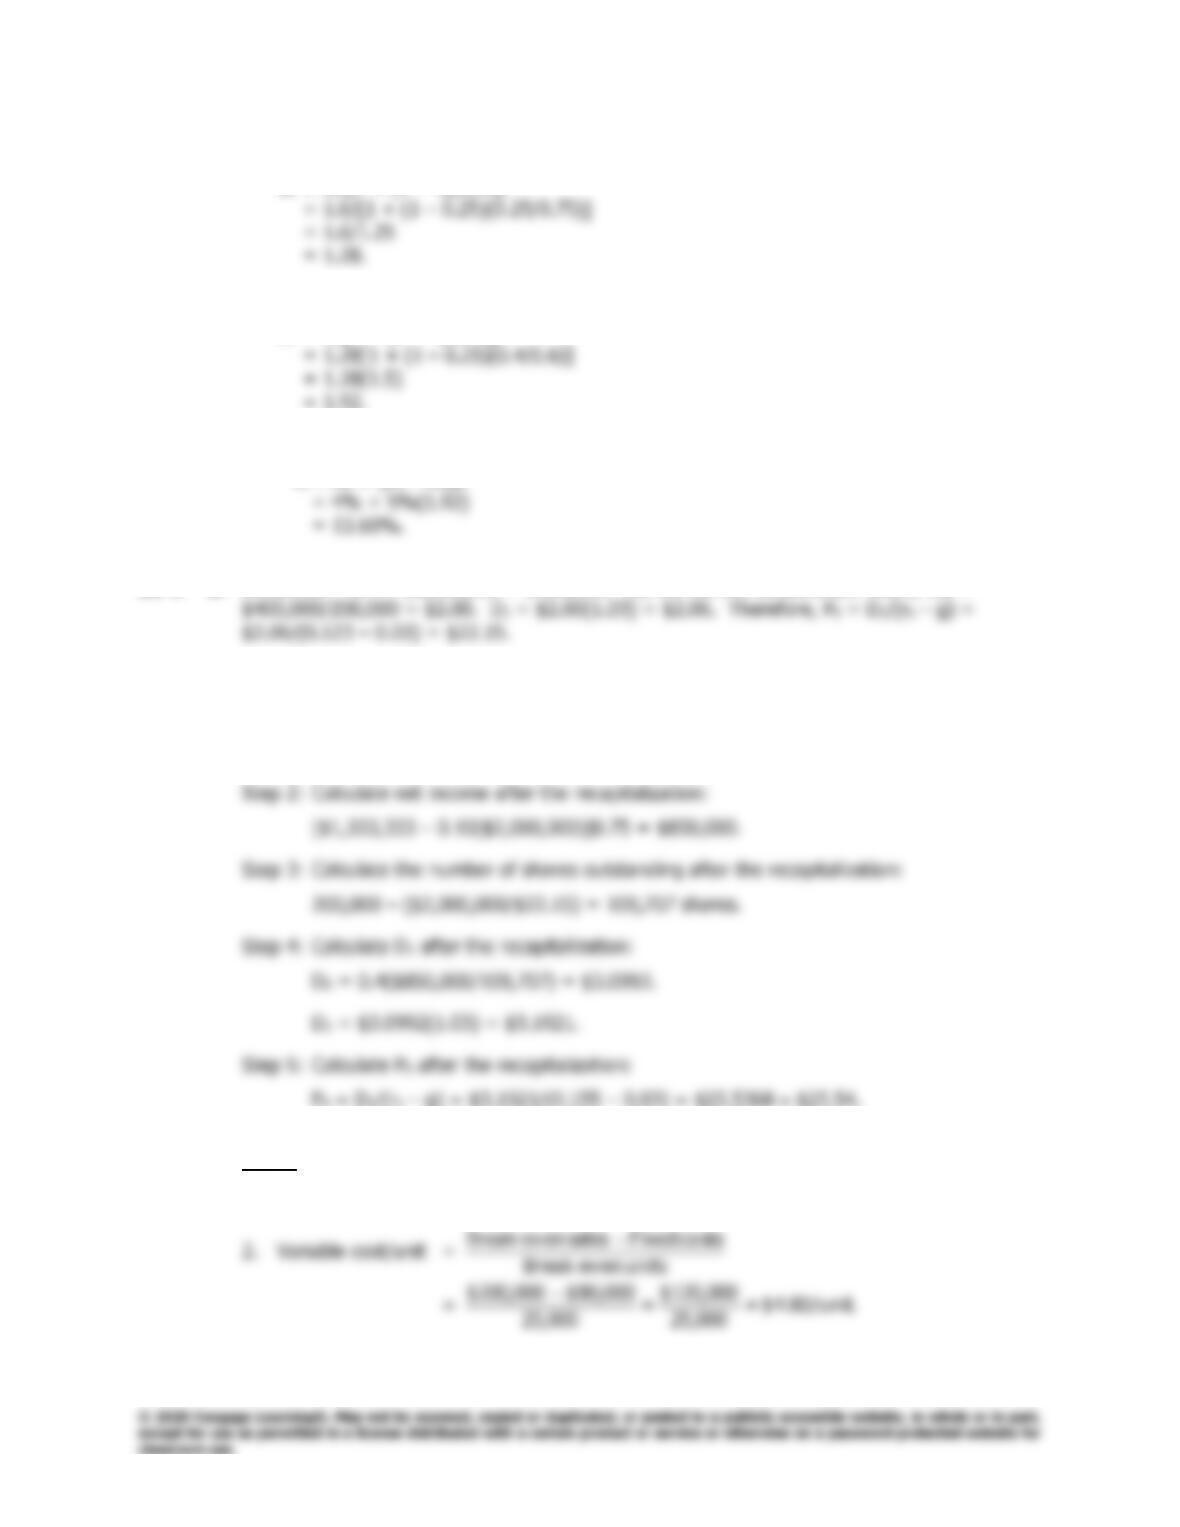
372
Answers and Solutions
Chapter 13: Capital Structure and Leverage
Step 2: Determine the firm’s unlevered beta, bU.
bU = bL/[1 + (1 – T)(D/E)]
Step 3: Determine the firm’s beta under the new capital structure.
bL = bU[1 + (1 – T)(D/E)]
= 1.92.
Step 4: Determine the firm’s new cost of equity under the changed capital structure.
rs = rRF + (rM – rRF)b
13-9 a. Dividends = 0.4 × $1,000,000 = $400,000. So, the current dividend per share, D0, =
b. Step 1: Calculate EBIT before the recapitalization:
EBIT = $1,000,000/(1 – T) = $1,000,000/0.75 = $1,333,333.
Note: The firm is 100% equity financed, so there is no interest expense.
13-10 a. Firm A
1. Fixed costs = $80,000.
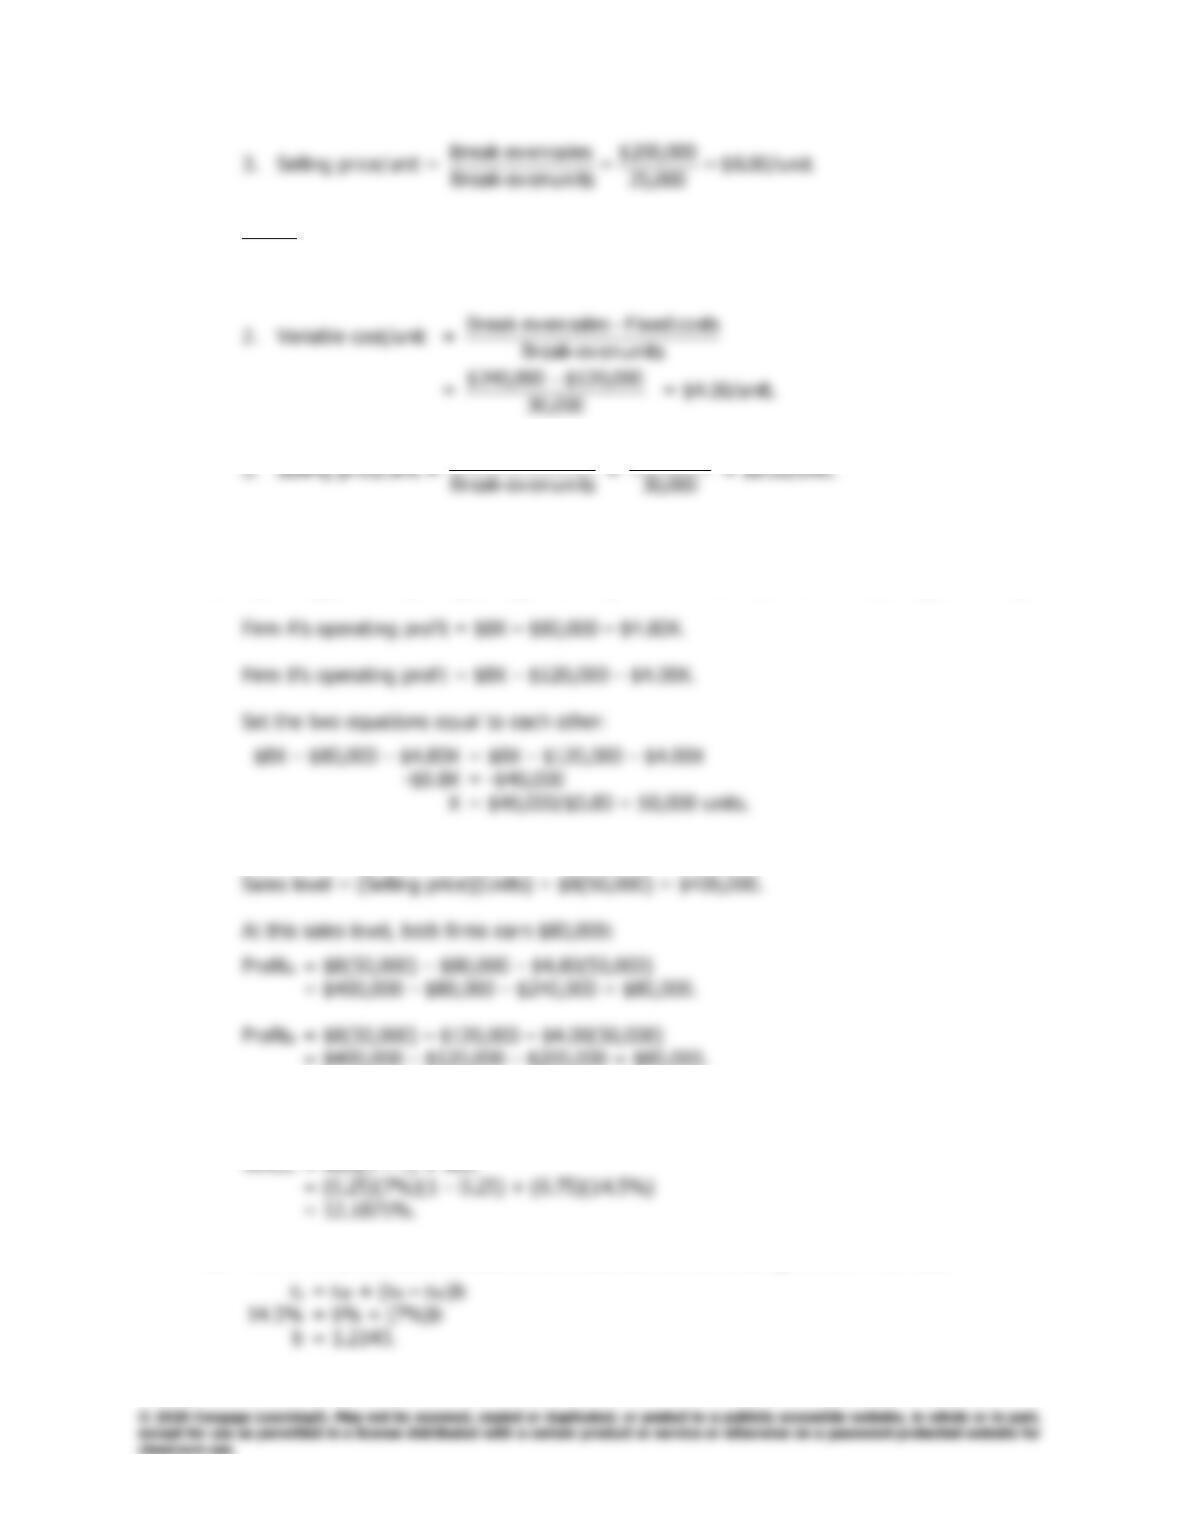
Chapter 13: Capital Structure and Leverage
Answers and Solutions
373
Firm B
1. Fixed costs = $120,000.
sales even–Break
$240,000
b. Firm B has the higher operating leverage due to its larger amount of fixed costs.
c. Operating profit = (Selling price)(Units sold) – Fixed costs – (Variable costs/unit)(Units sold).
Check:
13-11 a. Using the standard formula for the weighted average cost of capital, we find:
b. The firm’s current levered beta at 25% debt can be found using the CAPM formula.
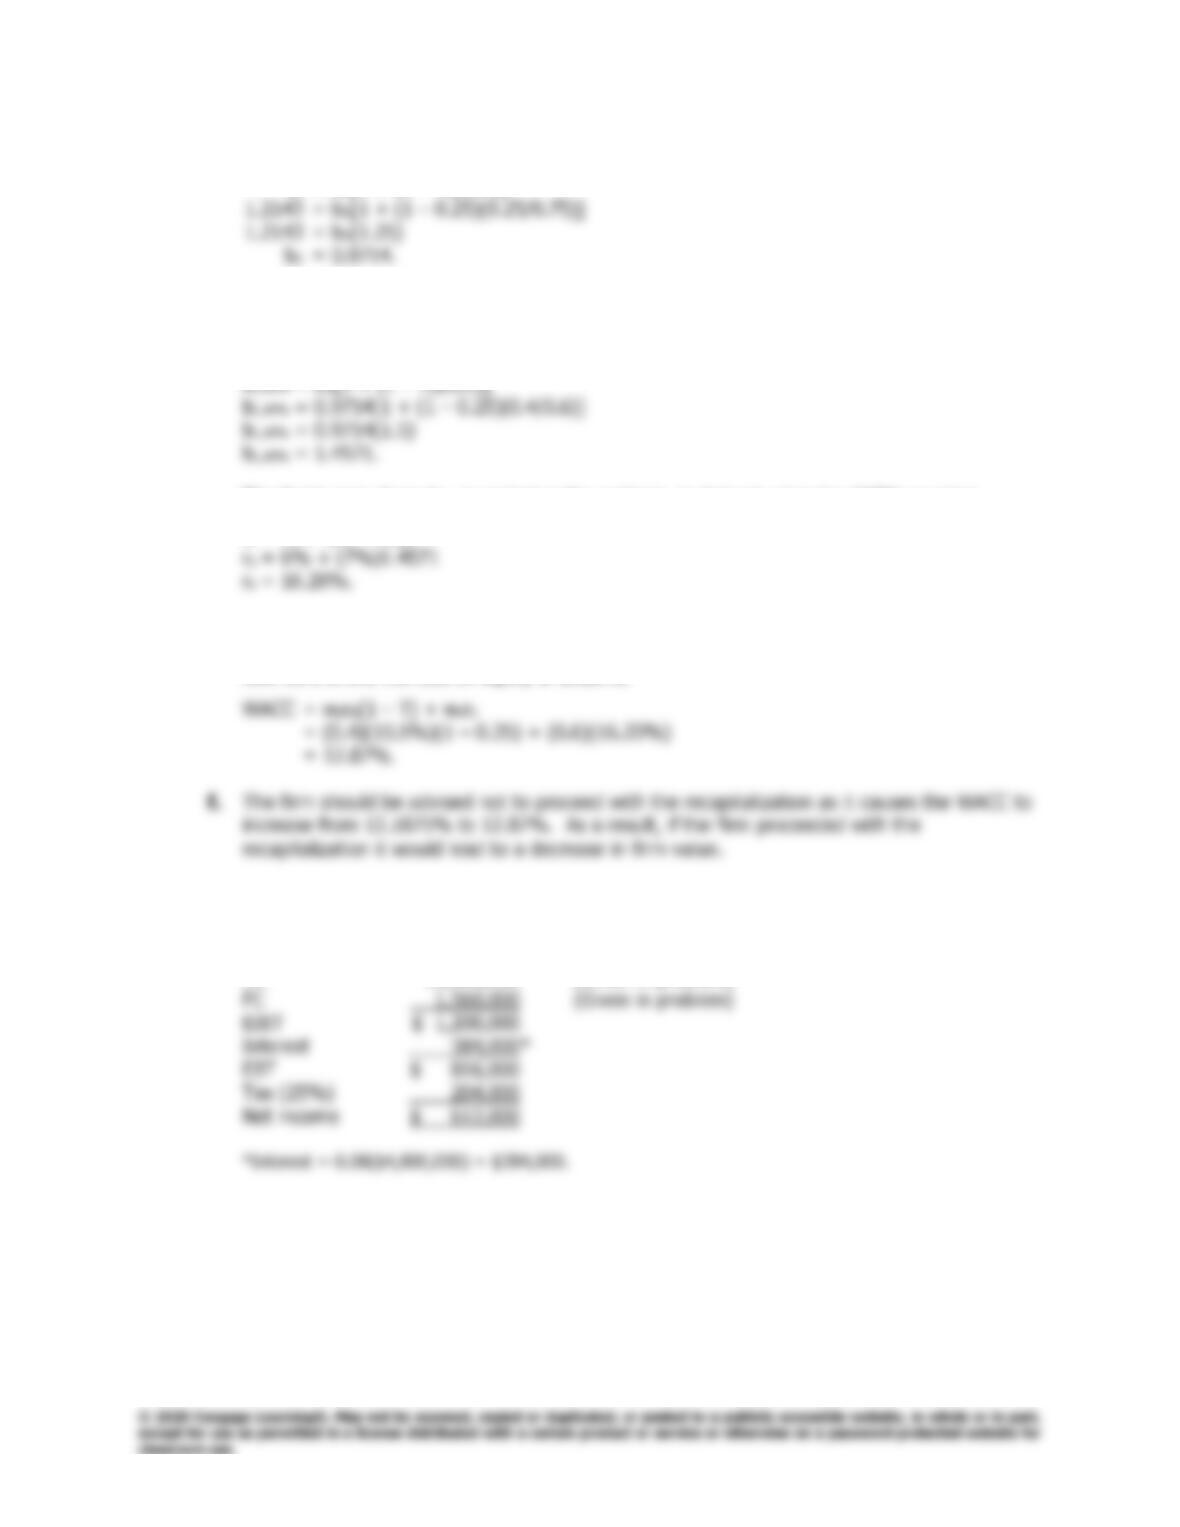
374
Answers and Solutions
Chapter 13: Capital Structure and Leverage
c. To “unlever” the firm’s beta, the Hamada equation is used.
bL = bU[1 + (1 – T)(D/E)]
d. To determine the firm’s new cost of common equity, one must find the firm’s new beta under
its new capital structure. Consequently, you must “relever” the firm‘s beta using the Hamada
equation:
The firm’s cost of equity, as stated in the problem, is derived using the CAPM equation.
rs = rRF + (rM – rRF)b
e. Again, the standard formula for the weighted average cost of capital is used. Remember, the
WACC is a marginal, after-tax cost of capital and hence the relevant before-tax cost of debt is
now 10.5% and the cost of equity is 16.20%.
13-12 a. Without new investment:
Sales $12,960,000 ($28.80 × 450,000 units)
VC 10,200,000 (Given in problem)
1. EPSOld = $612,000/240,000 = $2.55.
With new investment:
Debt Stock
Sales $12,960,000 $12,960,000
VC (0.8)($10,200,000) 8,160,000 8,160,000
FC 1,800,000 1,800,000
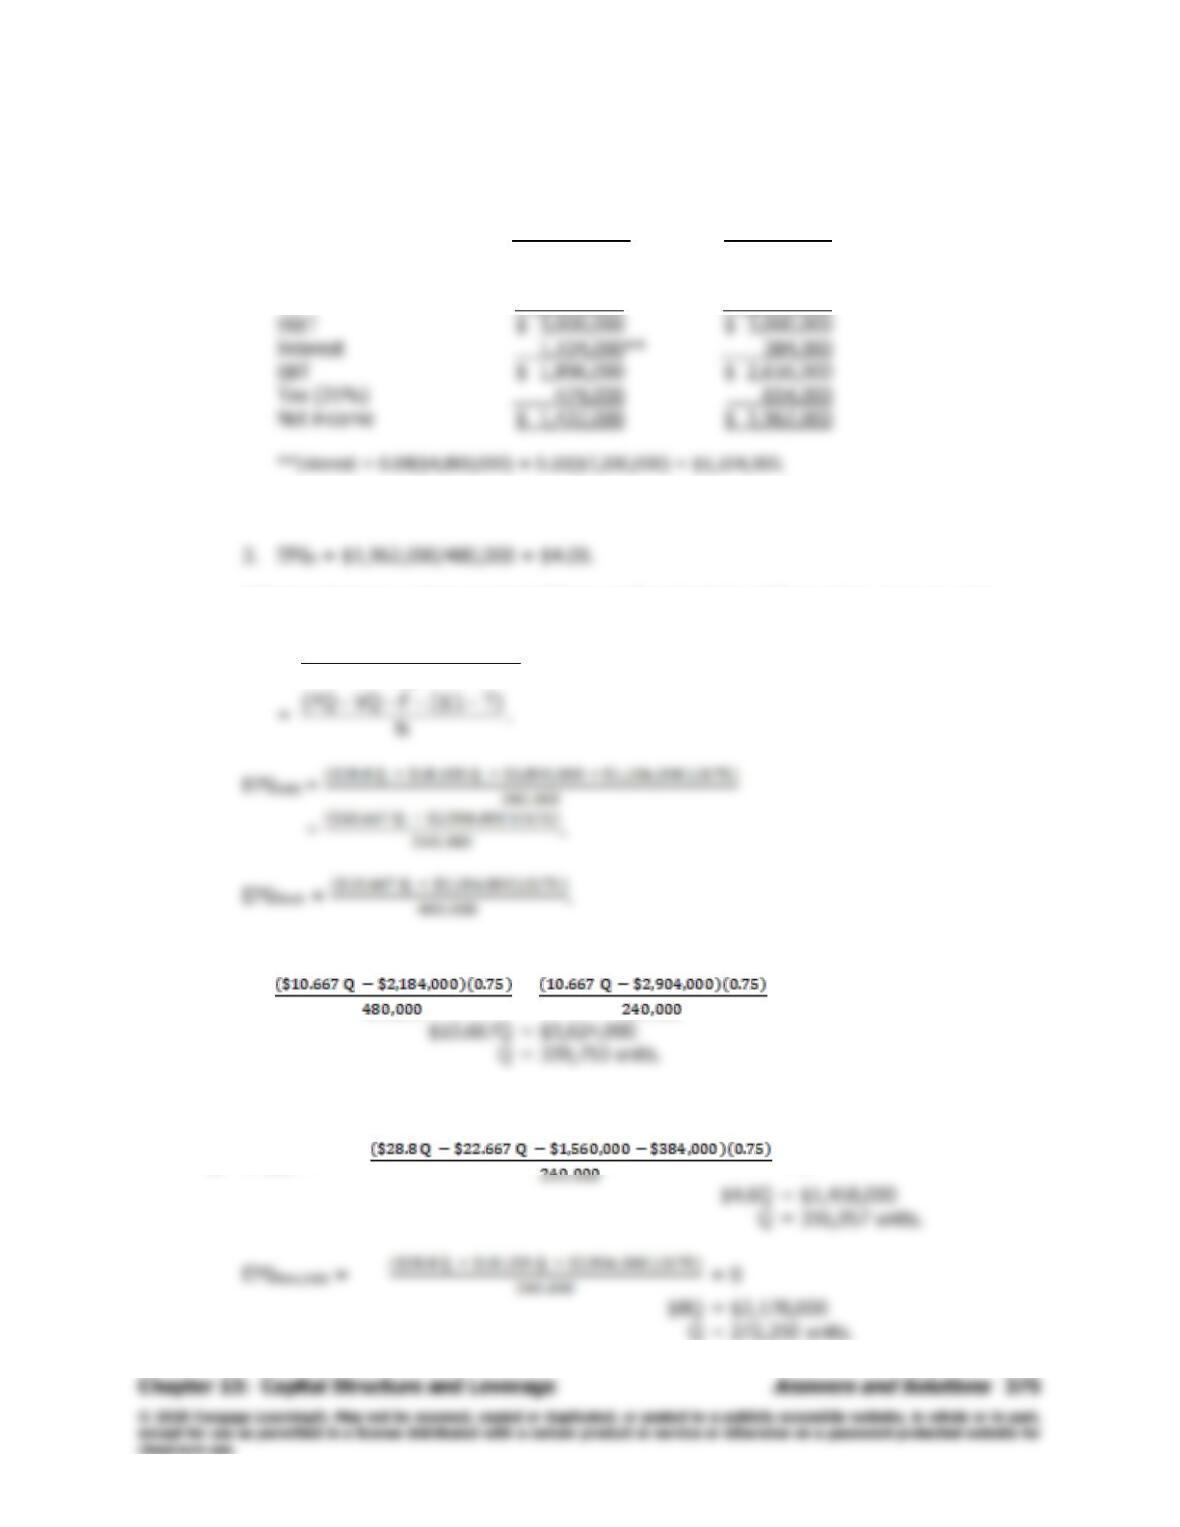
2. EPSD = $1,422,000/240,000 = $5.93.
EPS should improve, but expected EPS is significantly higher if financial leverage is used.
b. EPS =
N
T) I)(1 F VC (Sales −−−−
Therefore,
=
This is the “indifference” sales level, where EPSdebt = EPSstock.
c. EPSOld = = 0
376
Answers and Solutions
Chapter 13: Capital Structure and Leverage
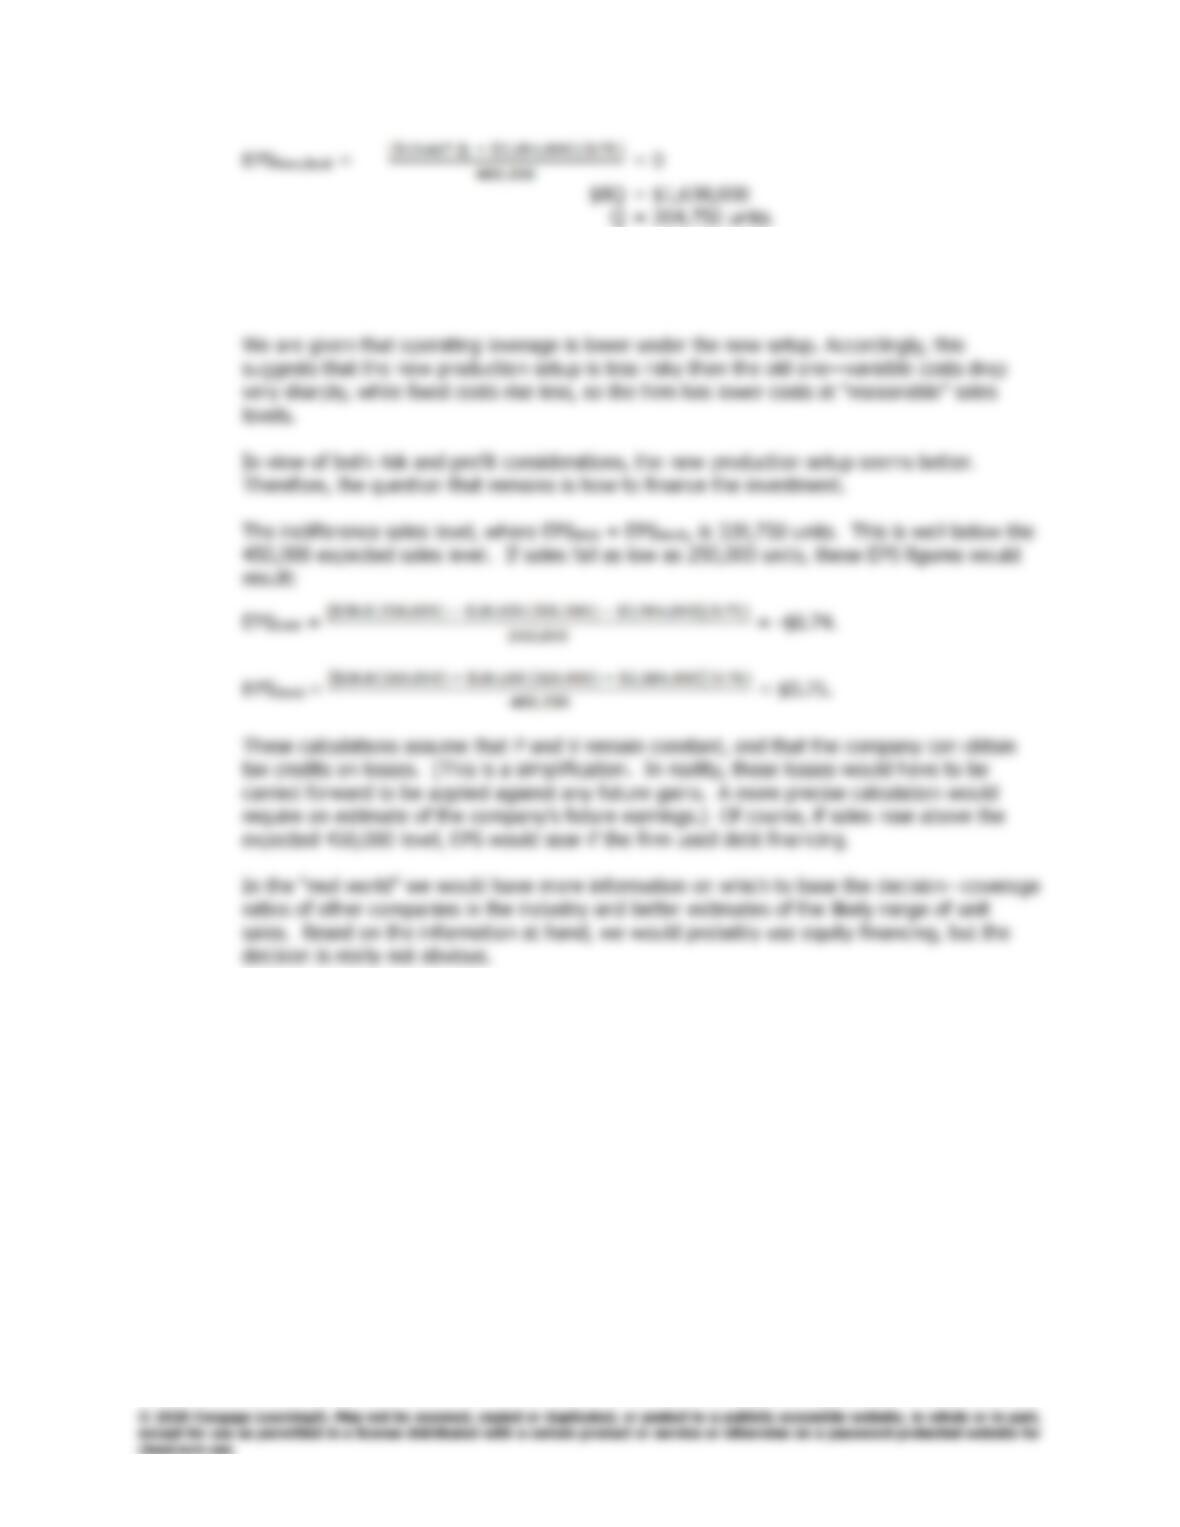
d. At the expected sales level, 450,000 units, we have these EPS values:
EPSOld Setup = $2.55. EPSNew,Debt = $5.93. EPSNew,Stock = $4.09.
Chapter 13: Capital Structure and Leverage
Answers and Solutions
377
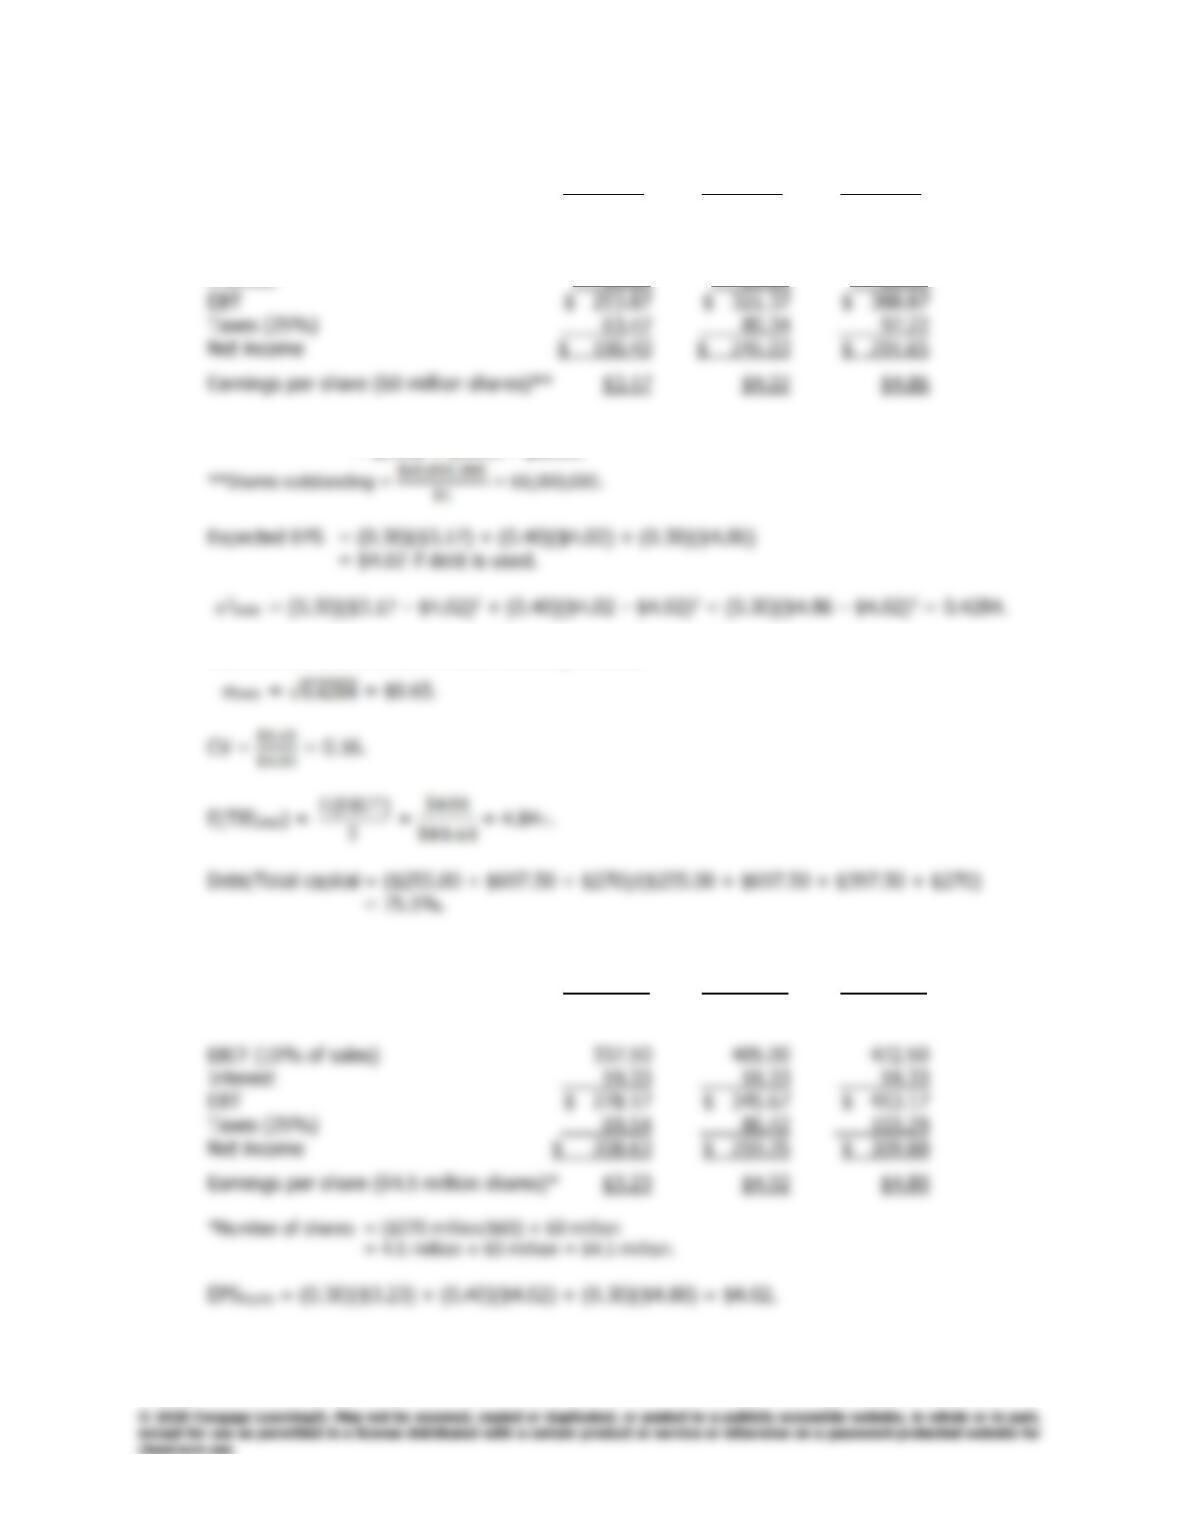
13–13 Use of debt (millions of dollars):
Probability 0.3 0.4 0.3
Sales $2,250.00 $2,700.00 $3,150.00
EBIT (15% of sales) 337.50 405.00 472.50
Interest* 83.63 83.63 83.63
*Interest on debt = ($270 0.09) + Current interest expense
= $24.30 + $59.33 = $83.63.
Standard deviation of EPS if debt financing is used:
Use of stock (millions of dollars):
Probability 0.3 0.4 0.3
Sales $2,250.00 $2,700.00 $3,150.00
capital Total
Debt
=
270$50.397$50.697$00.255$
50.697$ + 00.255$
+++
=
00.620,1$
50.952$
= 58.8%.
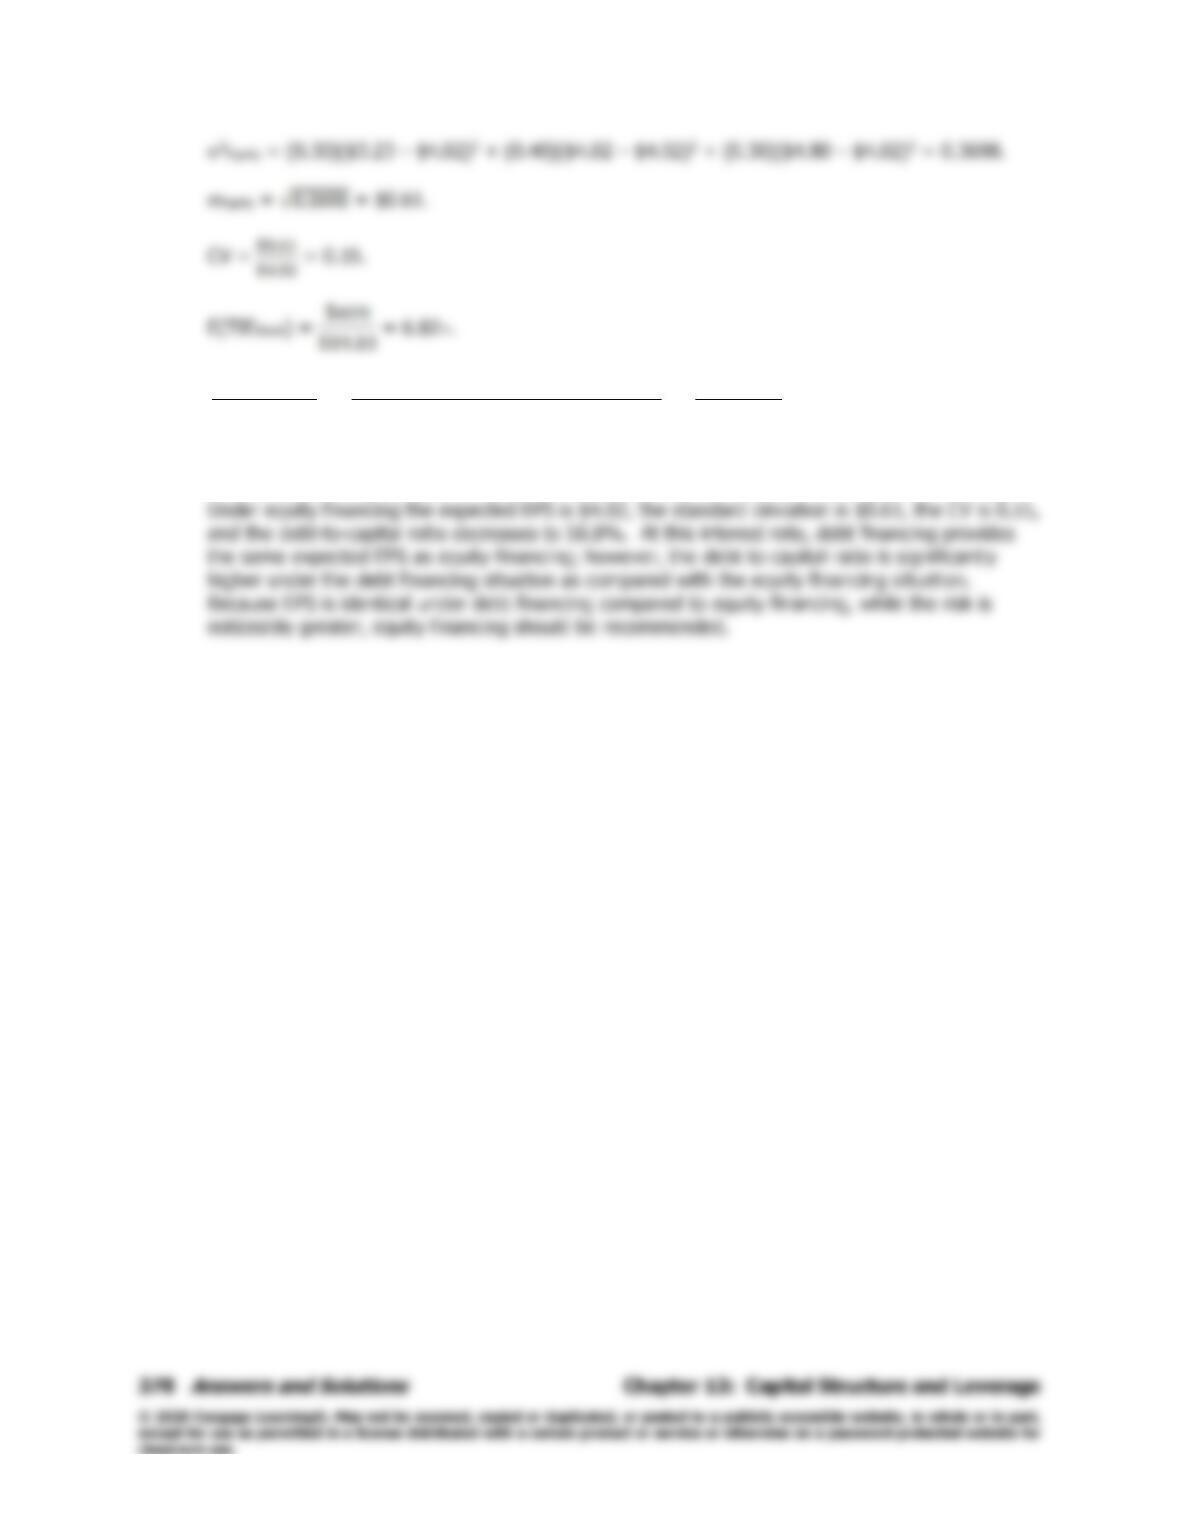
Under debt financing the expected EPS is $4.02, the standard deviation is $0.65, the CV is 0.16,
and the debt-to-capital ratio increases to 75.5%. (The debt-to-capital ratio had been 70.6%.)
Chapter 13: Capital Structure and Leverage
Comprehensive/Spreadsheet Problem
379
Comprehensive/Spreadsheet Problem
Note to Instructors:
The solution to this problem is not provided to students at the back of their text. Instructors
can access the
Excel
file on the textbook’s website.
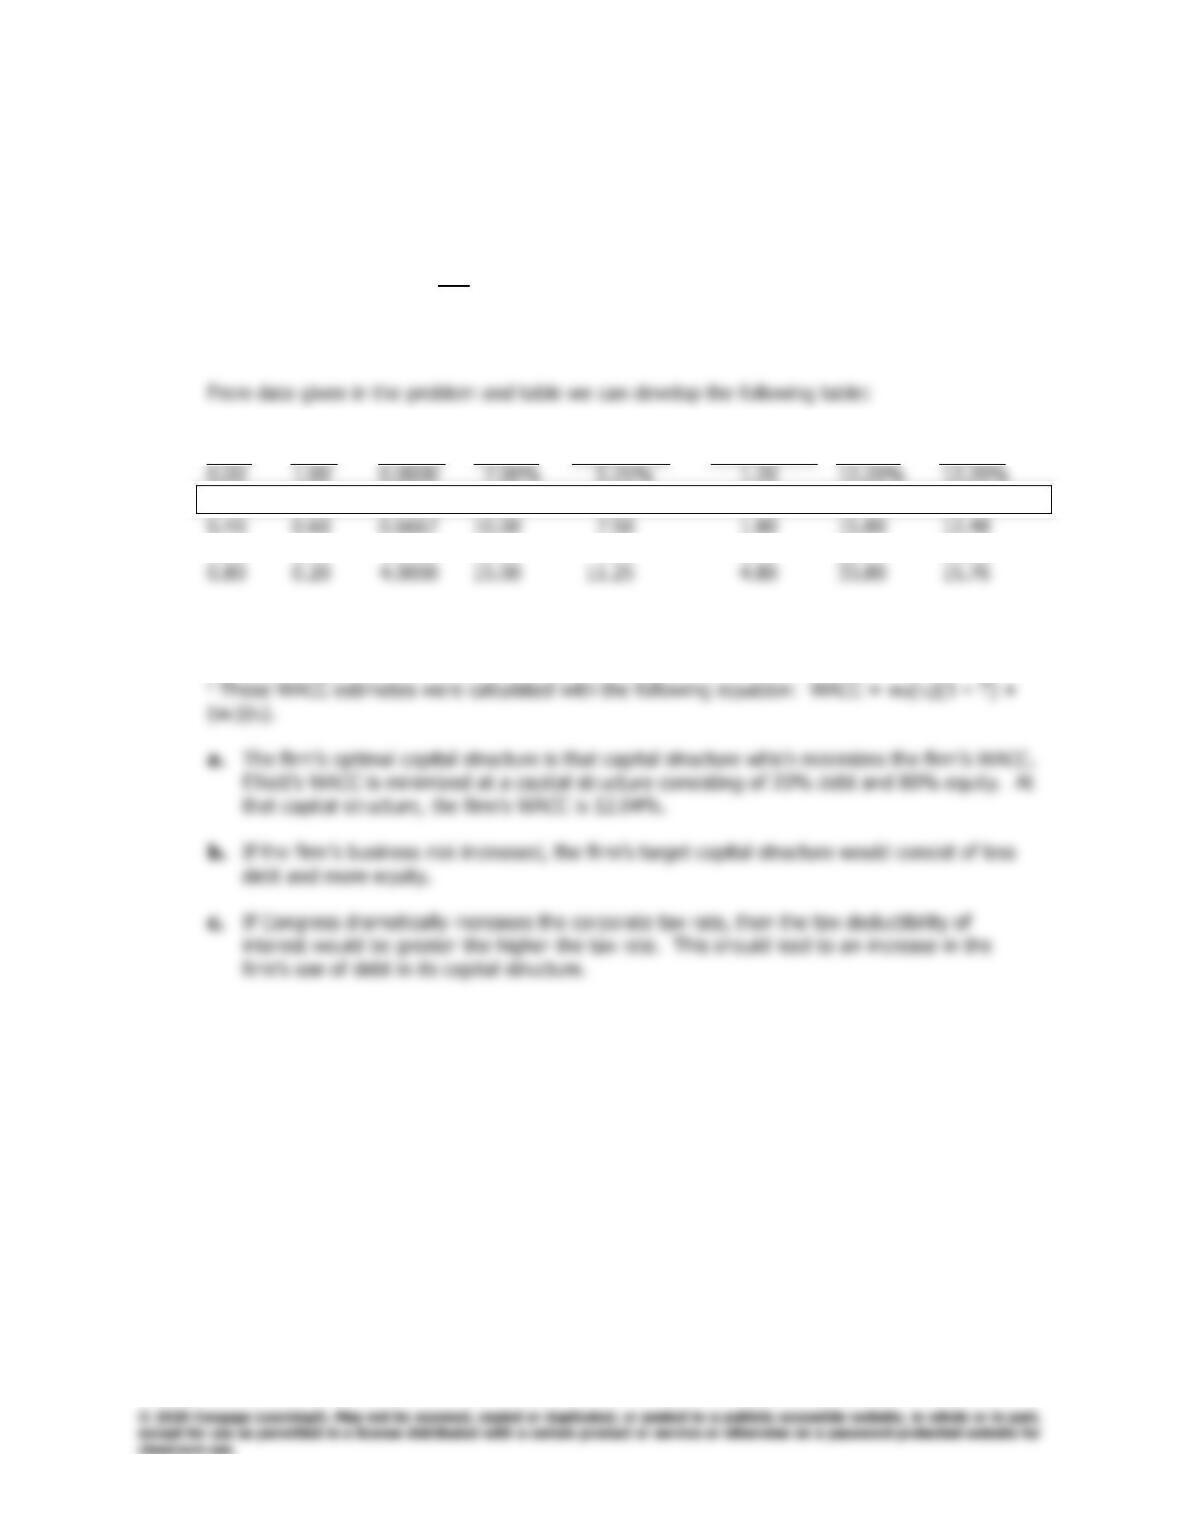
13–14 Tax rate = 25%; rRF = 5.0%; bU = 1.2; rM – rRF = 6.0%
Levered
wd wc D/E rd rd(1 – T) betaa rsb WACCc
0.20 0.80 0.2500 8.00 6.00 1.43 13.55 12.04
0.60 0.40 1.5000 12.00 9.00 2.55 20.30 13.52
Notes:
a These beta estimates were calculated using the Hamada equation, bL = bU[1 + (1 – T)(D/E)].
b These rs estimates were calculated using the CAPM, rs = rRF + (rM – rRF)b.
380
Comprehensive/Spreadsheet Problem
Chapter 13: Capital Structure and Leverage
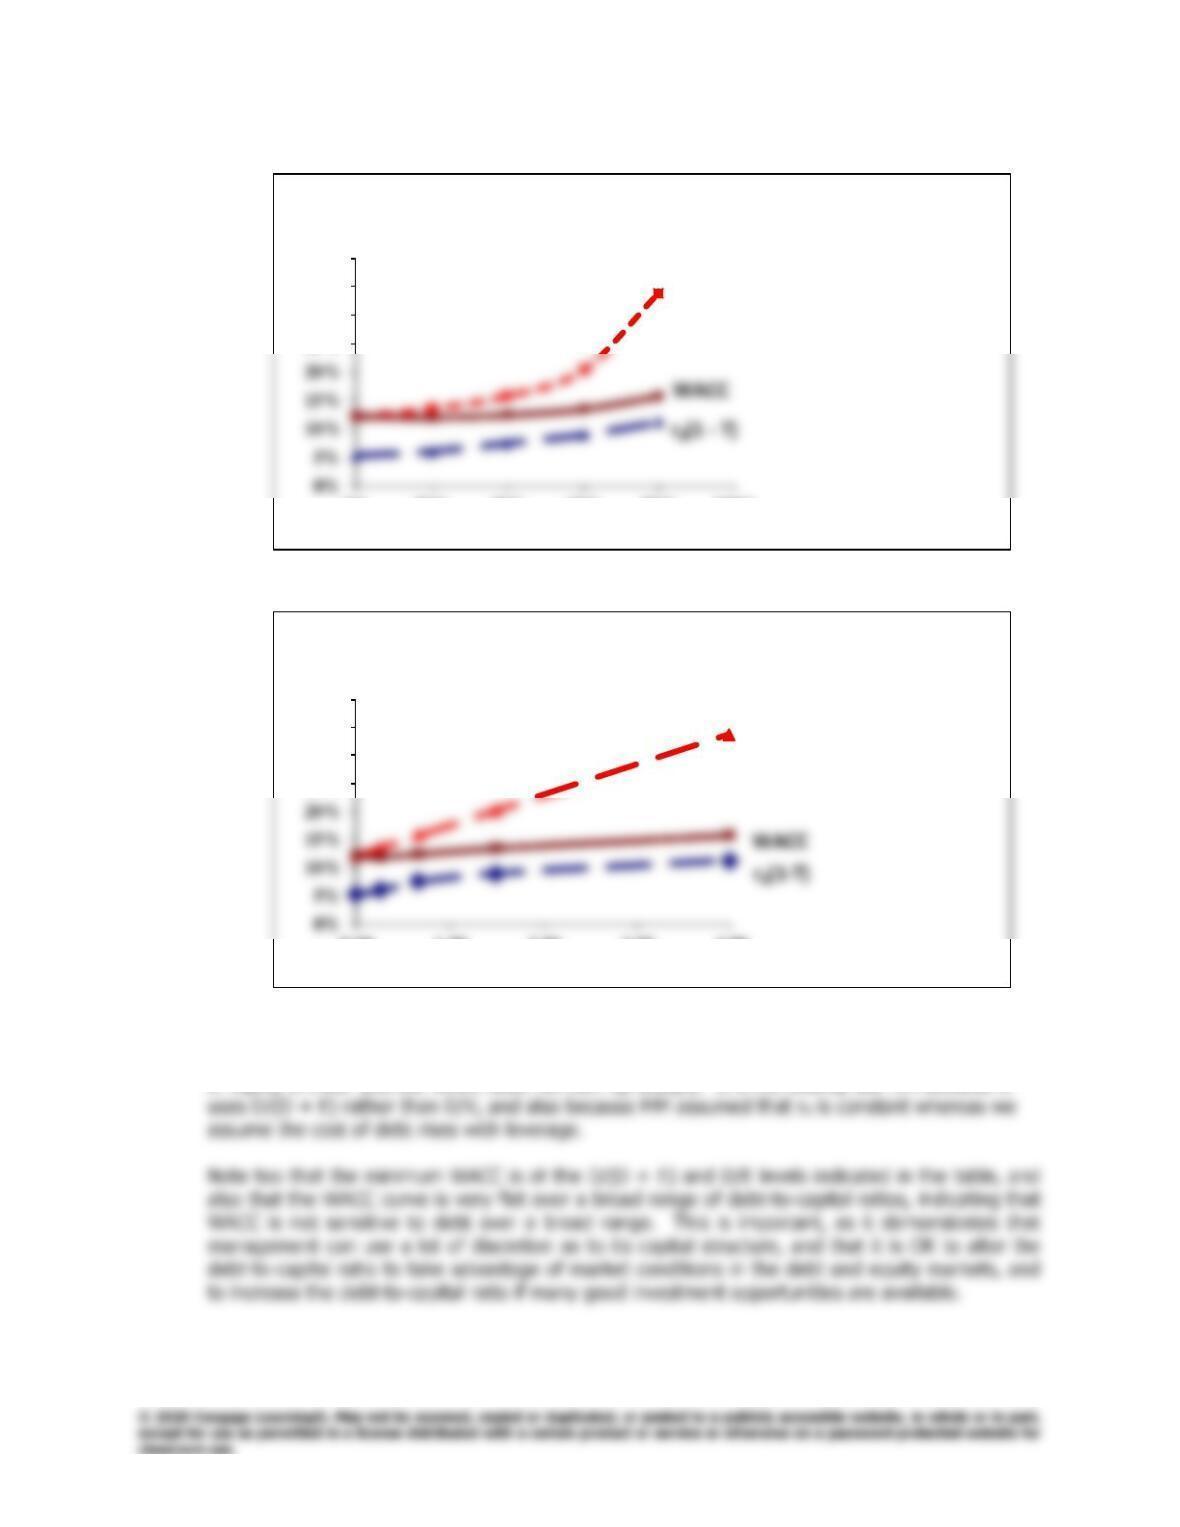
d.
25%
30%
35%
40%
0% 20% 40% 60% 80% 100%
Capital Costs Vs. D/(D+E)
rs
25%
30%
35%
40%
0.00 1.00 2.00 3.00 4.00
Capital Costs Vs. D/E
rs
The top graph is like the one in the textbook, because it uses the D/(D +E) ratio on the
horizontal axis. The bottom graph is a bit like MM showed in their original article in that the cost
of equity is linear and the WACC does not turn up sharply. It is not exactly like MM because it
13-15
Campus Deli Inc.
Optimal Capital Structure
Assume that you have just been hired as business manager of Campus Deli
(CD), which is located adjacent to the campus. Sales were $1,100,000 last
year, variable costs were 60% of sales, and fixed costs were $40,000.
CD currently has no debt—it is an all-equity firm—and its 80,000 shares
outstanding sell at a price of $25 per share, which is also the book value.
The firm’s federal-plus-state tax rate is 25%. On the basis of statements
In today’s market, the risk-free rate, rRF, is 7.5%, and the market risk
premium, RPM, is 6%. CD’s unlevered beta, bU, is 1.25. CD currently has no
debt, so its cost of equity (and WACC) is 15%. If the firm was recapitalized,