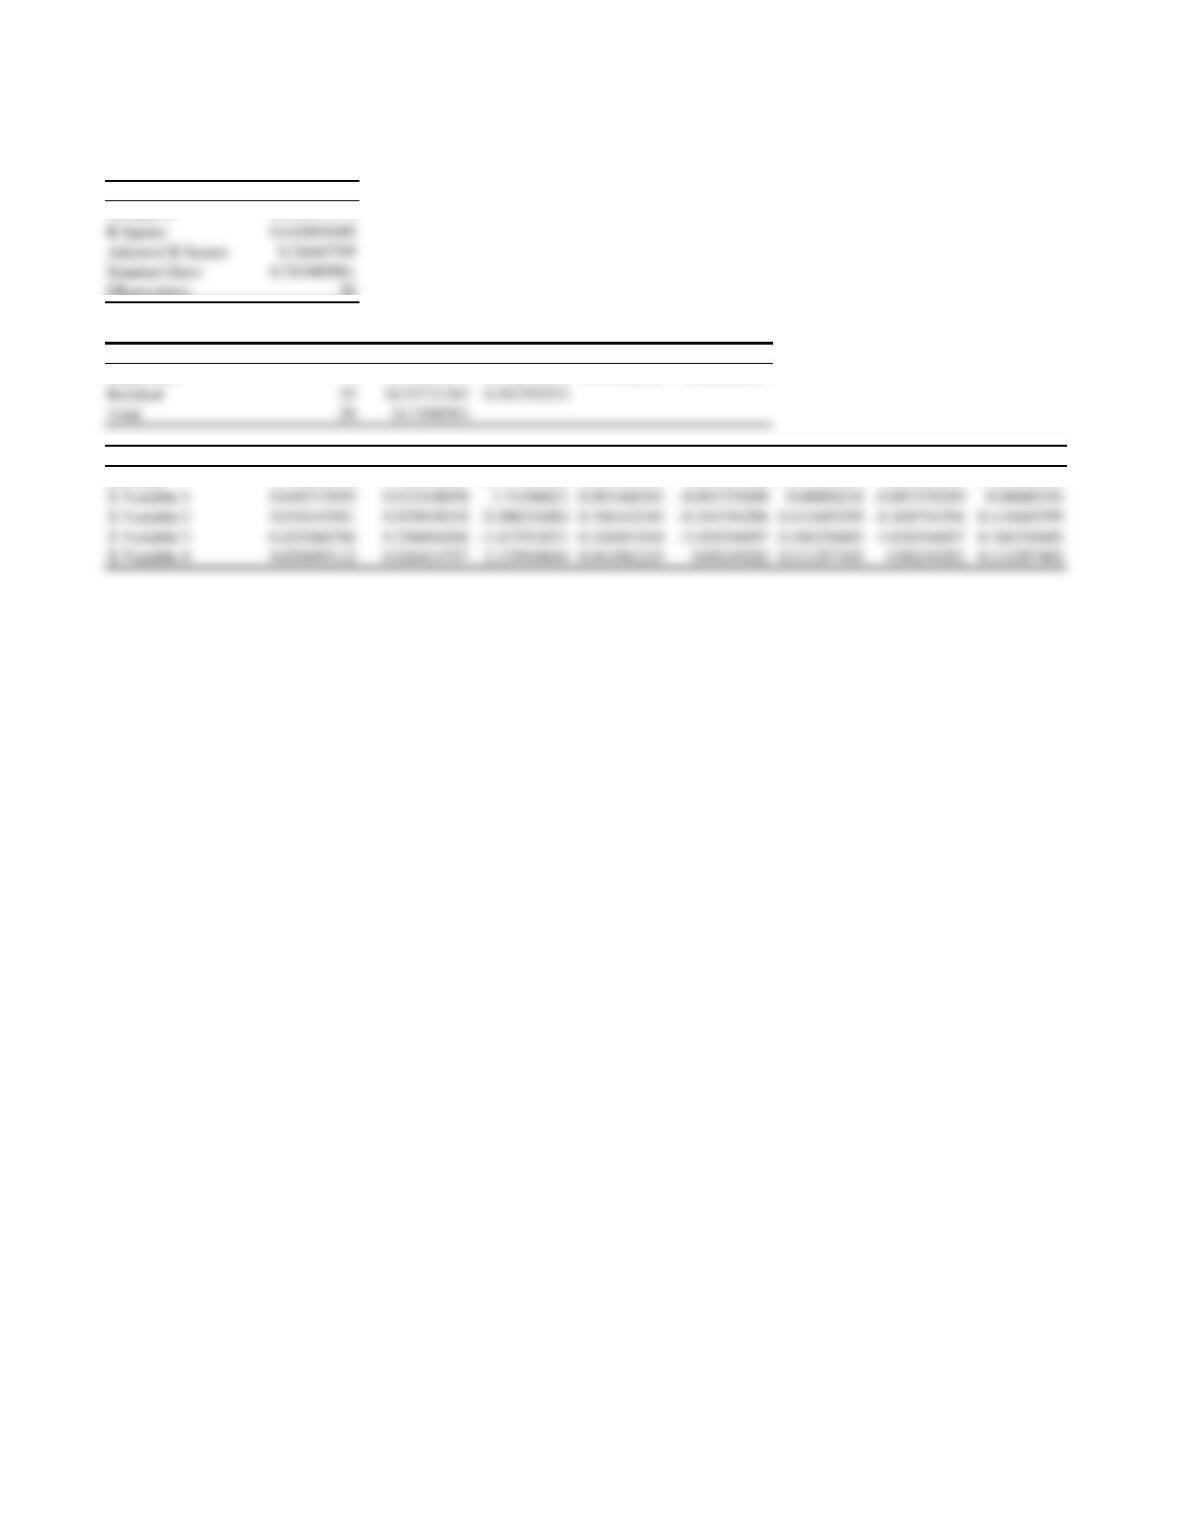
SUMMARY OUTPUT
Regression Statistics
Multiple R 0.641010174
Observations 30
ANOVA
df SS MS F Significance F
Regression 4 10.15354447 2.538386118 4.359296892 0.008228401
Coefficients Standard Error t Stat P-value Lower 95% Upper 95% Lower 95.0% Upper 95.0%
Intercept 1.740252378 0.744338843 2.337984099 0.027689595 0.207257848 3.273246908 0.207257848 3.273246908
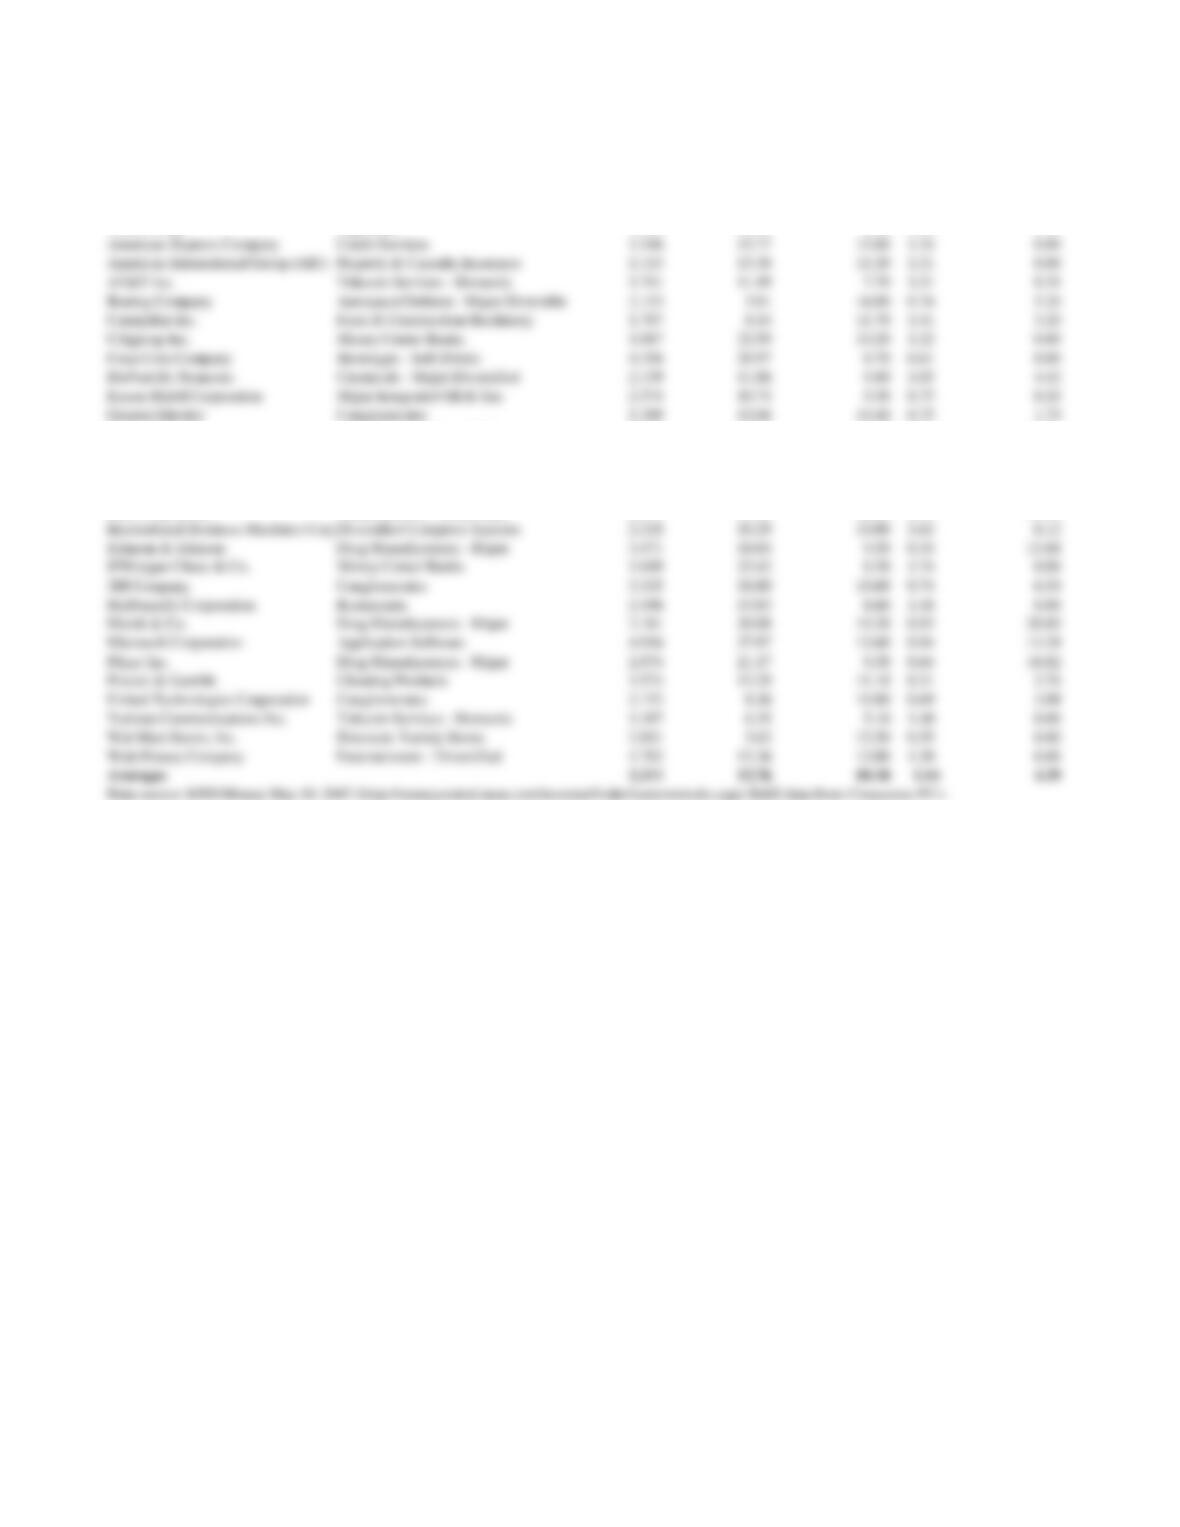
Table 12.3 Economic Determinants of Tobin’s q for the Dow Jones Industrial Average
Company Name
Industry Name
Tobin’s q
ratio
Profit Margin
(%)
5-Year Revenue
Growth (%)
Beta
R&D Intensity
(R&D/S, %)
Alcoa Inc. Aluminum 1.627 8.55 10.70 1.93 0.68
Altria Group Cigarettes 2.544 12.67 8.00 0.86 1.47
General Motors Auto Manufacturers – Major 1.035 -1.34 4.30 1.22 3.32
Hewlett-Packard Company Diversified Computer Systems 2.074 6.93 11.40 1.94 3.87
Home Depot, Inc. Home Improvement Stores 2.057 6.34 12.10 1.46 0.00
Honeywell International Inc. Conglomerates 2.088 6.76 11.60 1.64 4.39
Intel Corporation Semiconductor – Broad Line 2.973 15.08 12.20 2.11 16.64