Chapter 8: Risk and Rates of Return
Integrated Case
207
tax–exempt bonds, they would be truly riskless, but all actual
securities are exposed to some type of risk.
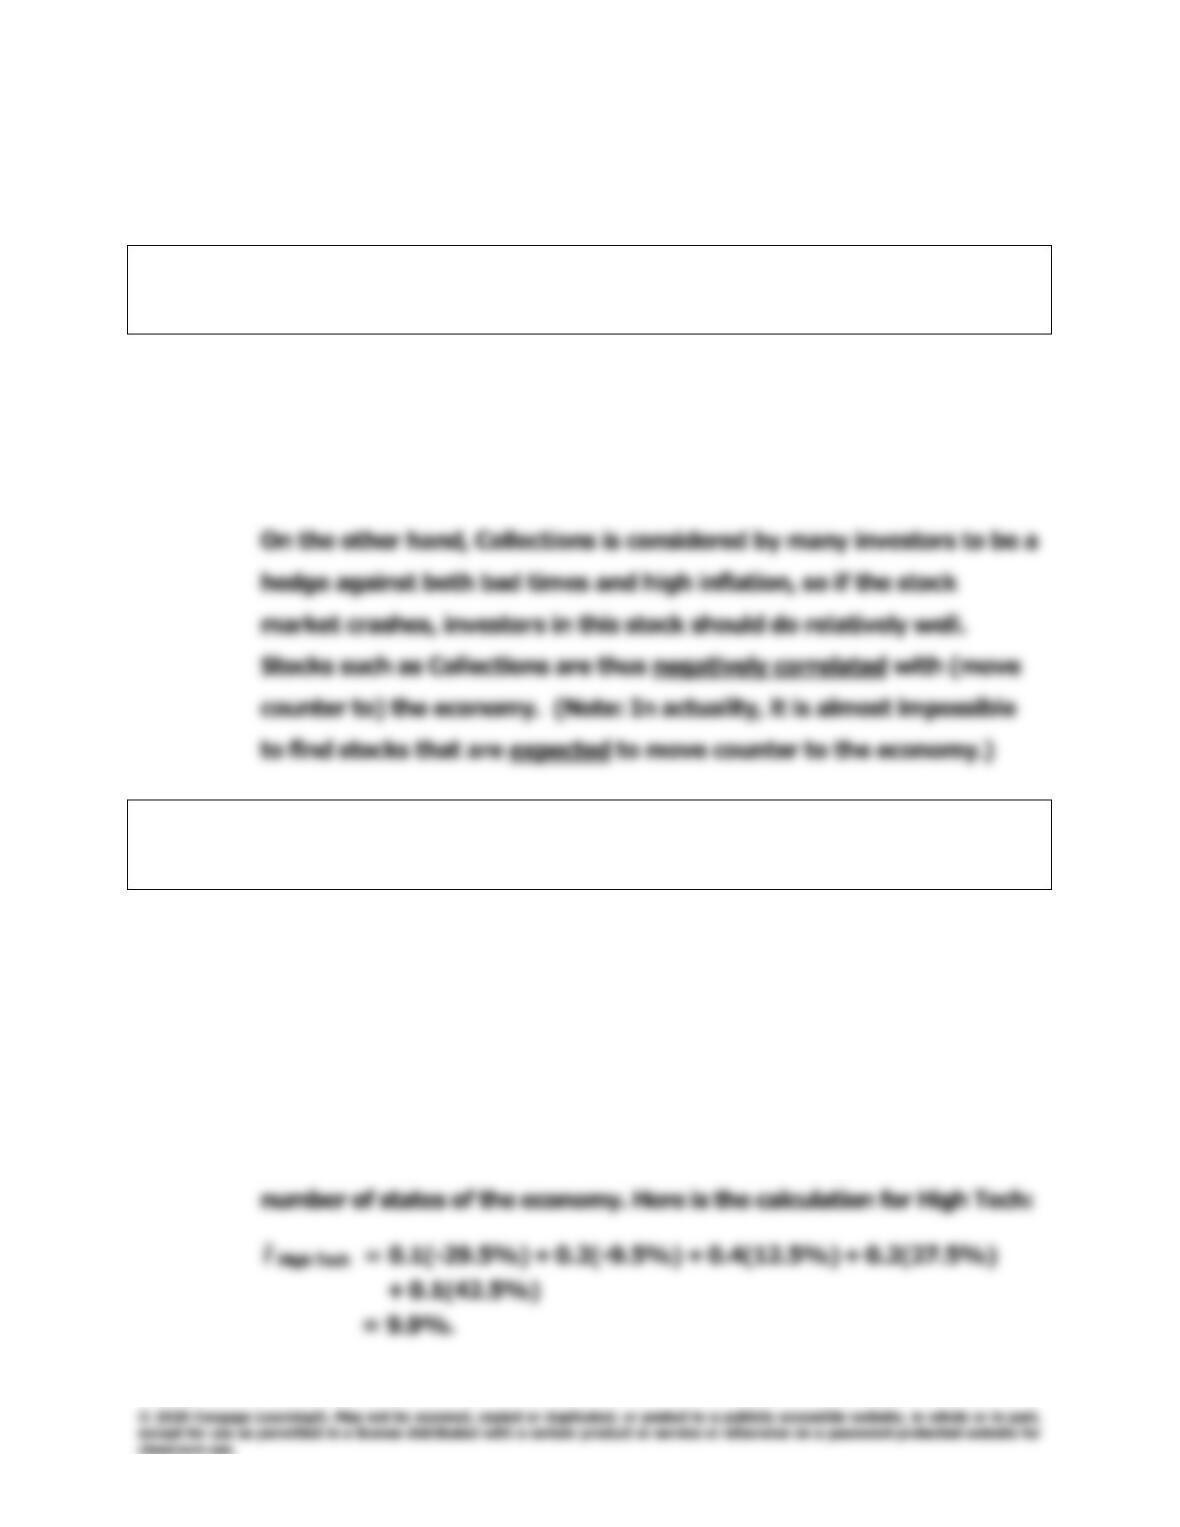
A. (2) Why are High Tech’s returns expected to move with the economy,
whereas Collections’ are expected to move counter to the economy?
Answer: [Show S8-8 here.] High Tech’s returns move with, hence are
positively correlated with, the economy, because the firm’s sales, and
hence profits, will generally experience the same type of ups and
downs as the economy. If the economy is booming, so will High Tech.
B. Calculate the expected rate of return on each alternative, and fill in
the blanks on the row for
r
ˆ
in the previous table.
Answer: [Show S8-9 and S8–10 here.] The expected rate of return,
r
ˆ
, is
expressed as follows:
=
=
N
1i
iirPr
ˆ
.
Here Pi is the probability of occurrence of the ith state, ri is the
estimated rate of return for that state of the economy, and N is the
r
ˆ
208
Integrated Case
Chapter 8: Risk and Rates of Return
We use the same formula to calculate
r
ˆ
’s for the other alternatives:
r
ˆ
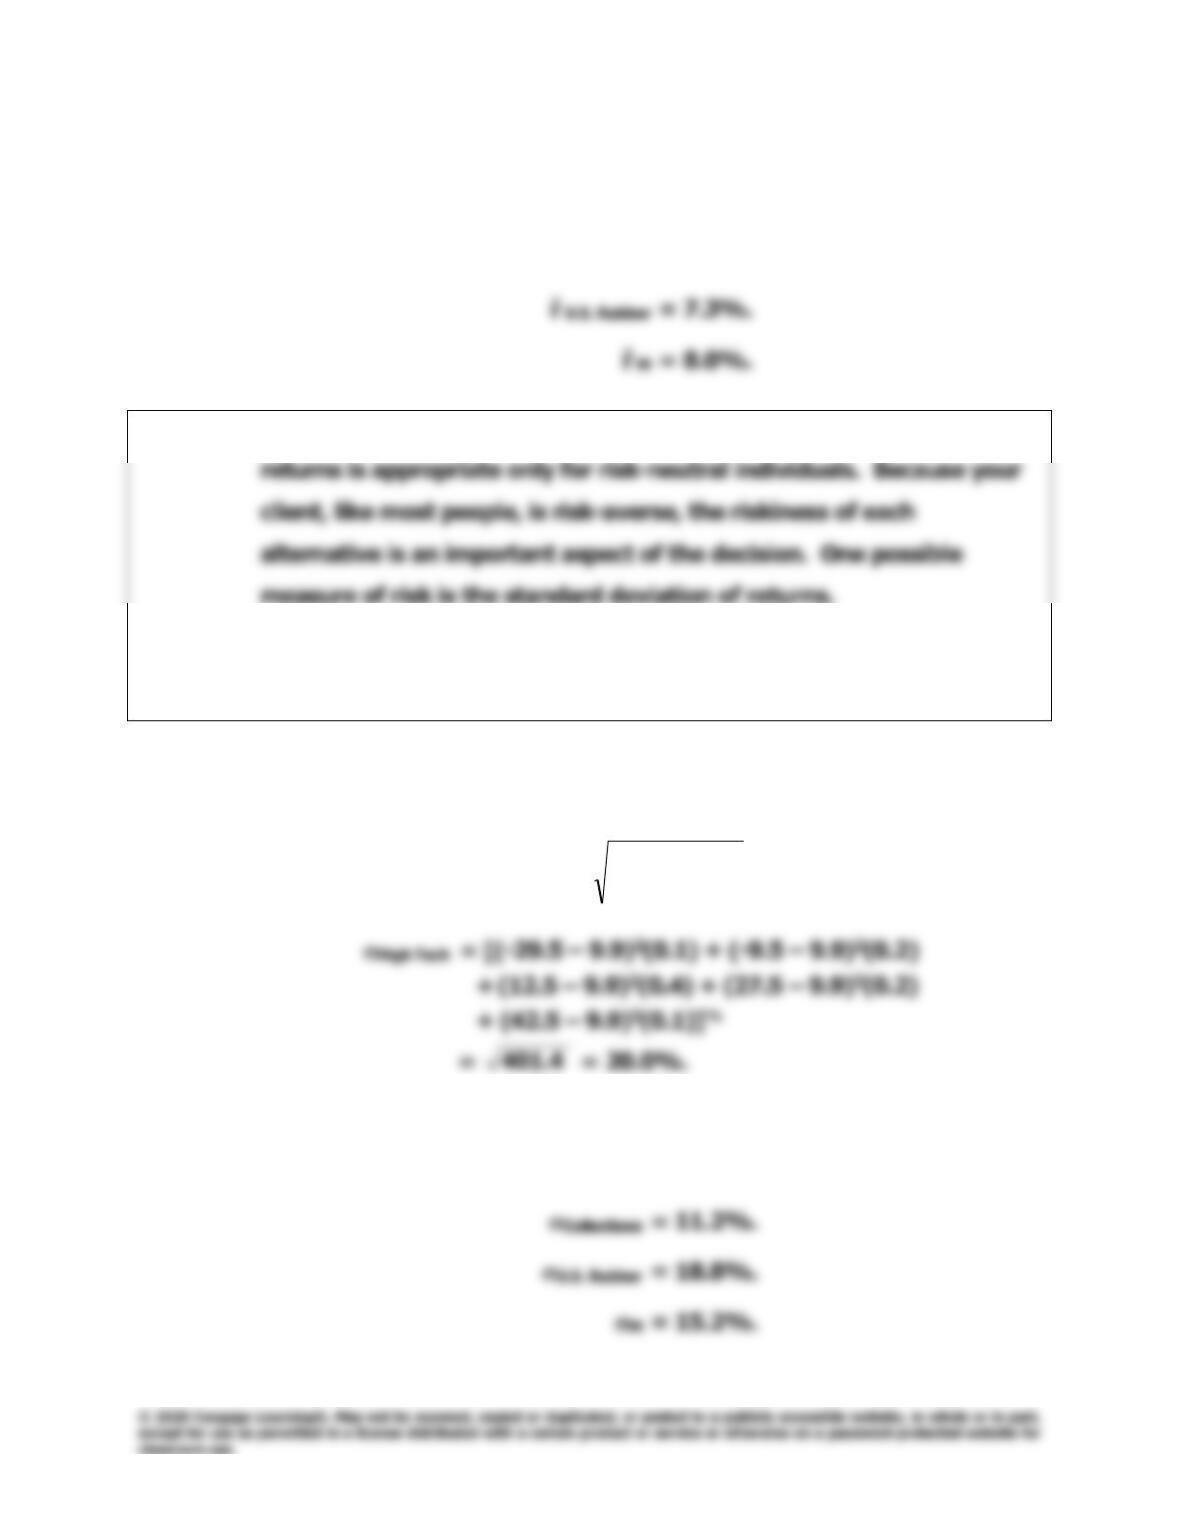
T–bills = 3.0%.
r
ˆ
Collections = 1.2%.
r
ˆ
C. You should recognize that basing a decision solely on expected
(1) Calculate this value for each alternative and fill in the blank on the
row for in the table.
Answer: [Show S8-11 and S8-12 here.] The standard deviation is calculated as
follows:
=
=
−
N
1i
i
2
iP)r
ˆ
r(
.
Here are the standard deviations for the other alternatives:
T–bills = 0.0%.
Chapter 8: Risk and Rates of Return
Integrated Case
209
C. (2) What type of risk is measured by the standard deviation?
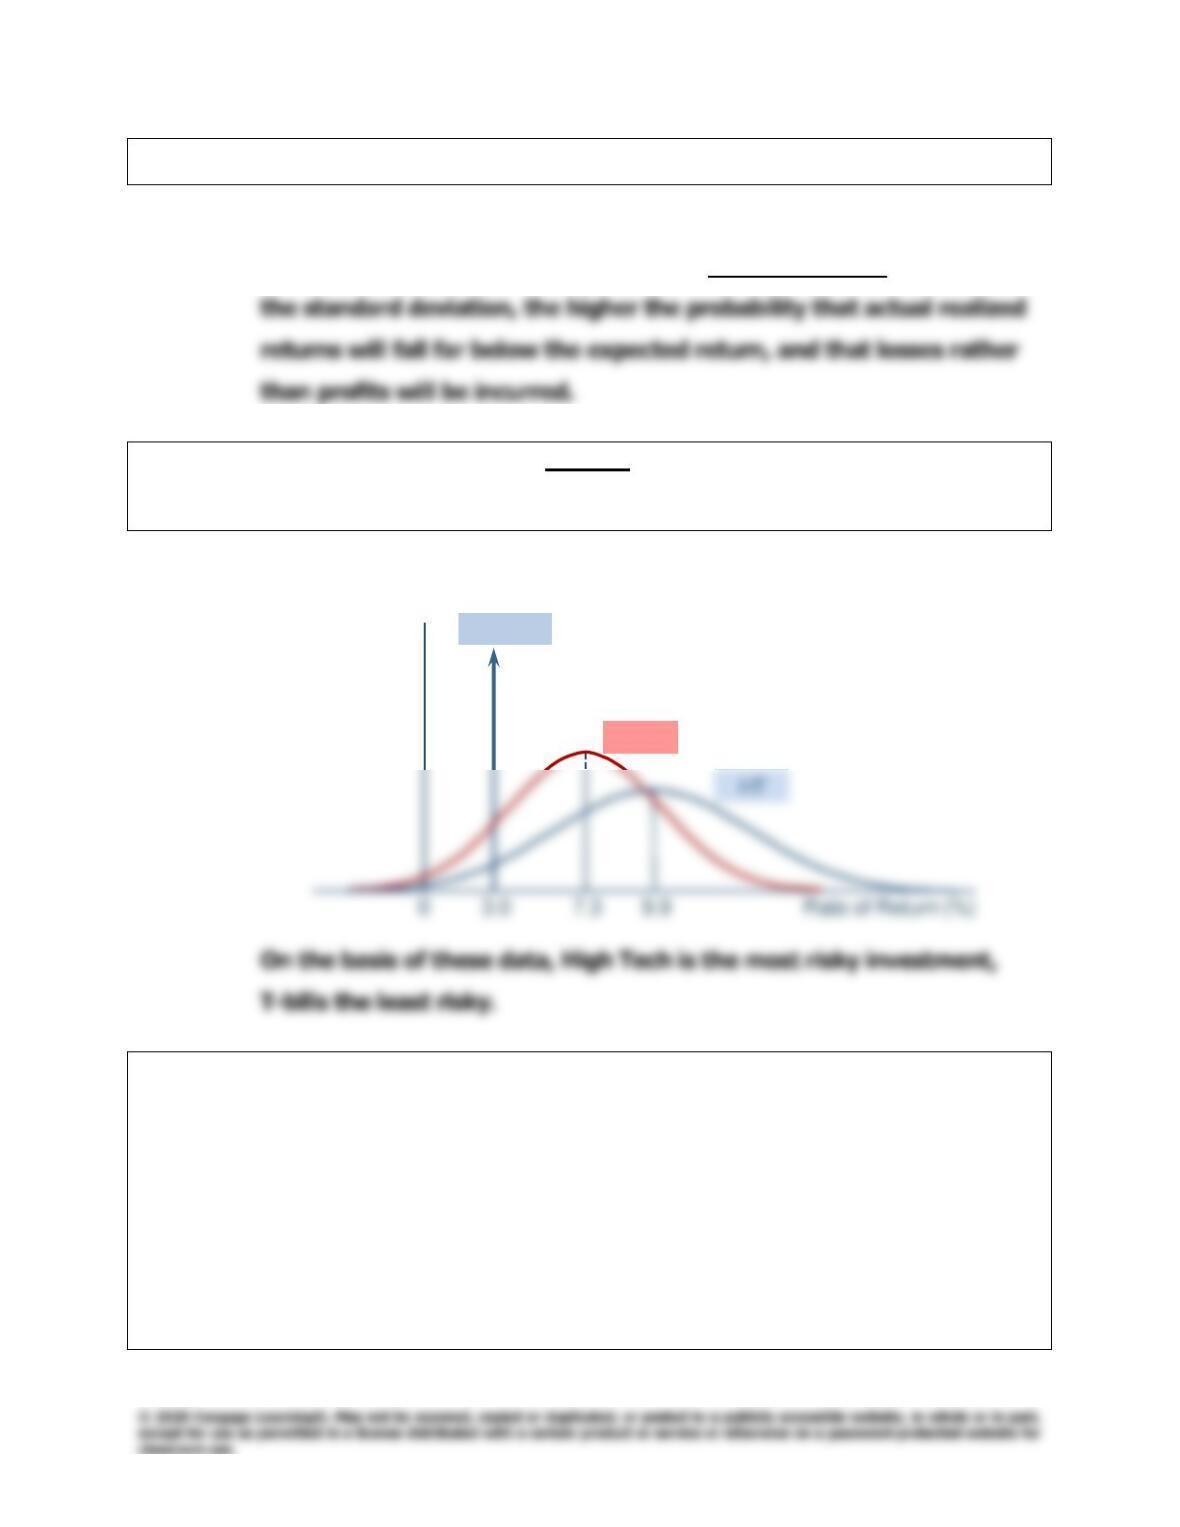
Answer: [Show S8-13 through S8-15 here.] The standard deviation is a
measure of a security’s (or a portfolio’s) stand-alone risk. The larger
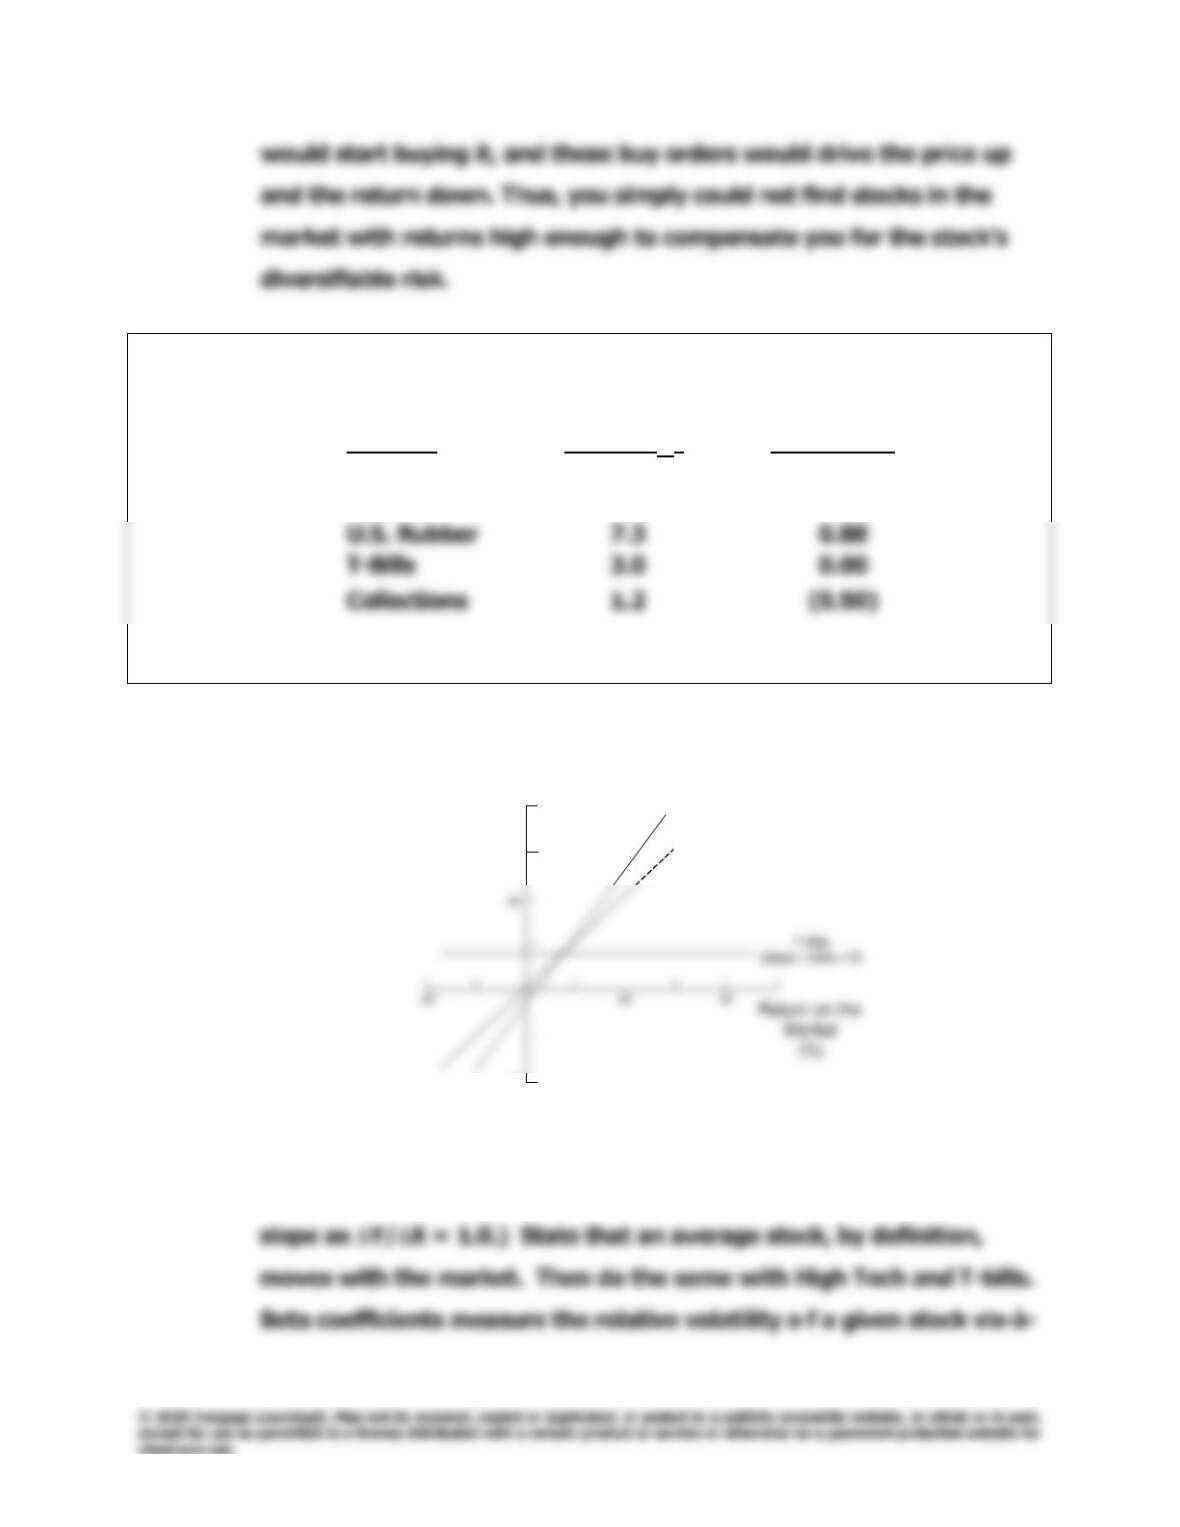
C. (3) Draw a graph that shows roughly the shape of the probability
distributions for High Tech, U.S. Rubber, and T-bills.
Answer:
USR
Prob.
T-bills
D. Suppose you suddenly remembered that the coefficient of variation
(CV) is generally regarded as being a better measure of stand-alone
risk than the standard deviation when the alternatives being
considered have widely differing expected returns. Calculate the
missing CVs, and fill in the blanks on the row for CV in the table.
Does the CV produce the same risk rankings as the standard
deviation? Explain.

210
Integrated Case
Chapter 8: Risk and Rates of Return
Answer: [Show S8-16 through S8-18 here.] The coefficient of variation (CV) is
a standardized measure of dispersion about the expected value; it
shows the amount of risk per unit of return.
CV = /
r
ˆ
.
CVT–bills = 0.0%/3.0% = 0.0.
CVM = 15.2%/8.0% = 1.9.
r
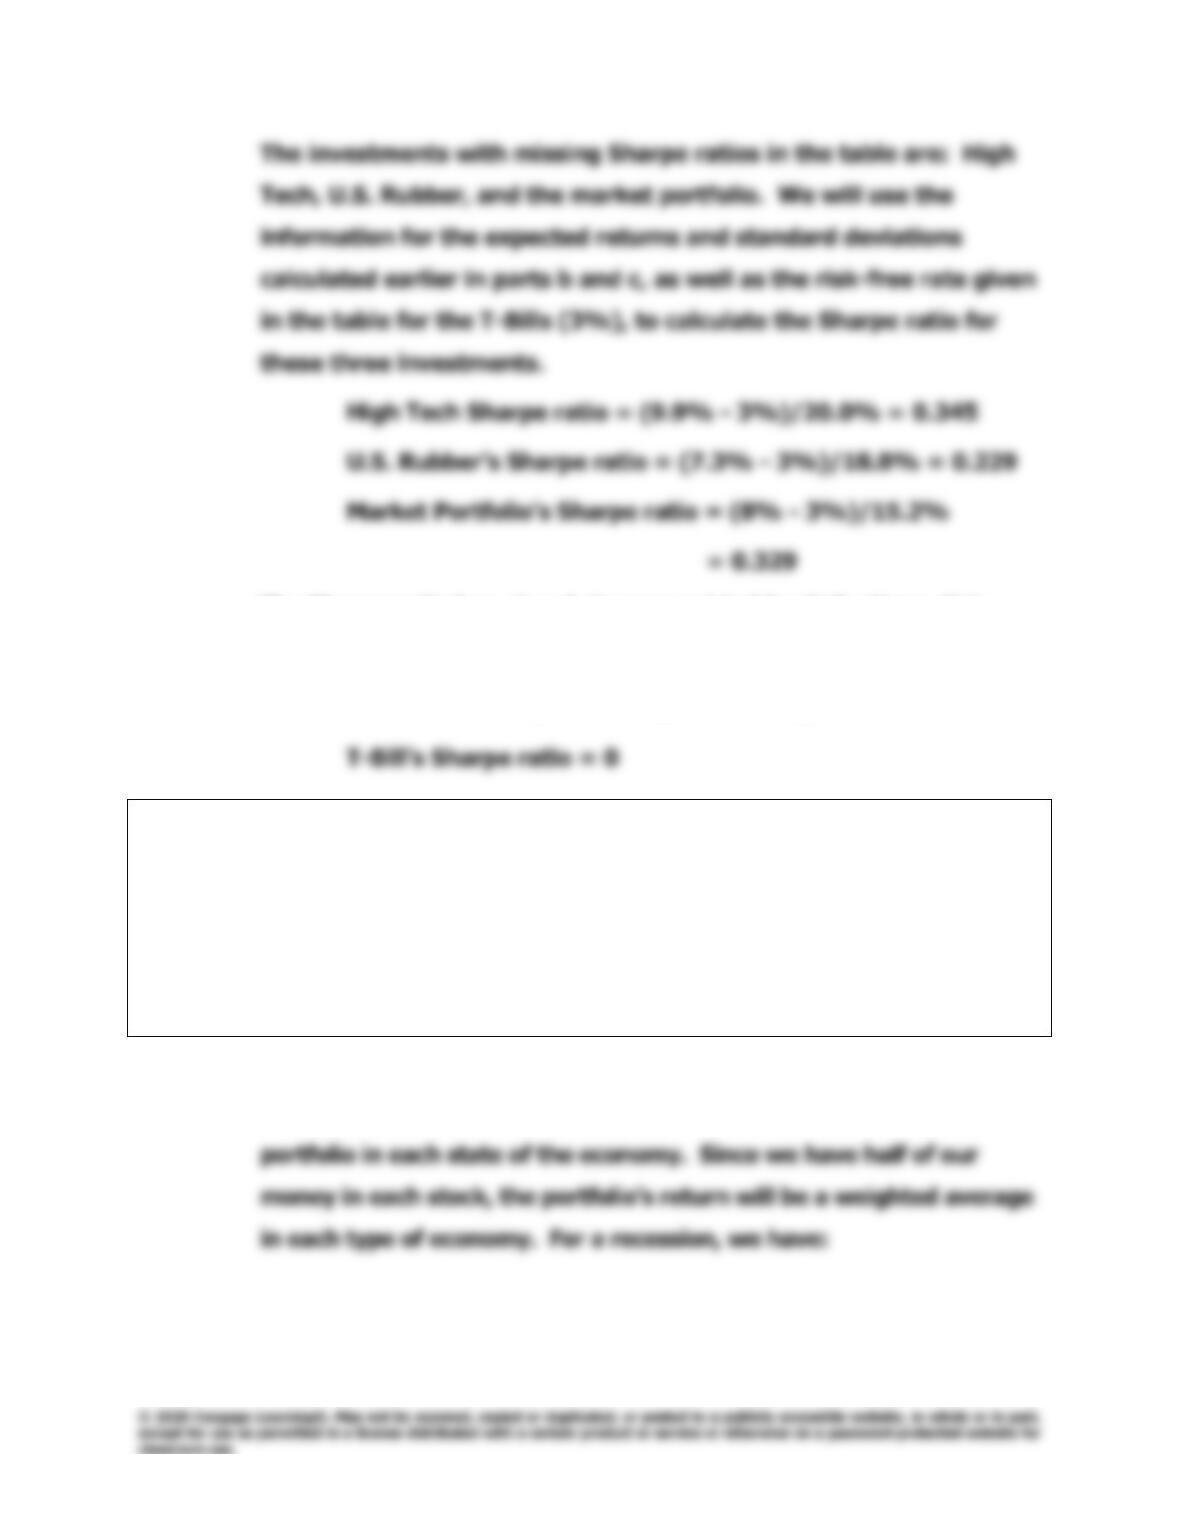
E. Someone mentioned that you might also want to calculate the Sharpe
ratio as a measure of stand-alone risk. Calculate the missing ratios
and fill in the blanks on the row for the Sharpe ratio in the table.
Briefly explain what the Sharpe ratio actually measures.
Answer: [Show S8-19 here.] The Sharpe ratio is a measure of stand-alone
risk that compares the asset’s realized excess return to its standard
deviation over a specified period. An investment with a higher ratio
Chapter 8: Risk and Rates of Return
Integrated Case
211
The Sharpe ratio has already been provided for Collections. It is
calculated follows:
Collections’ Sharpe ratio = (1.2% – 3%)/11.2% = -0.161
F. Suppose you created a two–stock portfolio by investing $50,000 in
High Tech and $50,000 in Collections.
(1) Calculate the expected return (
p
r
ˆ
), the standard deviation (p), and
the coefficient of variation (CVp), and the Sharpe ratio for this
portfolio and fill in the appropriate blanks in the table.
Answer: [Show S8-20 through S8-25 here.] To find the expected rate of return
on the two-stock portfolio, we first calculate the rate of return on the
212
Integrated Case
Chapter 8: Risk and Rates of Return
rp = 0.5(-29.5%) + 0.5(24.5%) = –2.5%. We would do similar
calculations for the other states of the economy, and obtain these
results:
State
Portfolio
Recession
–2.5%
Below average
Average
Above average
Now we can multiply the probability times the outcome in each state
of the economy to calculate the expected return on this two-stock
portfolio, 5.5%.
Alternatively, we could apply this formula,
It is tempting to find the standard deviation of the portfolio as
the weighted average of the standard deviations of the individual
securities, as follows:
However, this is not correct—it is necessary to use a different formula, the
one for that we used earlier, applied to the two–stock portfolio’s returns.
The portfolio’s depends jointly on (1) each security’s and (2)
p = [(-2.5 – 5.5)2(0.1) + (0.5 – 5.5)2(0.2) + (5.8 – 5.5)2(0.4)
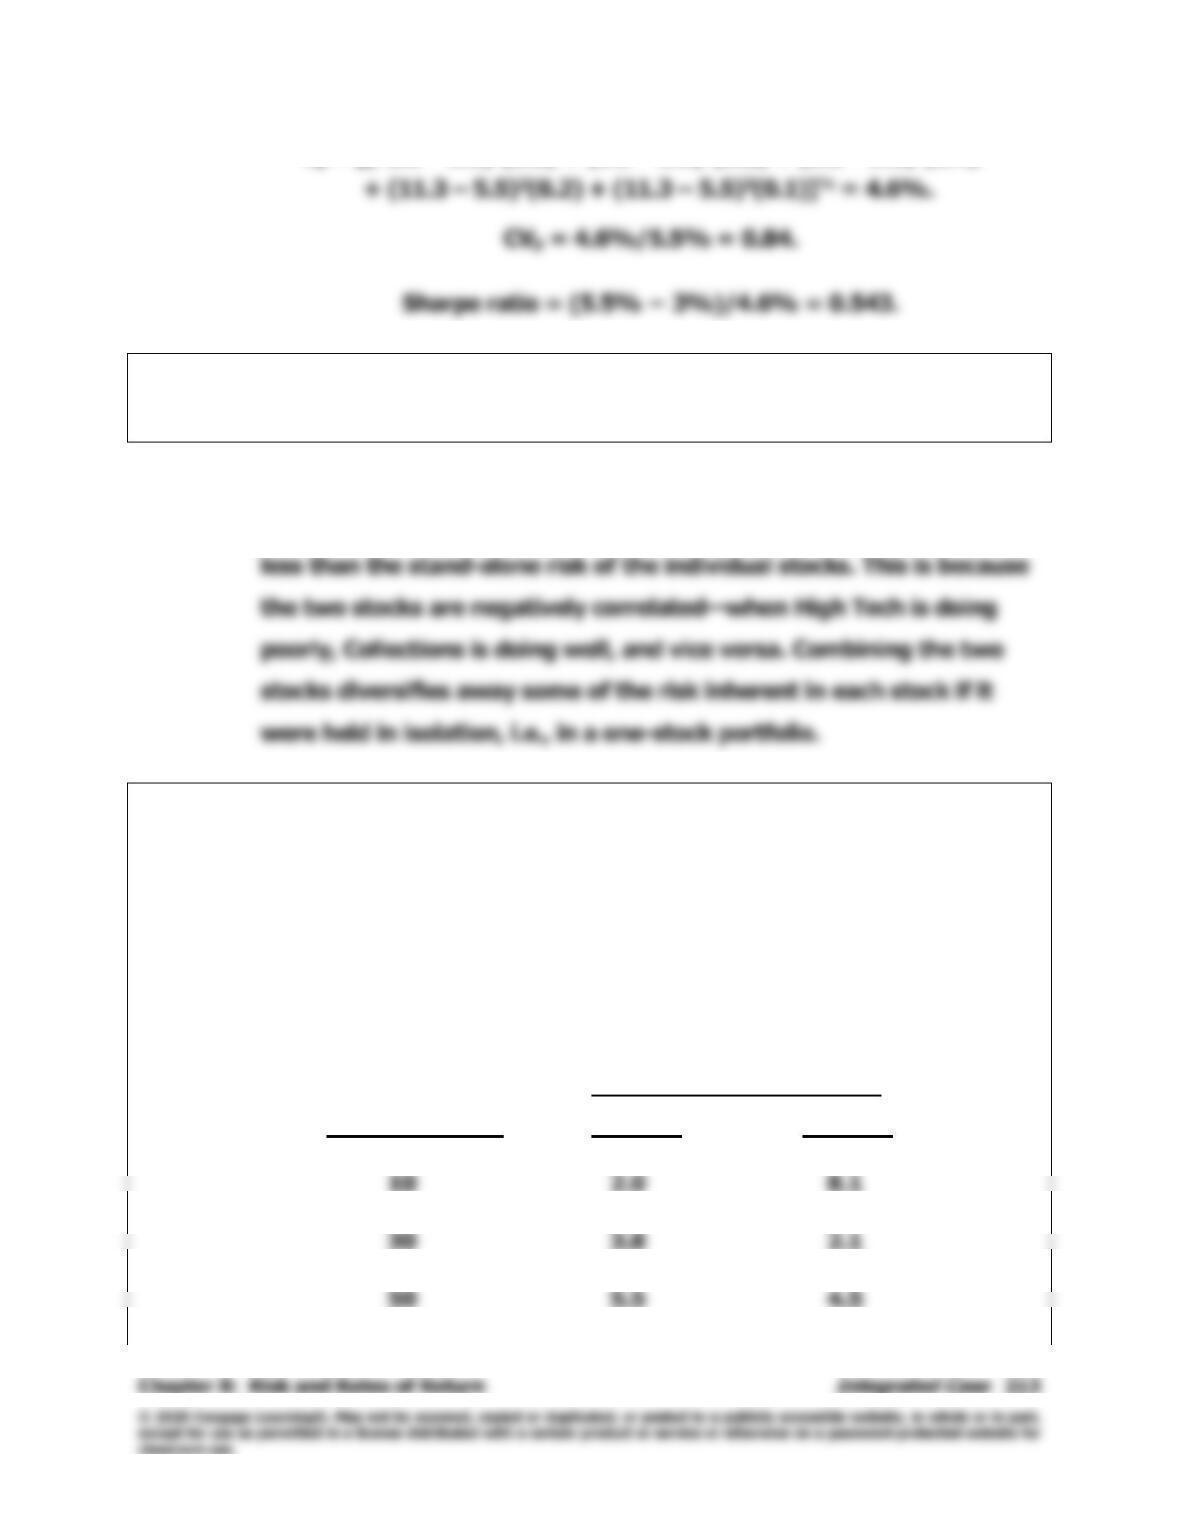
F. (2) How does the riskiness of this two-stock portfolio compare with the
riskiness of the individual stocks if they were held in isolation?
Answer: [Show S8-26 through S8-29 here.] Using either or CV as our stand-
alone risk measure, the stand-alone risk of the portfolio is significantly
Optional Question
Does the expected rate of return on the portfolio depend on the percentage of
the portfolio invested in each stock? What about the riskiness of the portfolio?
Answer: Using a spreadsheet model, it’s easy to vary the composition of the
portfolio to show the effect on the portfolio’s expected rate of return
and standard deviation:
High Tech Plus Collections
% in High Tech
0% 1.2% 11.2%
20 2.9 5.1
40 4.7 1.7
60 6.4 7.6
p
r
ˆ
p

214
Integrated Case
Chapter 8: Risk and Rates of Return
70 7.3 10.7
90 9.0 16.9
100 9.9 20.0
The expected rate of return on the portfolio is merely a linear
combination of the two stock’s expected rates of return. However,
portfolio risk is another matter. p begins to fall as High Tech and
G. Suppose an investor starts with a portfolio consisting of one
randomly selected stock.
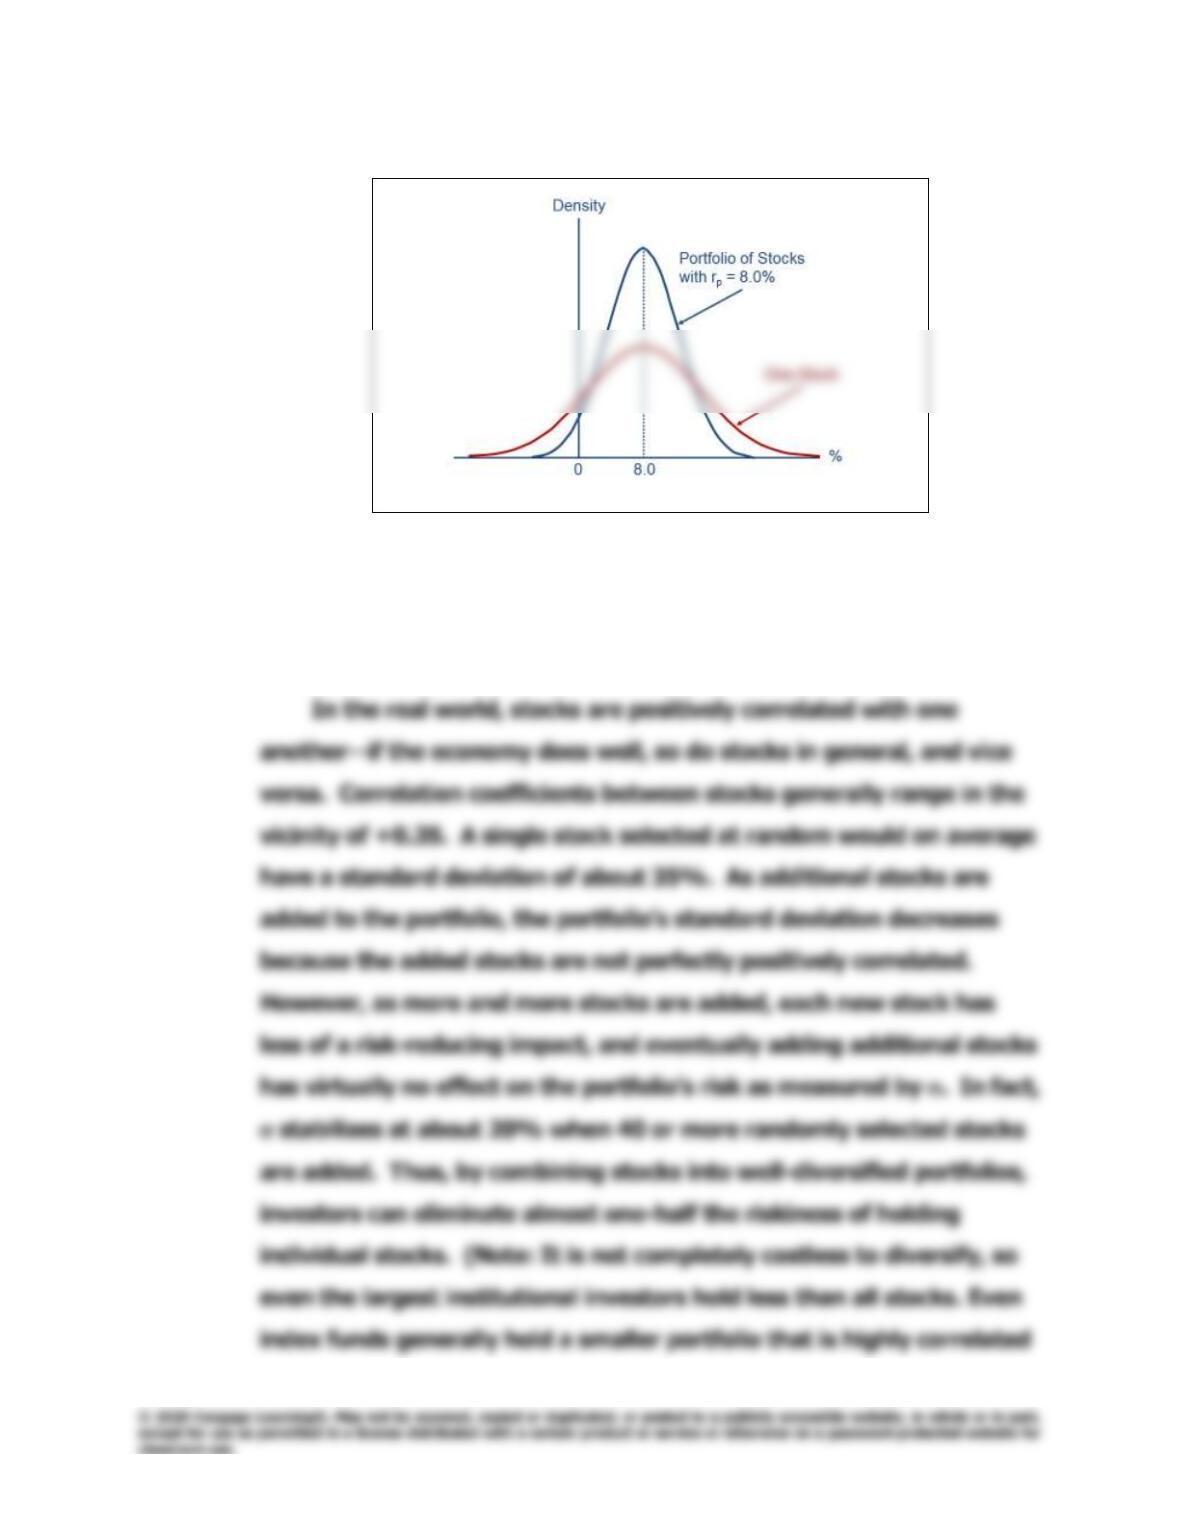
(1) What would happen to the riskiness and to the expected return of
the portfolio as more randomly selected stocks were added to the
portfolio?
Chapter 8: Risk and Rates of Return
Integrated Case
215
Answer: [Show S8-30 and S8-31 here.]
The standard deviation gets smaller as more stocks are combined in
the portfolio, while rp (the portfolio’s return) remains constant. Thus,
by adding stocks to your portfolio, which initially started as a 1-stock
portfolio, risk has been reduced.
216
Integrated Case
Chapter 8: Risk and Rates of Return
with an index such as the S&P 500 rather than holding all the stocks
in the index.)
H. (1) Should the effects of a portfolio impact the way investors think about
the riskiness of individual stocks?
Answer: [Show S8-32 here.] Portfolio diversification does affect investors’
views of risk. A stock’s stand–alone risk as measured by its , CV, or
the Sharpe ratio may be important to an undiversified investor, but it
H. (2) If you decided to hold a one–stock portfolio (and consequently were
exposed to more risk than diversified investors), could you expect to be
compensated for all of your risk; that is, could you earn a risk premium
on the part of your risk that you could have eliminated by diversifying?
Answer: [Show S8-33 here.] If you hold a one-stock portfolio, you will be
exposed to a high degree of risk, but you won’t be compensated for it.
Chapter 8: Risk and Rates of Return
Integrated Case
217
I. The expected rates of return and the beta coefficients of the alternatives
supplied by Merrill Finch’s computer program are as follows:
Security Return (
r
ˆ
) Risk (Beta)
High Tech 9.9% 1.31
Market 8.0 1.00
(1) What is a beta coefficient, and how are betas used in risk analysis?
Answer: [Show S8-34 through S8-40 here.]
(Draw the framework of the graph, put up the data, then plot the
points for the market (45 line) and connect them, and then get the
High Tech
(slope = beta = 1.31)
Market
(slope = beta = 1.0)
Return on Stock i
(%)
Market
(%)
20
–
20
40
T
–
40
–
20
218
Integrated Case
Chapter 8: Risk and Rates of Return
vis an average stock. The average stock’s beta is 1.0. Most stocks
have betas in the range of 0.5 to 1.5. Theoretically, betas can be
negative, but in the real world they are generally positive.
Betas are calculated as the slope of the “characteristic” line,
I. (2) Do the expected returns appear to be related to each alternative’s
market risk?
Answer: [Show S8-41 here.] The expected returns are related to each
alternative’s market risk—that is, the higher the alternative’s rate of
I. (3) Is it possible to choose among the alternatives on the basis of the
information developed thus far? Use the data given at the start of the
problem to construct a graph that shows how the T–bill’s, High Tech’s,
and the market’s beta coefficients are calculated. Then discuss what
betas measure and how they are used in risk analysis.
Answer: We do not yet have enough information to choose among the various
Chapter 8: Risk and Rates of Return
Integrated Case
219
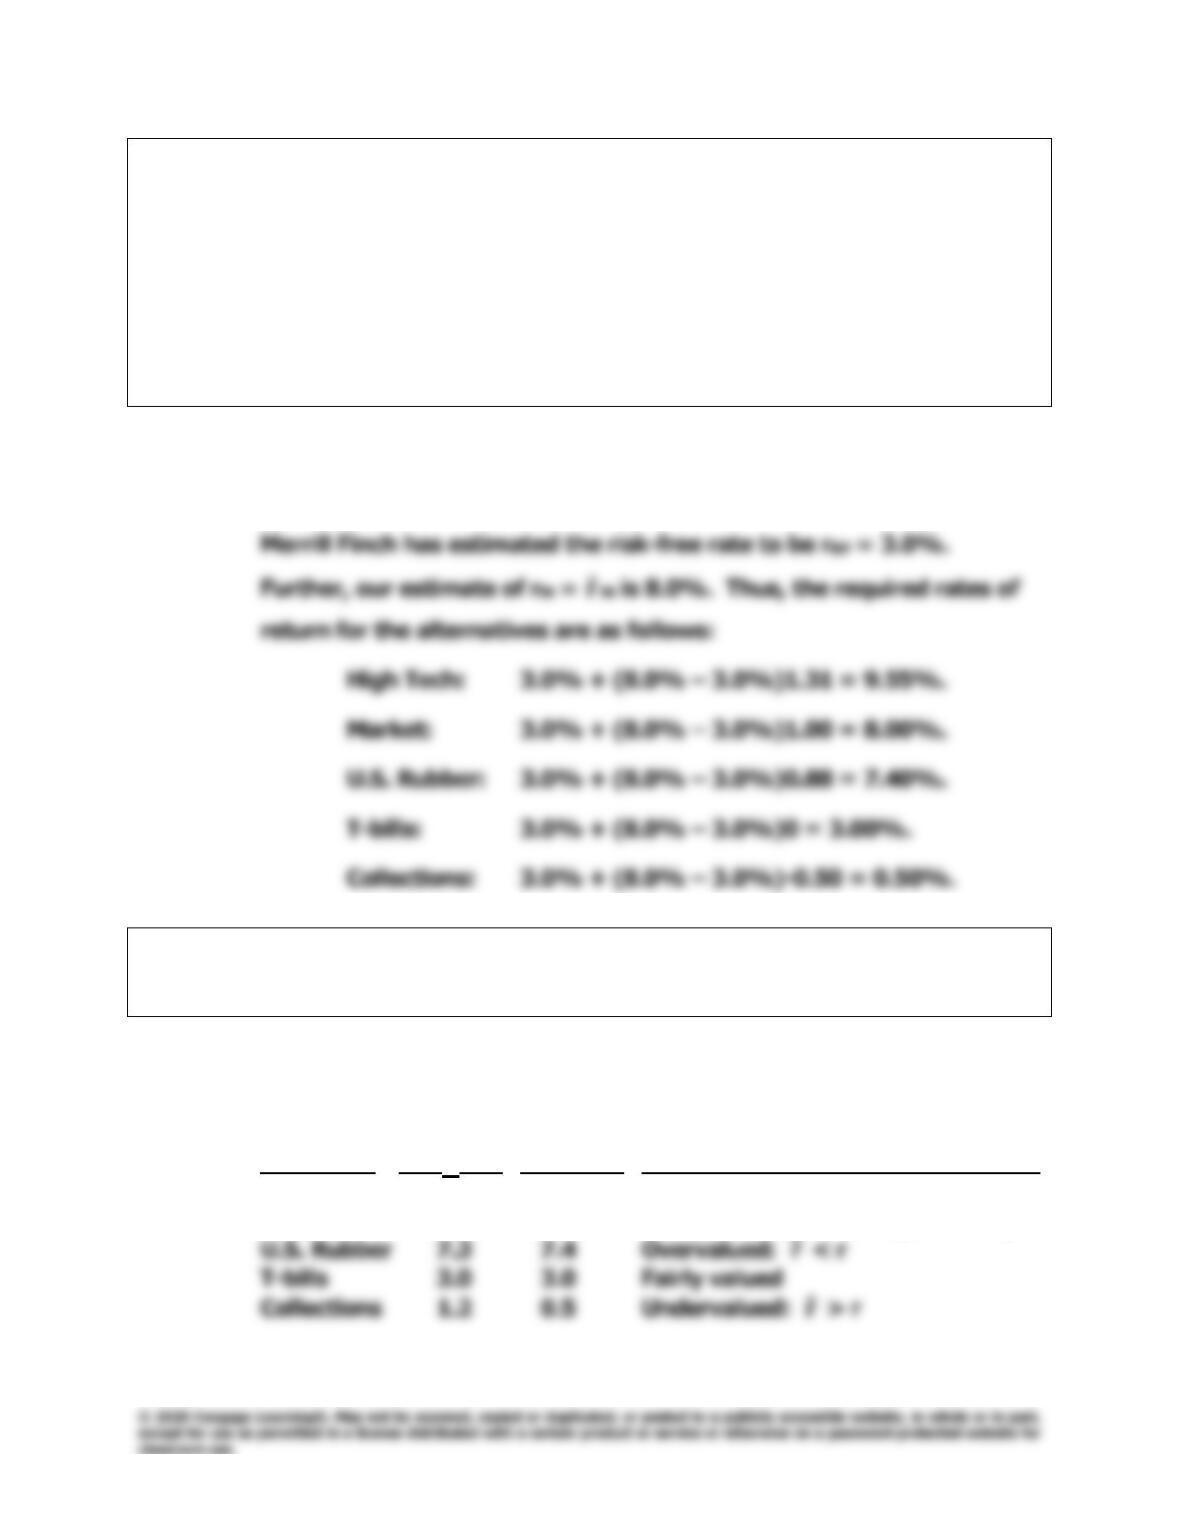
J. The yield curve is currently flat; that is, long-term Treasury bonds also
have a 3.0% yield. Consequently, Merrill Finch assumes that the risk-
free rate is 3.0%.
(1) Write out the Security Market Line (SML) equation; use it to calculate
the required rate of return on each alternative, and graph the
relationship between the expected and required rates of return.
Answer: [Show S8-42 through S8-44 here.] Here is the SML equation:
ri = rRF + (rM – rRF)bi.
r
ˆ
J. (2) How do the expected rates of return compare with the required rates
of return?
Answer: [Show S8-45 and S8-46 here.] We have the following relationships:
Expected Required
Return Return
Security (
r
ˆ
) (r) Condition
High Tech 9.9% 9.55% Undervalued:
r
ˆ
> r
Market 8.0 8.0 Fairly valued (market equilibrium)
r
ˆ
r
ˆ

220
Integrated Case
Chapter 8: Risk and Rates of Return
-2
8
Risk, bi
SML: ri= 3.0% + (5.0%)bi
rM= 8.0
(Note: The plot looks somewhat unusual in that the X-axis extends to
the left of zero. We have a negative–beta stock, hence a required
return that is less than the risk-free rate.) The T–bills and market
portfolio plot on the SML; High Tech and Collections plot above the
J. (3) Does the fact that Collections has an expected return that is less than
the T-bill rate make any sense? Explain.
Answer: Collections is an interesting stock. Its negative beta indicates
negative market risk—including it in a portfolio of “normal” stocks will
lower the portfolio’s risk. Therefore, its required rate of return is
Chapter 8: Risk and Rates of Return
Integrated Case
221
J. (4) What would be the market risk and the required return of a 50-50
portfolio of High Tech and Collections? Of High Tech and U.S. Rubber?
Answer: [Show S8-47 and S8-48 here.] Note that the beta of a portfolio is
simply the weighted average of the betas of the stocks in the
portfolio. Thus, the beta of a portfolio with 50% High Tech and 50%
Collections is:
=
=
N
1i
iip bwb
.
For a portfolio consisting of 50% High Tech plus 50% U.S.
Rubber, the required return would be:
bp = 0.5(1.31) + 0.5(0.88) = 1.095.
222
Integrated Case
Chapter 8: Risk and Rates of Return
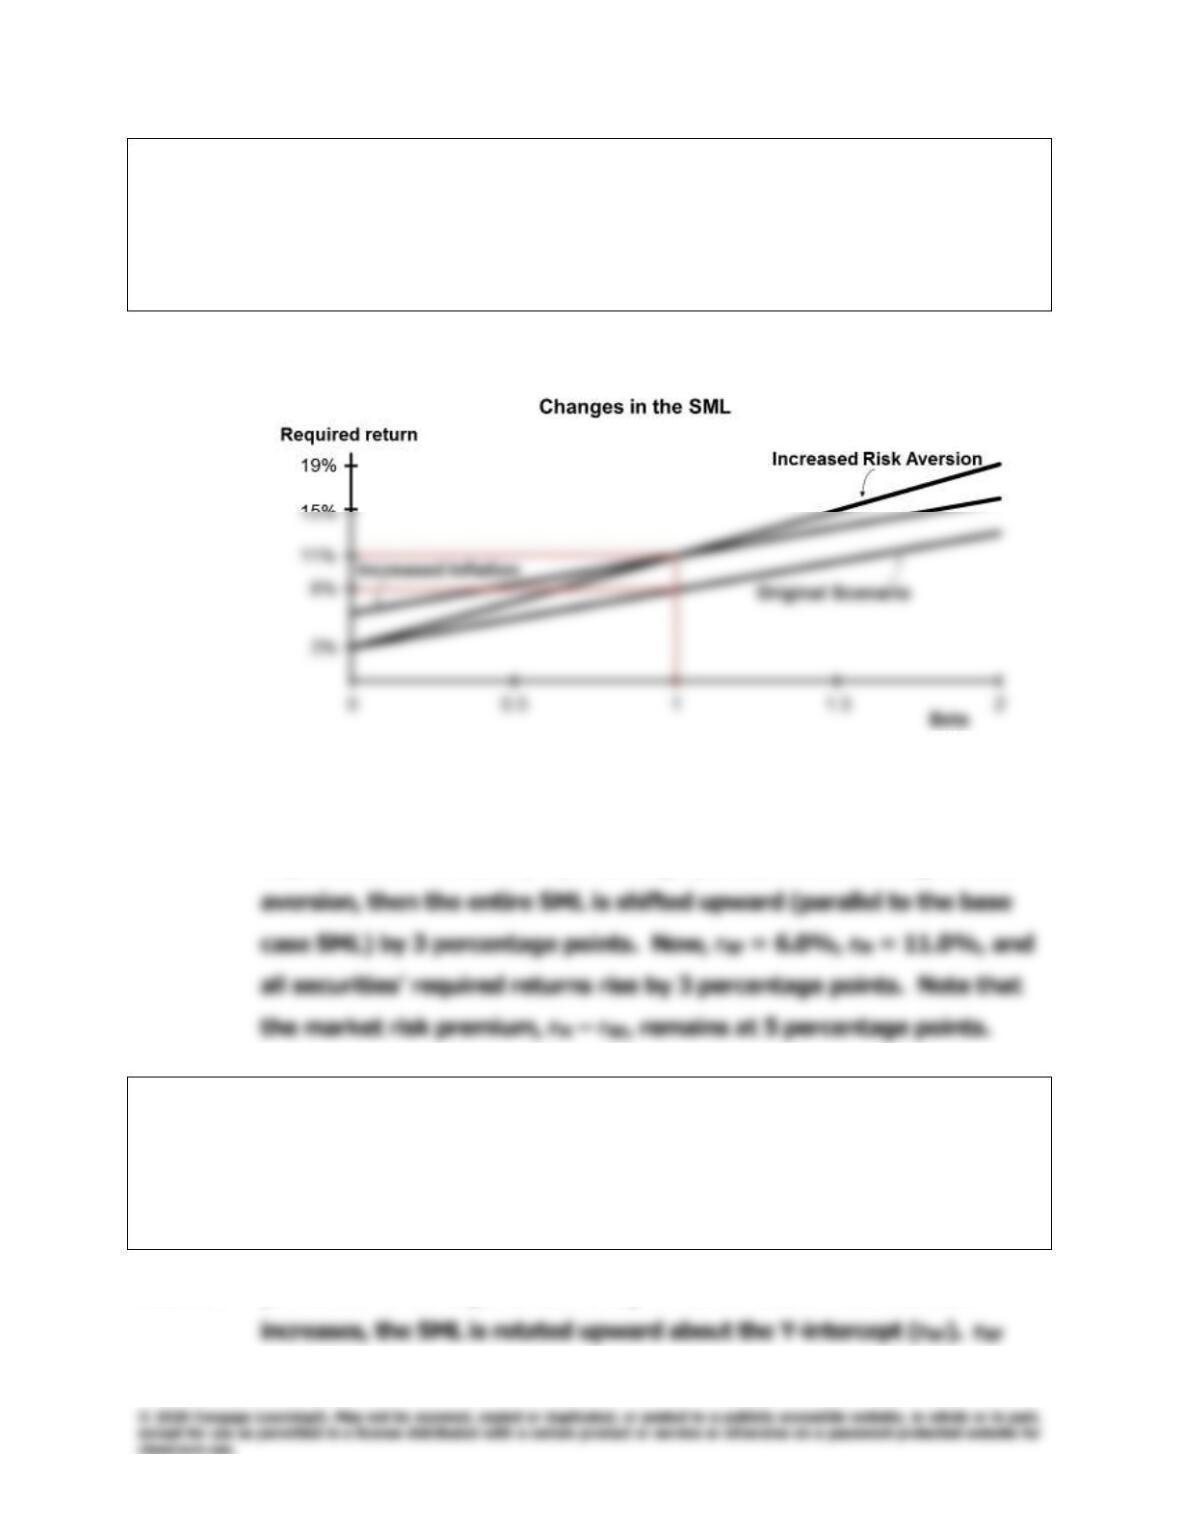
K. (1) Suppose investors raised their inflation expectations by 3 percentage
points over current estimates as reflected in the 3.0% risk-free rate.
What effect would higher inflation have on the SML and on the
returns required on high- and low-risk securities?
Answer: [Show S8-49 here.]
Here we have plotted the SML for betas ranging from 0 to 2.0. The
base–case SML is based on rRF = 3.0% and rM = 8.0%. If inflation
expectations increase by 3 percentage points, with no change in risk
K. (2) Suppose instead that investors’ risk aversion increased enough to
cause the market risk premium to increase by 3 percentage points.
(Inflation remains constant.) What effect would this have on the SML
and on returns of high- and low–risk securities?
Answer: [Show S8–50 through S8-52 here.] When investors’ risk aversion

Chapter 8: Risk and Rates of Return
Integrated Case
223
Optional Question
Financial managers are more concerned with investment decisions relating to
real assets such as plant and equipment than with investments in financial
assets such as securities. How does the analysis that we have gone through
relate to real-asset investment decisions, especially corporate capital budgeting
decisions?
Answer: There is a great deal of similarity between your financial asset
decisions and a firm’s capital budgeting decisions. Here is the
linkage:
1. A company may be thought of as a portfolio of assets. If the
company diversifies its assets, and especially if it invests in
2. Companies obtain their investment funds from investors, who
buy the firm’s stocks and bonds. When investors buy these
3. Therefore, when a manager makes a decision to build a new
not its stand-alone risk. Accordingly, managers need to know
how physical-asset investment decisions affect their firm’s beta