
Mishkin • Instructor’s Manual for The Economics of Money, Banking, and Financial Markets, Twelfth Edition 143
Chapter 12
ANSWERS TO QUESTIONS
1. How does the concept of asymmetric information help to define a financial crisis?
Asymmetric information problems (adverse selection and moral hazard) are always present
2. How can the bursting of an asset-price bubble in the stock market help trigger a financial
crisis?
When an asset-price bubble bursts and asset prices realign with fundamental economic
values, the resulting decline in net worth means that businesses have less skin in the game
3. How does an unanticipated decline in the price level cause a drop in lending?
An unanticipated decline in the price level leads to firms’ real burden of indebtedness
4. Define “financial frictions” in your own terms and explain why an increase in financial
frictions is a key element in financial crises.
Financial frictions are a set of conditions that prevent financial markets to effectively assign

5. How does a deterioration in balance sheets of financial institutions and the simultaneous
failures of these institutions cause a decline in economic activity?
If financial institutions suffer a deterioration in their balance sheets and they have a
substantial contraction in their capital, they will have fewer resources to lend, and lending
6. How does a general increase in uncertainty as a result of the failure of a major financial
institution lead to an increase in adverse selection and moral hazard problems?
The failure of a major financial institution, which leads to a dramatic increase in uncertainty in
7. What is a credit spread? Why do credit spreads rise significantly during a financial crisis?
Credit spreads measure the difference between interest rates on corporate bonds and Treasury
bonds of similar maturity that have no default risk. The rise of credit spreads during a financial
8. Some countries do not advertise that a system of deposit insurance like the FDIC in the
United States exists in their banking system. Explain why some countries would want to do
that.
Some countries do not fully advertise the fact that there exists a system of deposit insurance
precisely because this information makes depositors and bank clients less likely to monitor

9. Describe the process of “securitization” in your own words. Was this process solely
responsible for the Great Recession financial crisis of 2007–2009?
The process of securitization converts a series of financial instruments (i.e. loans) into
marketable securities. This process was extensively used in the U.S. financial system starting
10. Provide one argument in favor of and one against the idea that the Fed was responsible for
the housing price bubble of the mid 2000s.
Supporters of the idea that the Fed was responsible for the Great Recession financial crisis
argue that it helped to create the conditions for a housing market bubble by setting the federal
11. What role does weak financial regulation and supervision play in causing financial crises?
12. Describe two similarities and two differences between the United States’ experiences during
the Great Depression and the Great Recession financial crisis of 2007–2009.
Answers may vary. Both the Great Depression and the Great Recession were preceded by
sharp increases in asset prices. During the two episodes, credit spreads widened, the

13. What do you think prevented the financial crisis of 2007–2009 from becoming a depression?
Answers may vary. In general, it is believed that the country as a whole probably learned
from the experience of the Great Depression, and have put in place more sophisticated policy
14. What technological innovations led to the development of the subprime mortgage market?
15. Why is the originate-to-distribute business model subject to the principal–agent problem?
16. True, false, or uncertain: Deposit insurance always and everywhere prevents financial
crises.
False. Deposit insurance is a very good system to prevent bank panics, but these events are

17. How did a decline in housing prices help trigger the subprime financial crisis that began in
2007?
18. What role did the shadow banking system play in the 2007–2009 financial crisis?
The shadow banking system is composed of hedge funds, investment banks, and other
nondepository financial firms that are not subject to the tight regulatory frameworks of
19. Why would haircuts on collateral increase sharply during a financial crisis? How would this
lead to fire sales on assets?
During a financial crisis, asset prices fall, oftentimes very rapidly and unexpectedly. This
leads to the expectation that asset prices may fall further in the future and increases the
20. How did the global financial crisis promote a sovereign debt crisis in Europe?
21. Why is it a good idea for macroprudential policies to require countercyclical capital
requirements?

22. How does the process of financial innovation impact the effectiveness of macroprudential
regulation?
The process of financial innovation is generally good for the economy: Its goal is to create
new financial instruments as a response to the ever-changing preferences of financial system
23. What are the three approaches to limiting the too-big-to-fail problem? Briefly describe the
advantages and disadvantages of each of the approaches.
The S&L crisis can be blamed on the principal-agent problem because politicians and
24. Why were consumer protection provisions included in the Dodd-Frank bill, a bill designed to
strengthen the financial system? What are some of the problems with these regulations?
One of the main provisions in this section of legislation is the authority to examine and
enforce regulations for businesses related to the issuance of residential mortgages. Much of

25. Why is it important for the U.S. government to have resolution authority?
Prior to 2009, the U.S. government had no legal authority to seize the largest failing financial
ANSWERS TO DATA ANALYSIS PROBLEMS
1. Go to the St. Louis Federal Reserve FRED database and find data on house prices
(SPCS20RSA), stock prices (SP500), a measure of the net wealth of households
(TNWBSHNO), and personal consumption expenditures (PCEC). For all four measures, be
sure to convert the frequency setting to “Quarterly.” Download the data into a spreadsheet,
and make sure the data align correctly with the appropriate dates. For all four series, for
each quarter, calculate the annualized growth rate from quarter to quarter. To do this, take
the current-period data minus the previous-quarter data, and then divide by the previous
quarter data. Multiply by 100 to change each result to a percent, and multiply by 4 to
annualize the data.
a. For the four series, calculate the average growth rates over the most recent four quarters
of data available. Comment on the relationships among house prices, stock prices, net
wealth of households, and consumption as they relate to your results.
See table below. From the most recent available data from 2016:Q2 to 2017:Q1, all four
data series are showing healthy gains, and are sensibly related to each other. Since
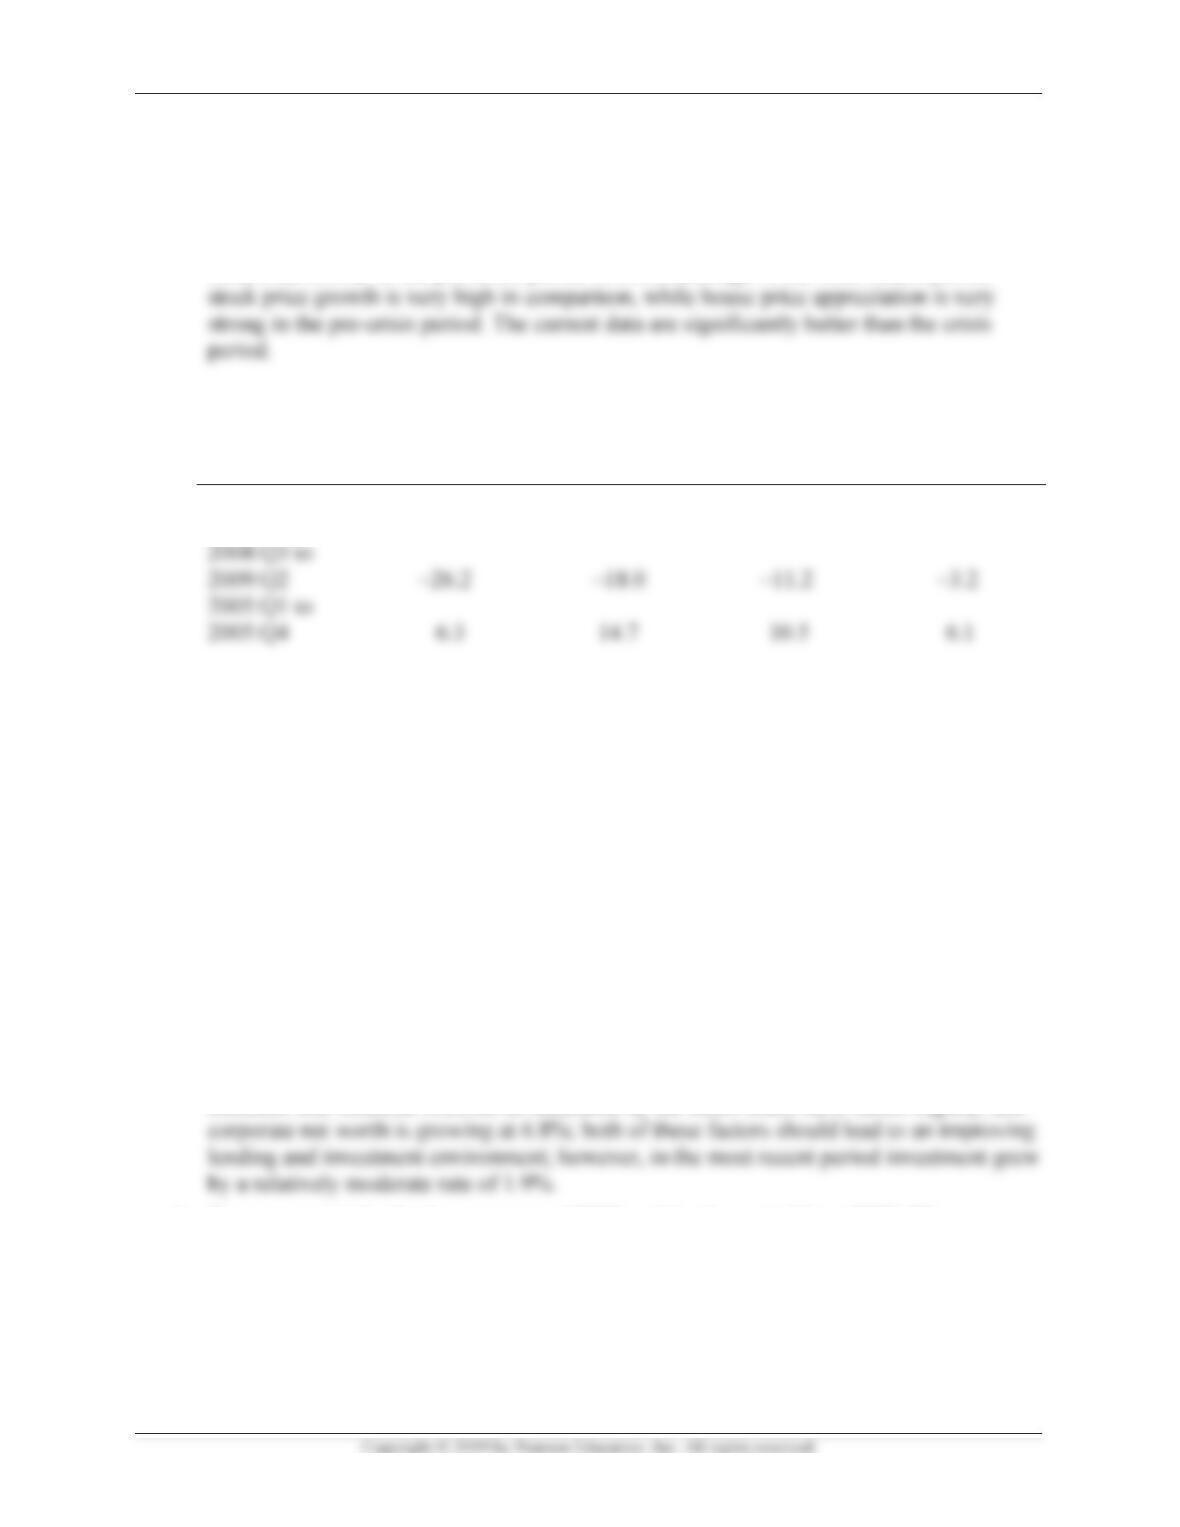
b. Repeat part (a) for the four quarters of 2005, and again for the period from 2008:Q3 to
2009:Q2. Comment on the relationships among house prices, stock prices, net wealth of
households, and consumption as they relate to your results, before and during the crisis.
See table below. The period prior to the financial crisis, and the crisis period itself are
starkly different. In the 2005 period, house prices were rising quickly, and stock prices
Mishkin • Instructor’s Manual for The Economics of Money, Banking, and Financial Markets, Twelfth Edition 150
c. How do the current household data compare to the data from the period prior to the
financial crisis, and during the crisis? Do you think the current data are indicative of a
bubble?
The most current data overall shows strong growth in these household indicators
somewhat similar to the pre-crisis period in 2005, although in the most recent period
NASDAQ
Stock Price
Growth
Case-Shiller
Home Price
Growth
Household
Net Worth
Consumption
Growth
2016:Q2 to
2017:Q1 22.4 5.7 8.1 4.9
2. Go to the St. Louis Federal Reserve FRED database and find data on corporate net worth of
nonfinancial businesses (TNWMVBSNNCB), private domestic investment (GPDIC1), and a
measure of financial frictions, the St. Louis Fed financial stress index (STLFSI). For all three
measures, be sure to convert the frequency setting to “Quarterly.” Download the data into a
spreadsheet, and make sure the data align correctly with the appropriate dates. For
corporate net worth and private domestic investment, calculate the annualized growth rates
from quarter to quarter. To do this, take the current-period data minus the previous-quarter
data, then divide by the previous quarter data. Multiply by 100 to change the results to
percentage form, and then multiply by 4 to annualize the data.
a. Calculate the average growth rates over the most recent four quarters of data available
for the corporate net worth and private domestic investment variables. Calculate the
difference between the value of the stress index during the most recent quarter and the
value of the stress index one year earlier. Comment on the relationships among financial
stress, net wealth of corporate businesses, and private domestic investment.
See table below. The most recent four quarters available from 2016:Q2 to 2017:Q1
indicates that financial frictions as measured by the stress index have fallen slightly, and
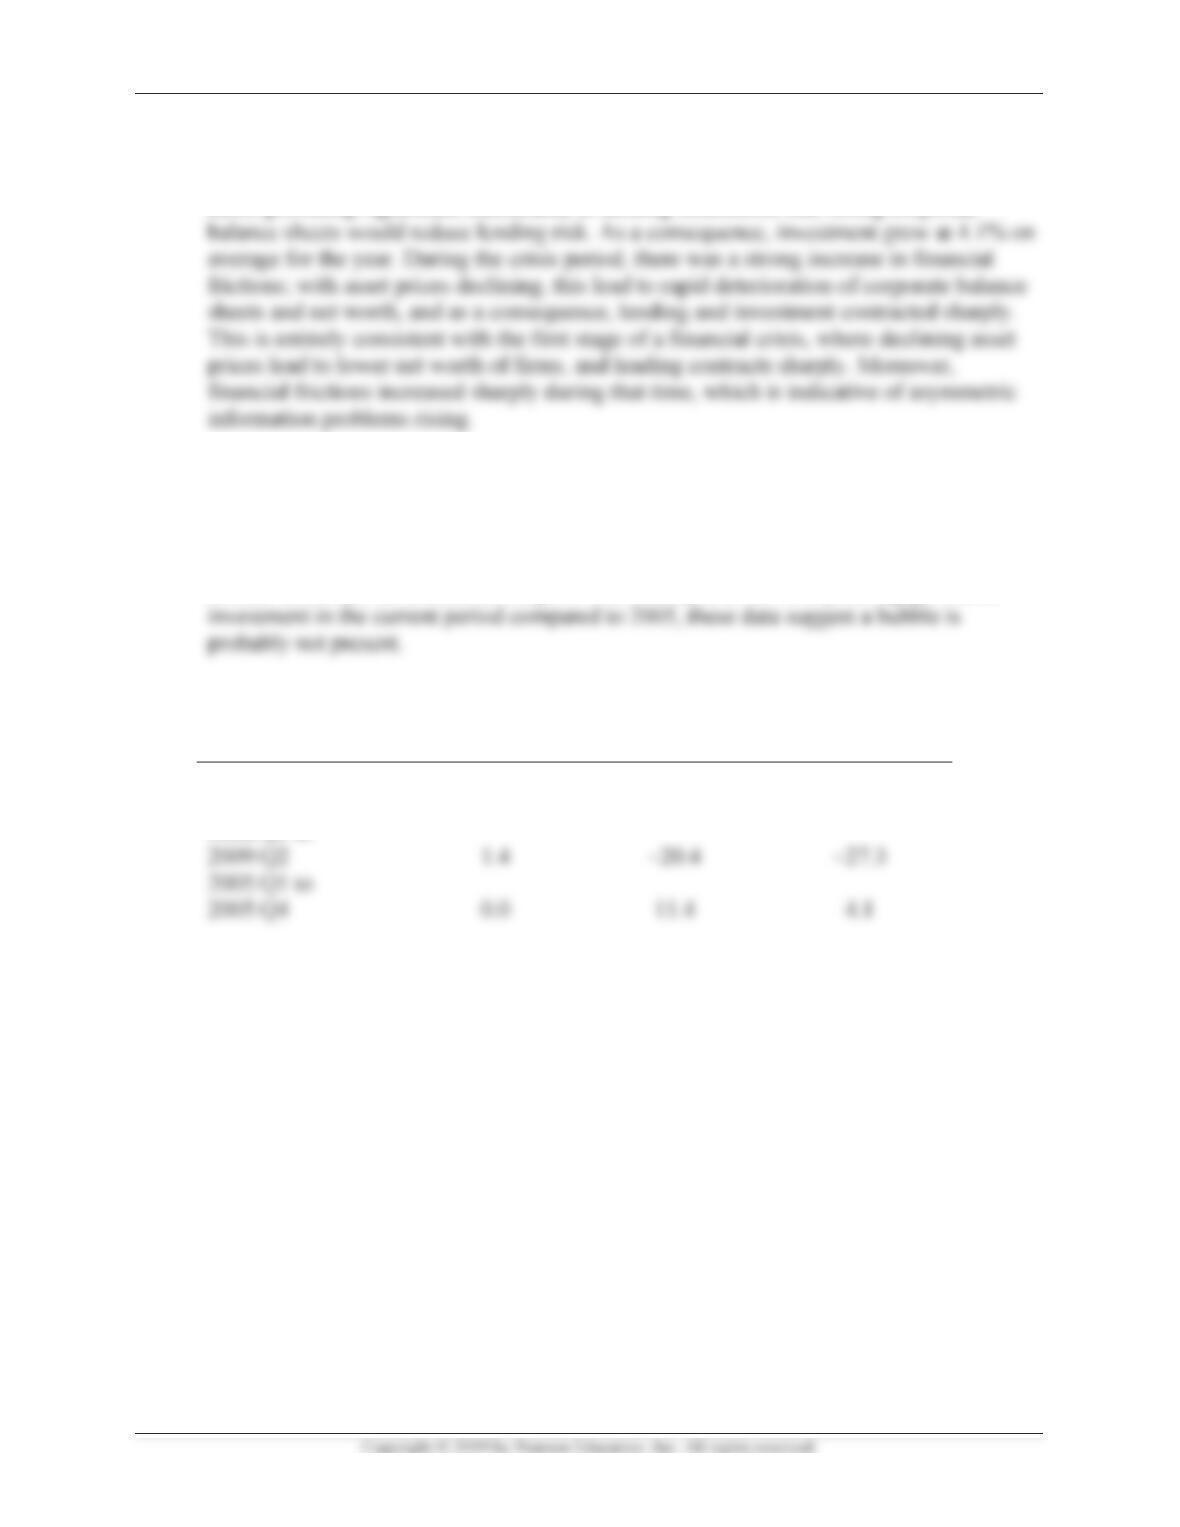
b. Repeat part (a) for the four quarters of 2005 and for the period from 2008:Q3 to
2009:Q2. Comment on the relationships among financial stress, net wealth of corporate
businesses, and private domestic investment before and during the crisis as they relate to
your results. Assuming the financial stress measure is indicative of heightened
asymmetric information problems, comment on how the crisis-period data relate to the
typical dynamics of a financial crisis.
Mishkin • Instructor’s Manual for The Economics of Money, Banking, and Financial Markets, Twelfth Edition 151
See table below. During the pre-crisis period in 2005, financial frictions were essentially
flat. However, net worth of corporations was increasing well over 10% on an annual
basis, providing significant reassurance to lending institutions that strong corporate
c. How do the current investment data compare to the data for the period prior to the
financial crisis, and during the crisis? Do you think the current data are indicative of a
bubble?
Since financial frictions have been lowering over the last year, this is indicative of a more
normal economic environment; coupled with healthy, but not overly strong growth in
Average
Change, Stress
Index
Corporate Net
Worth Growth
Rate
Investment
Growth Rate
2016:Q2 to
2017:Q1 0.2 6.8 1.9
2008:Q3 to