Chapter 12 – Aggregate Demand and Aggregate Supply
12-1
Chapter 12 Aggregate Demand and Aggregate Supply
QUESTIONS
1. Why is the aggregate demand curve downsloping? Specify how your explanation differs from
the explanation for the downsloping demand curve for a single product. What role does the
multiplier play in shifts of the aggregate demand curve? LO1
Answer: The aggregate demand (AD) curve shows that as the price level drops,
purchases of real domestic output increase. The AD curve slopes downward for three
2. Distinguish between “real–balances effect” and “wealth effect,” as the terms are used in this
chapter. How does each relate to the aggregate demand curve? LO1
Chapter 12 – Aggregate Demand and Aggregate Supply
12-2
Answer: The “real balances effect” refers to the impact of price level on the purchasing
power of asset balances. If prices decline, the purchasing power of assets will rise, so
3. What assumptions cause the immediate-short-run aggregate supply curve to be horizontal?
Why is the long-run aggregate supply curve vertical? Explain the shape of the short-run aggregate
supply curve. Why is the short-run curve relatively flat to the left of the full-employment output
and relatively steep to the right? LO2
Answer: The immediate short-run supply curve is horizontal because of contractual
agreements. These ‘contracts’ for both input and output prices imply that prices do not
change along the immediate short-run aggregate supply curve.
4. What effects would each of the following have on aggregate demand or aggregate supply, other
things equal? In each case use a diagram to show the expected effects on the equilibrium price
level and the level of real output, assuming that the price level is flexible both upward and
downward. LO3
Chapter 12 – Aggregate Demand and Aggregate Supply
12-3
a. A widespread fear by consumers of an impeding economic depression.
b. A new national tax on producers based on the value-added between the costs of the inputs and
the revenue received from their output.
c. A reduction in interest rates at each price level.
d. A major increase in spending for health care by the Federal government.
e. The general expectation of coming rapid inflation.
f. The complete disintegration of OPEC, causing oil prices to fall by one-half.
g. A 10 percent across-the-board reduction in personal income tax rates.
h. A sizable increase in labor productivity (with no change in nominal wages).
i. A 12 percent increase in nominal wages (with no change in productivity).
j. An increase in exports that exceeds an increase in imports (not due to tariffs).
Answer:
(a) AD curve left, output down and price level down (assuming no ratchet effect).
(b) AS curve left, output down and price level up.
5. Assume that (a) the price level is flexible upward but not downward and (b) the economy is
currently operating at its full-employment output. Other things equal, how will each of the
following affect the equilibrium price level and equilibrium level of real output in the short run?
LO3
a. An increase in aggregate demand.
b. A decrease in aggregate supply, with no change in aggregate demand.
c. Equal increases in aggregate demand and aggregate supply.
d. A decrease in aggregate demand.
e. An increase in aggregate demand that exceeds an increase in aggregate supply.
Answer:
(a) Price level rises rapidly and little change in real output.
6. Explain how an upsloping aggregate supply curve weakens the realized multiplier effect from
an initial change in investment spending. LO3
Chapter 12 – Aggregate Demand and Aggregate Supply
12-4
Answer: An upsloping aggregate supply curve weakens the effect of the multiplier
7. Why does a reduction in aggregate demand in the actual economy reduce real output, rather
than the price level? Why might a full-strength multiplier apply to a decrease in aggregate
demand? LO3
Answer: A reduction in aggregate demand causes a decline in real output rather than the
price level because prices are inflexible downward (“sticky”). If we assume prices are
8. Explain: “Unemployment can be caused by a decrease of aggregate demand or a decrease of
aggregate supply.” In each case, specify the price-level outcomes. LO4
Answer: The statement is true, although the magnitude of the effect on unemployment
can vary considerably, particularly with decreases in aggregate demand. A decrease in
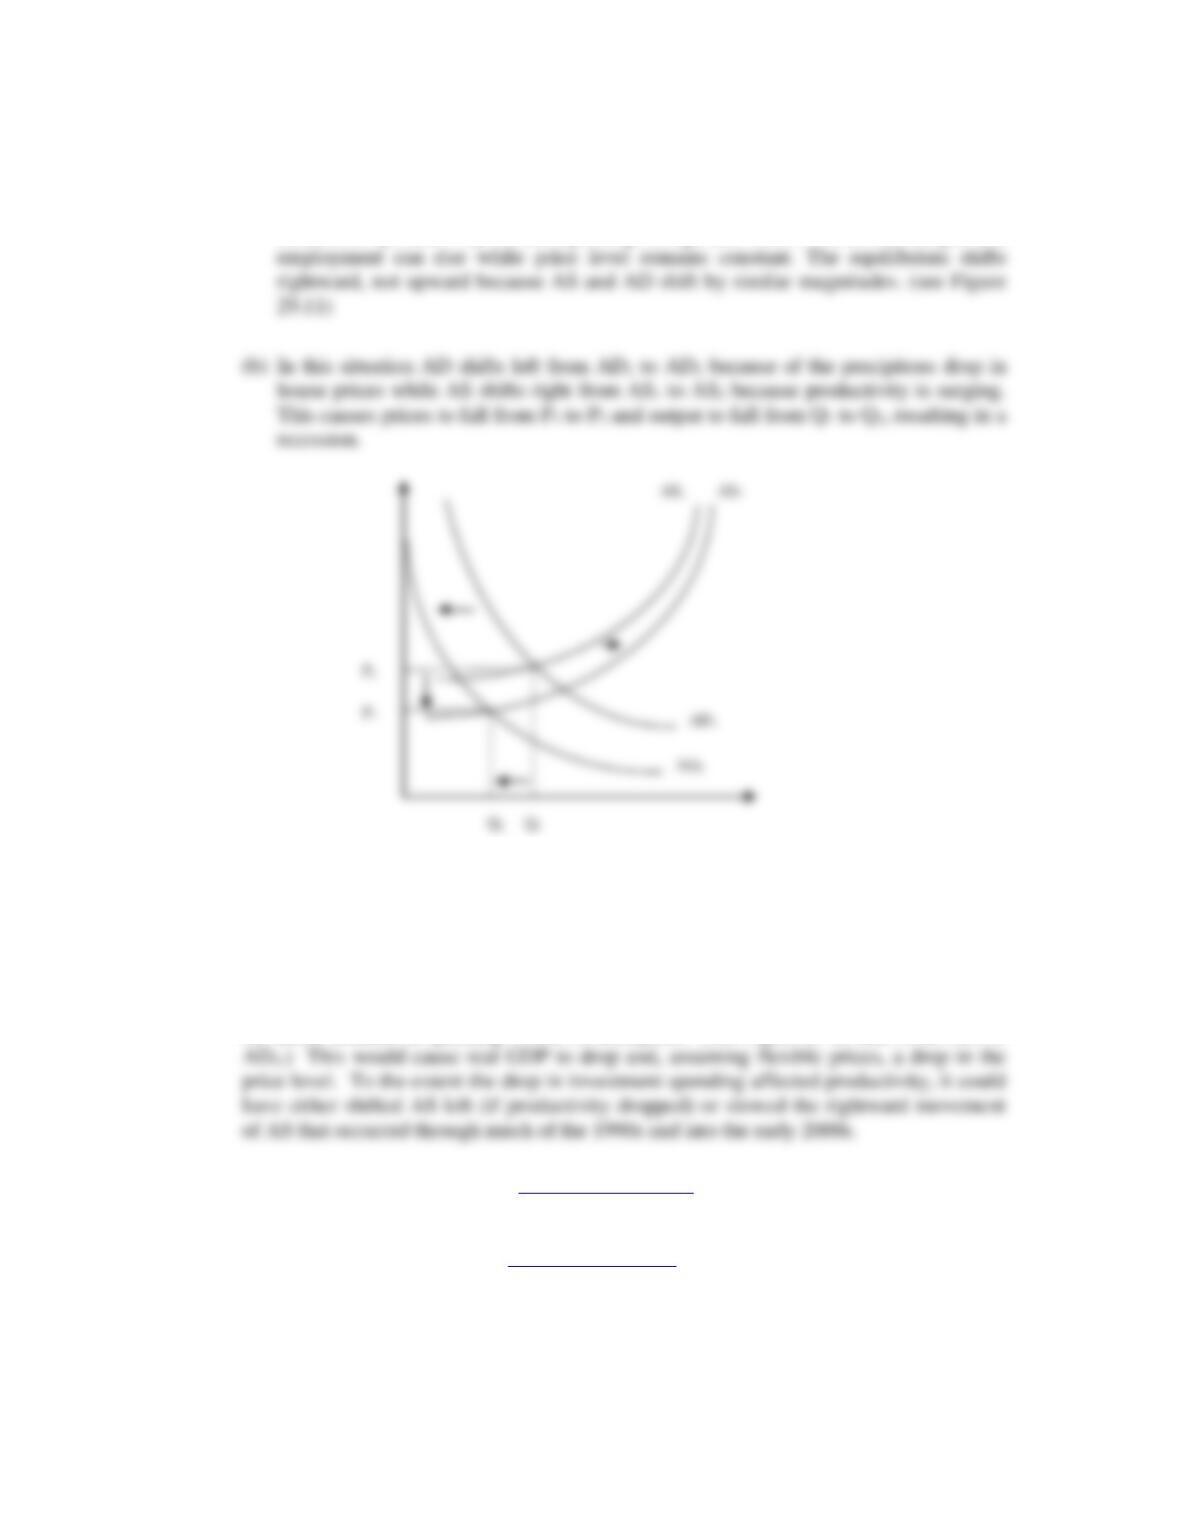
9. Use shifts of the AD and AS curves to explain (a) the U.S. experience of strong economic
growth, full employment, and price stability in the late 1990s and early 2000s and (b) how a
strong negative wealth effect from, say, a precipitous drop in house prices could cause a recession
even though productivity is surging. LO4
Chapter 12 – Aggregate Demand and Aggregate Supply
12-5
Answer:
(a) While AD is increasing and shifting to right, AS is shifting rightward as well,
because of productivity increasing and growing labor force. Thus, both output and
10. In early 2001 investment spending sharply declined in the United States. In the 2 months
following the September 11, 2001 attacks on the United States, consumption also declined. Use
AD-AS analysis to show the two impacts on real GDP. LO4
Answer: Both events would be represented by a leftward shift in aggregate demand, and
the initial declines in spending would be multiplied. (See Figure 29-2, shift from AD1 to
11. Last Word Go to the OPEC Web sitehttp://www.opec.org, and find the current “OPEC basket
price” of oil. By clicking on that amount, you will find the annual prices of oil for the past 5
years. By what percentage is the current price higher or lower than 5 years ago? Next, go to the
Bureau of Economic Analysis Web sitehttp://www.bea.gov, and use the interactive feature to find
U.S. real GDP for the past years. By what percentage is real GDP higher or lower than it was 5
years ago? What if, anything, can you conclude about the relationship between the price of oil
and the level of real GDP in the United States?
Chapter 12 – Aggregate Demand and Aggregate Supply
12-6
PROBLEMS
1. Suppose that consumer spending initially rises by $5 billion for every 1 percent rise in
household wealth and that investment spending initially rises by $20 billion for every 1
percentage point fall in the real interest rate. Also assume that the economy’s multiplier is 4. If
household wealth falls by 5 percent because of declining house values, and the real interest rate
falls by two percentage points, in what direction and by how much will the aggregate demand
curve initially shift at each price level? In what direction and by how much will it eventually
shift? LO1
Feedback: Consider the following example. Suppose that consumer spending initially rises by
$5 billion for every 1 percent rise in household wealth and that investment spending initially rises
by $20 billion for every 1 percentage point fall in the real interest rate. Also assume that the
economy’s multiplier is 4. If household wealth falls by 5 percent because of declining house
values, and the real interest rate falls by two percentage points, in what direction and by how
much will the aggregate demand curve initially shift at each price level? In what direction and by
how much will it eventually shift?
Suppose that consumer spending initially rises by $5 billion for every 1 percent rise in household
wealth. If household wealth falls by 5 percent because of declining house values the initial shift in
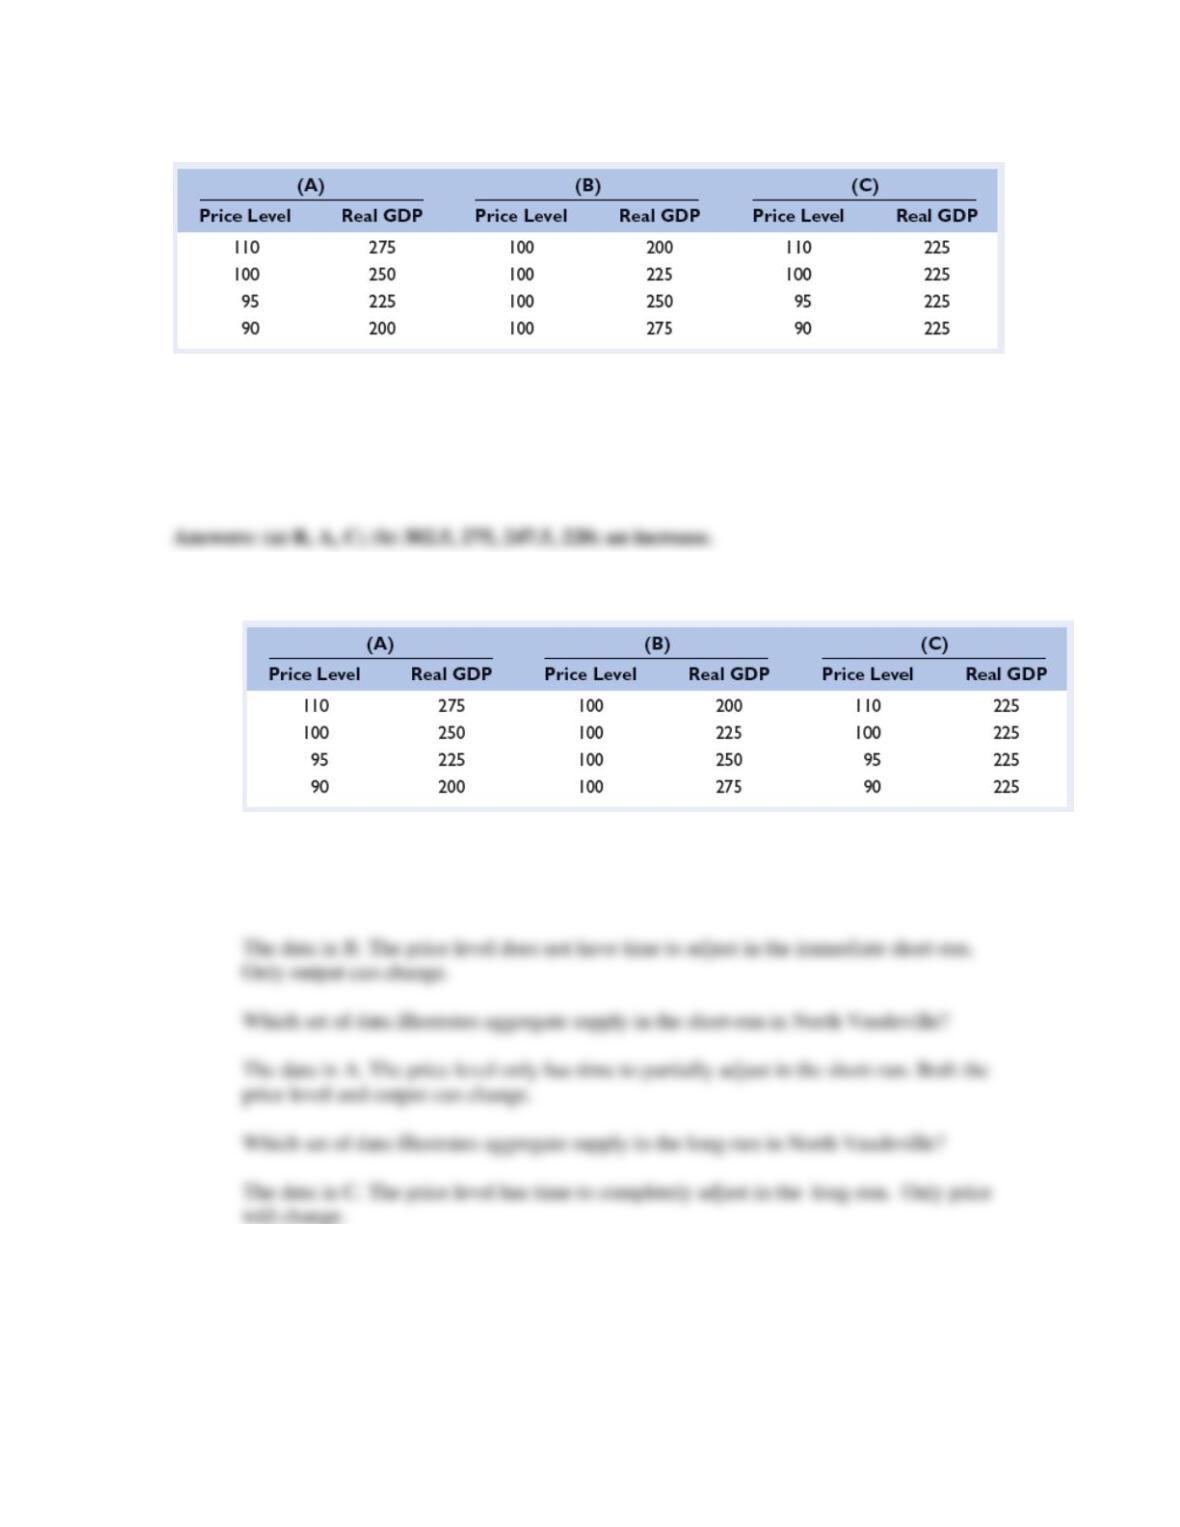
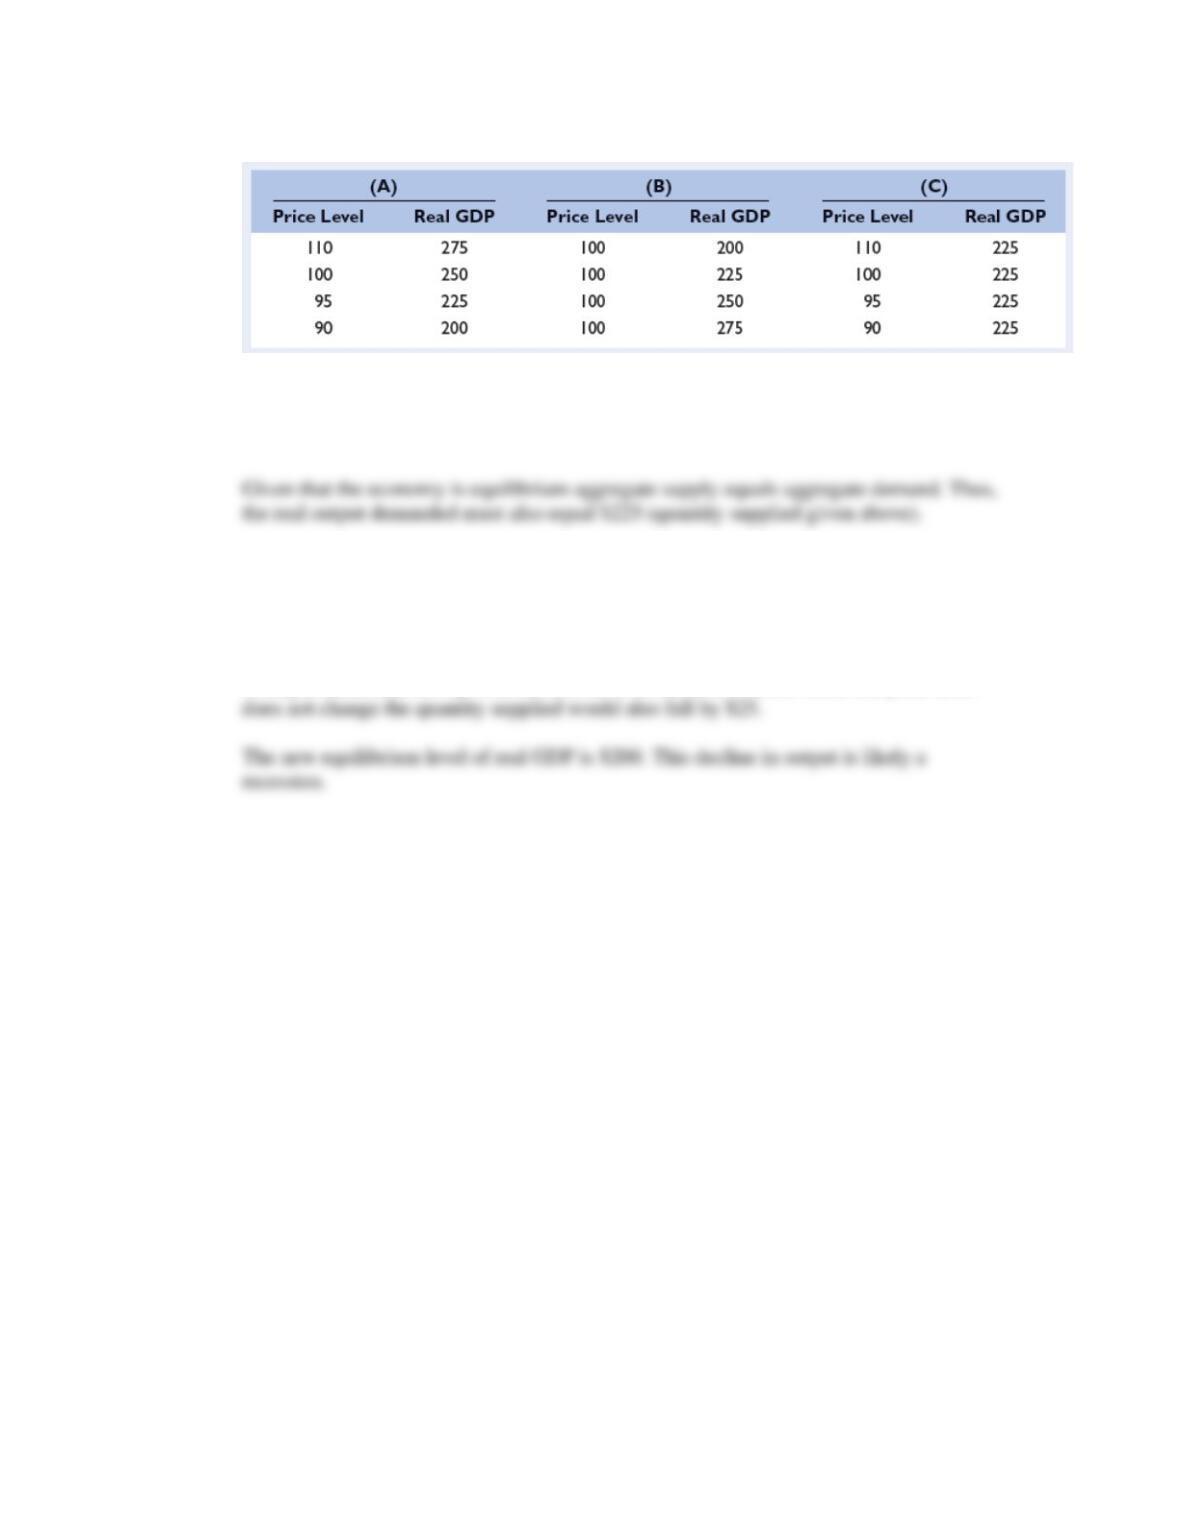
2. Answer the following questions on the basis of the three sets of data for the country of North
Vaudeville: LO2
Chapter 12 – Aggregate Demand and Aggregate Supply
12-7
a. Which set of data illustrates aggregate supply in the immediate short-run in North Vaudeville?
The short run? The long run?
b. Assuming no change in hours of work, if real output per hour of work increases by 10 percent,
what will be the new levels of real GDP in the right column of A? Does the new data reflect an
increase in aggregate supply or does it indicate a decrease in aggregate supply?
Feedback: Consider the following data as an example.
Part a:
Which set of data illustrates aggregate supply in the immediate short-run in North
Vaudeville?
Part b:
Assuming no change in hours of work, if real output per hour of work increases by 10
percent, what will be the new levels of real GDP in the right column of A?
Chapter 12 – Aggregate Demand and Aggregate Supply
12-8
To find the new level of output at each price level multiply the original values by 1.1.
Does the new data reflect an increase in aggregate supply or does it indicate a decrease in
aggregate supply?
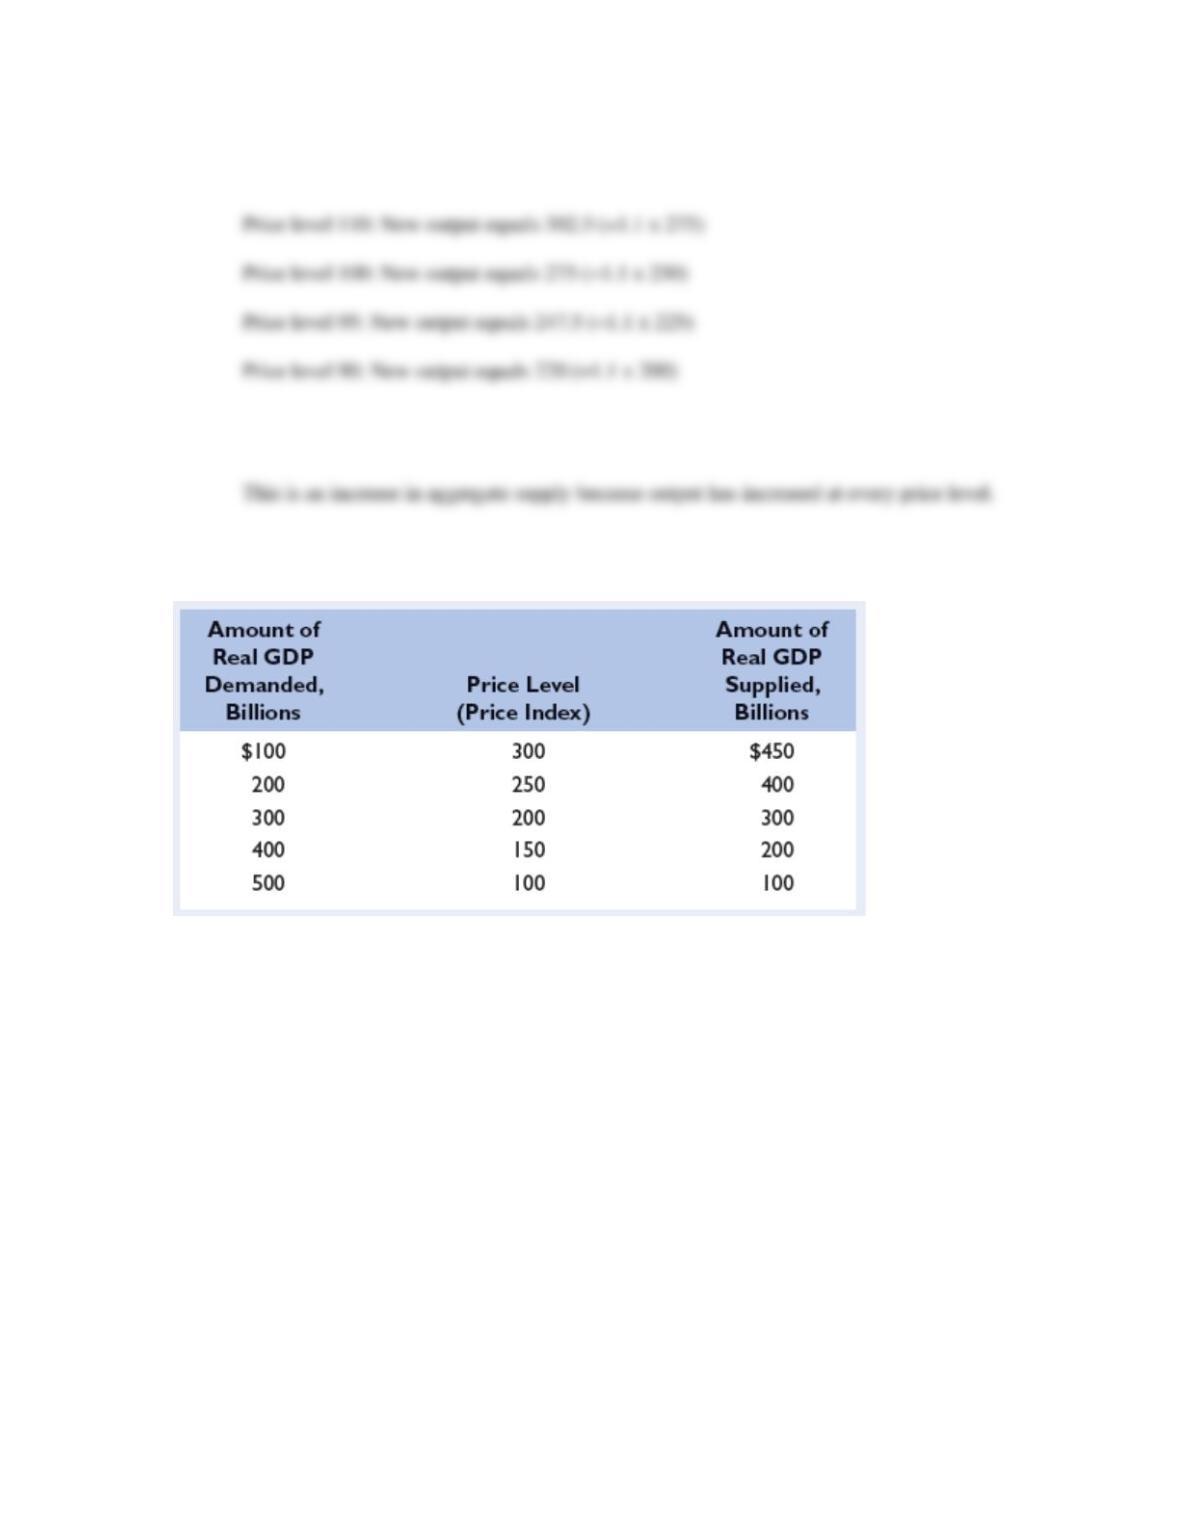
3. Suppose that the aggregate demand and aggregate supply schedules for a hypothetical economy
are as shown below: LO3
a. Use these sets of data to graph the aggregate demand and aggregate supply curves. What is the
equilibrium price level and the equilibrium level of real output in this hypothetical economy? Is
the equilibrium real output also necessarily the full-employment real output?
b. If the price level in this economy is 150, will quantity demanded equal, exceed, or fall short of
quantity supplied? By what amount? If the price level is 250, will quantity demanded equal,
exceed, or fall short of quantity supplied? By what amount?
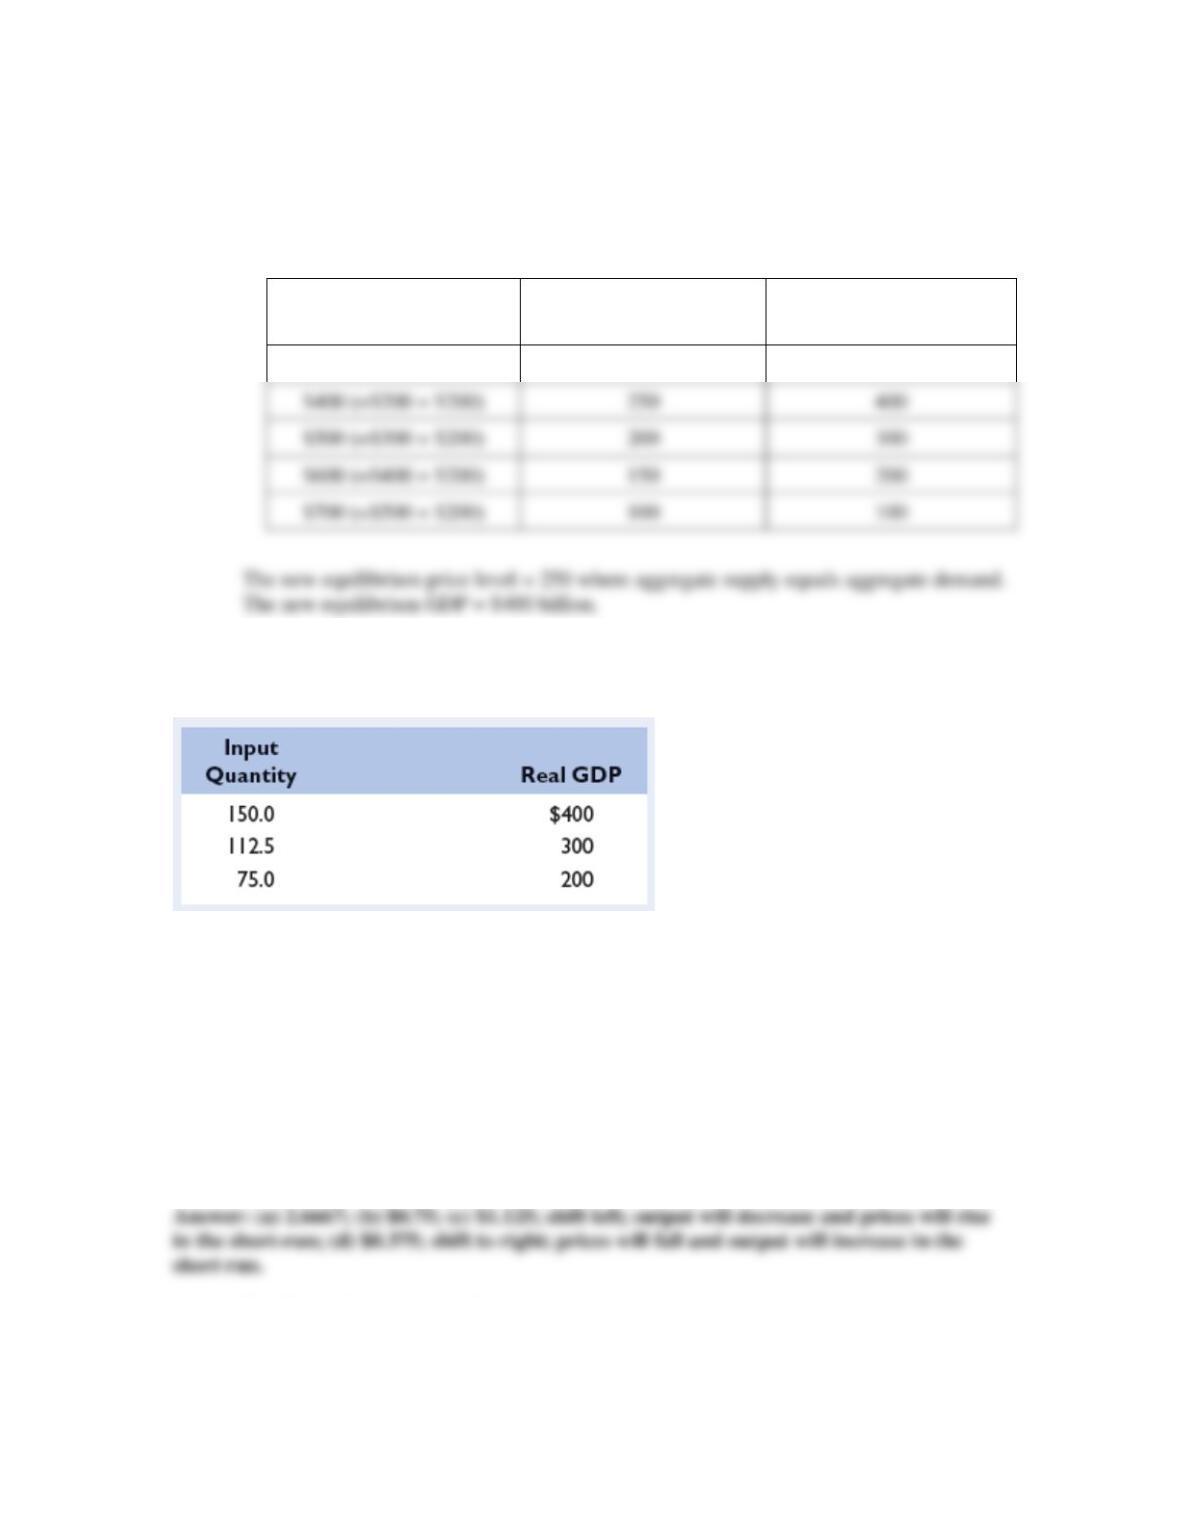
c. Suppose that buyers desire to purchase $200 billion of extra real output at each price level.
Sketch in the new aggregate demand curve as AD1. What is the new equilibrium price level and
level of real output?
Chapter 12 – Aggregate Demand and Aggregate Supply
12-9
Feedback:
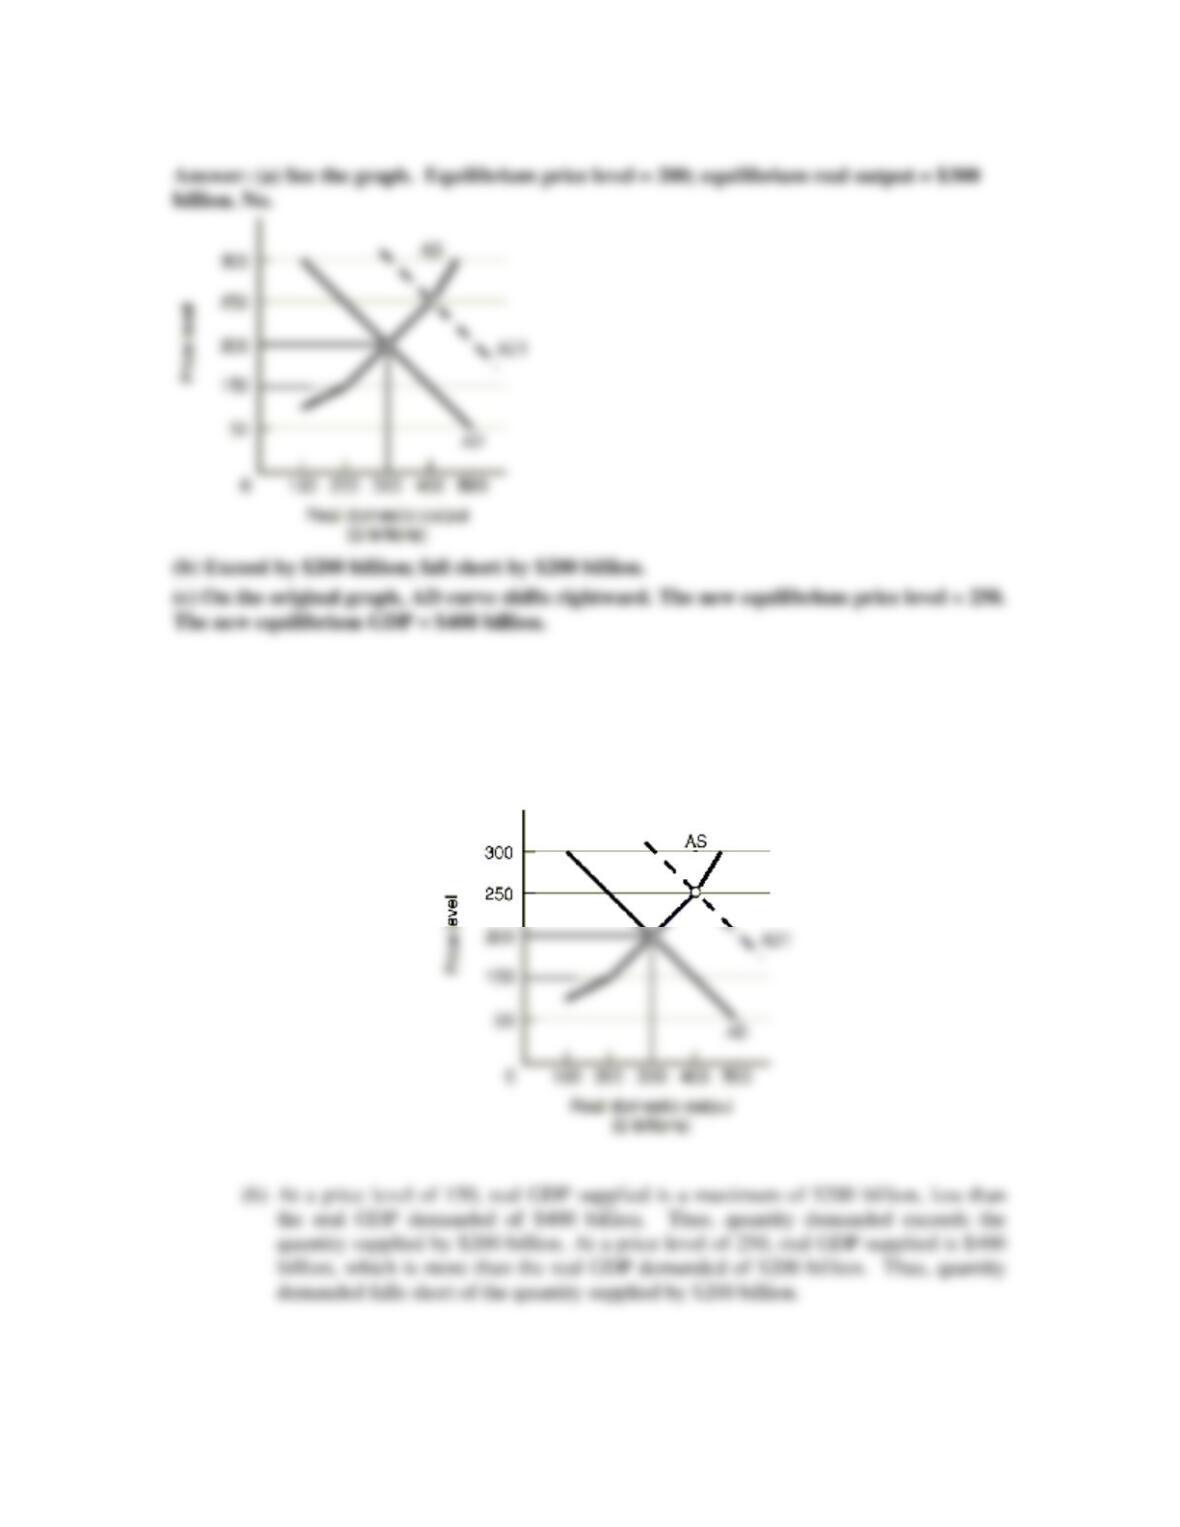
(a) See the graph. Equilibrium price level = 200, which occurs where aggregate supply
equals aggregate demand, Thus the equilibrium real output = $300 billion. No, the
full-capacity level of GDP cannot be determined without more information.
Chapter 12 – Aggregate Demand and Aggregate Supply
12–10
(c) See the graph from part a. Increases in consumer, investment, government, or net
export spending might shift the AD curve rightward. The new values for the
aggregate demand schedule are:
Amount of Real GDP
Demanded, Billions
Price Level
(Price Index)
Amount of Real GDP
Supplied, Billions
$300 (=$100 + $200)
300
$450
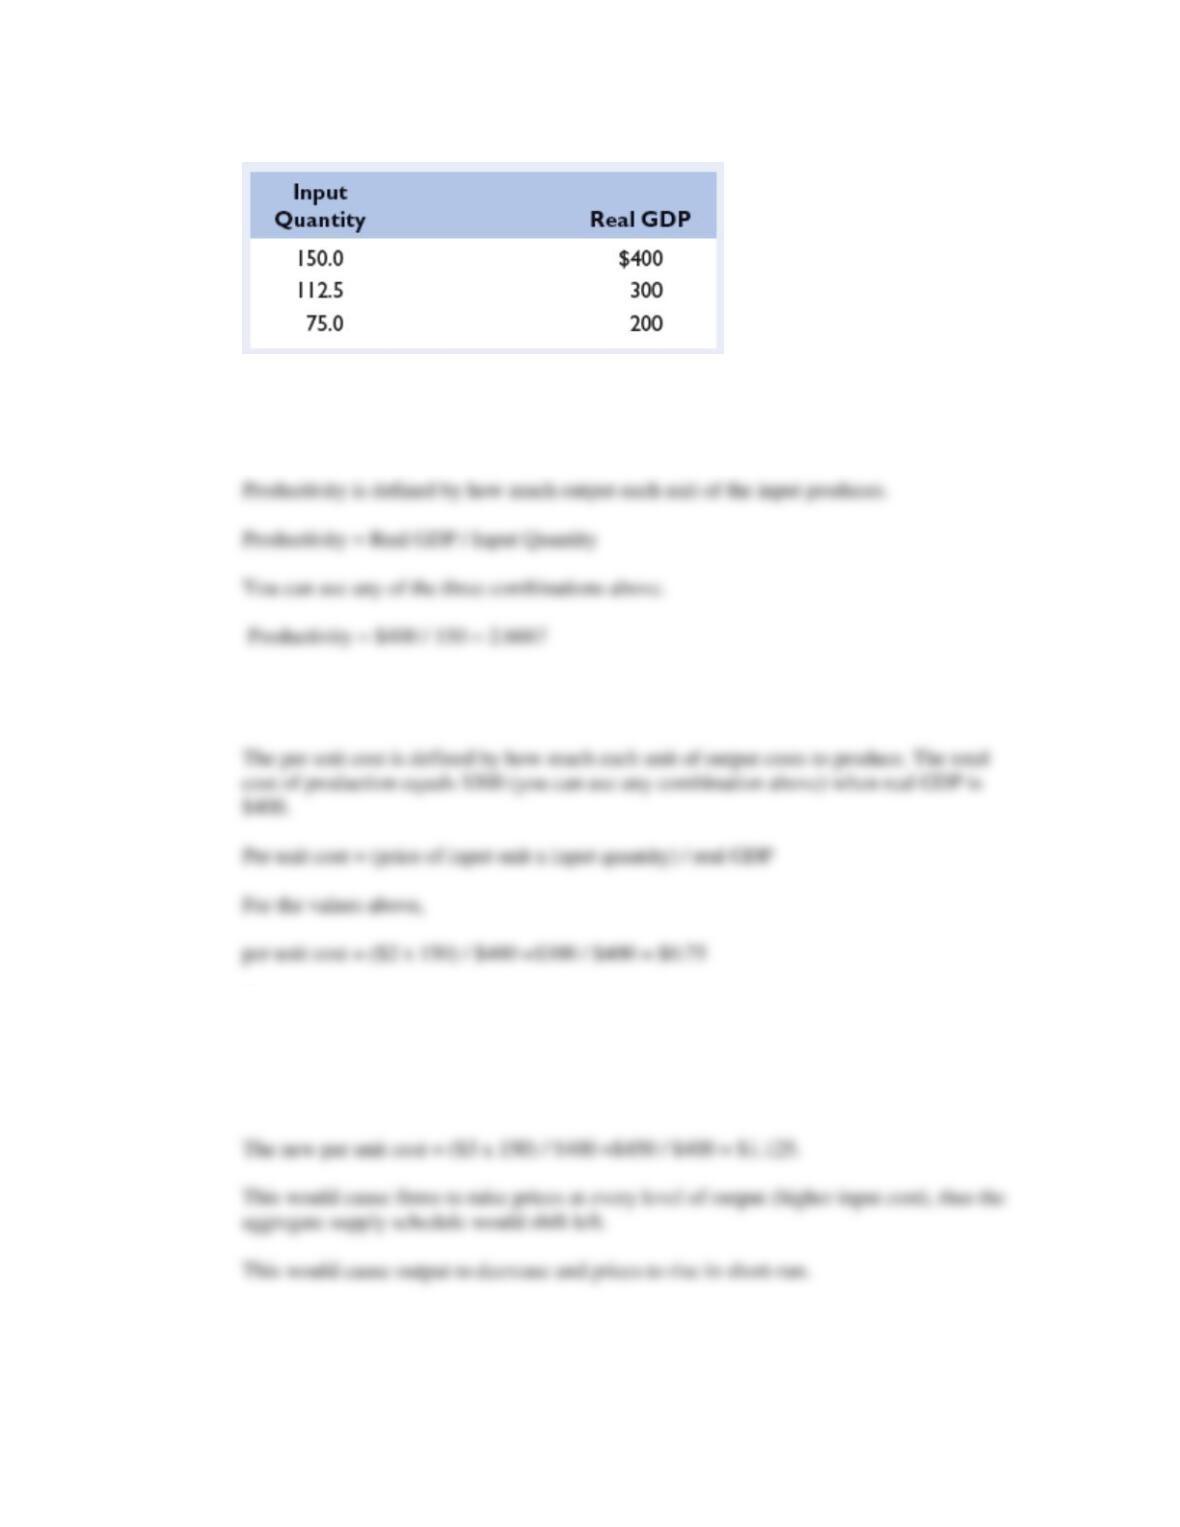
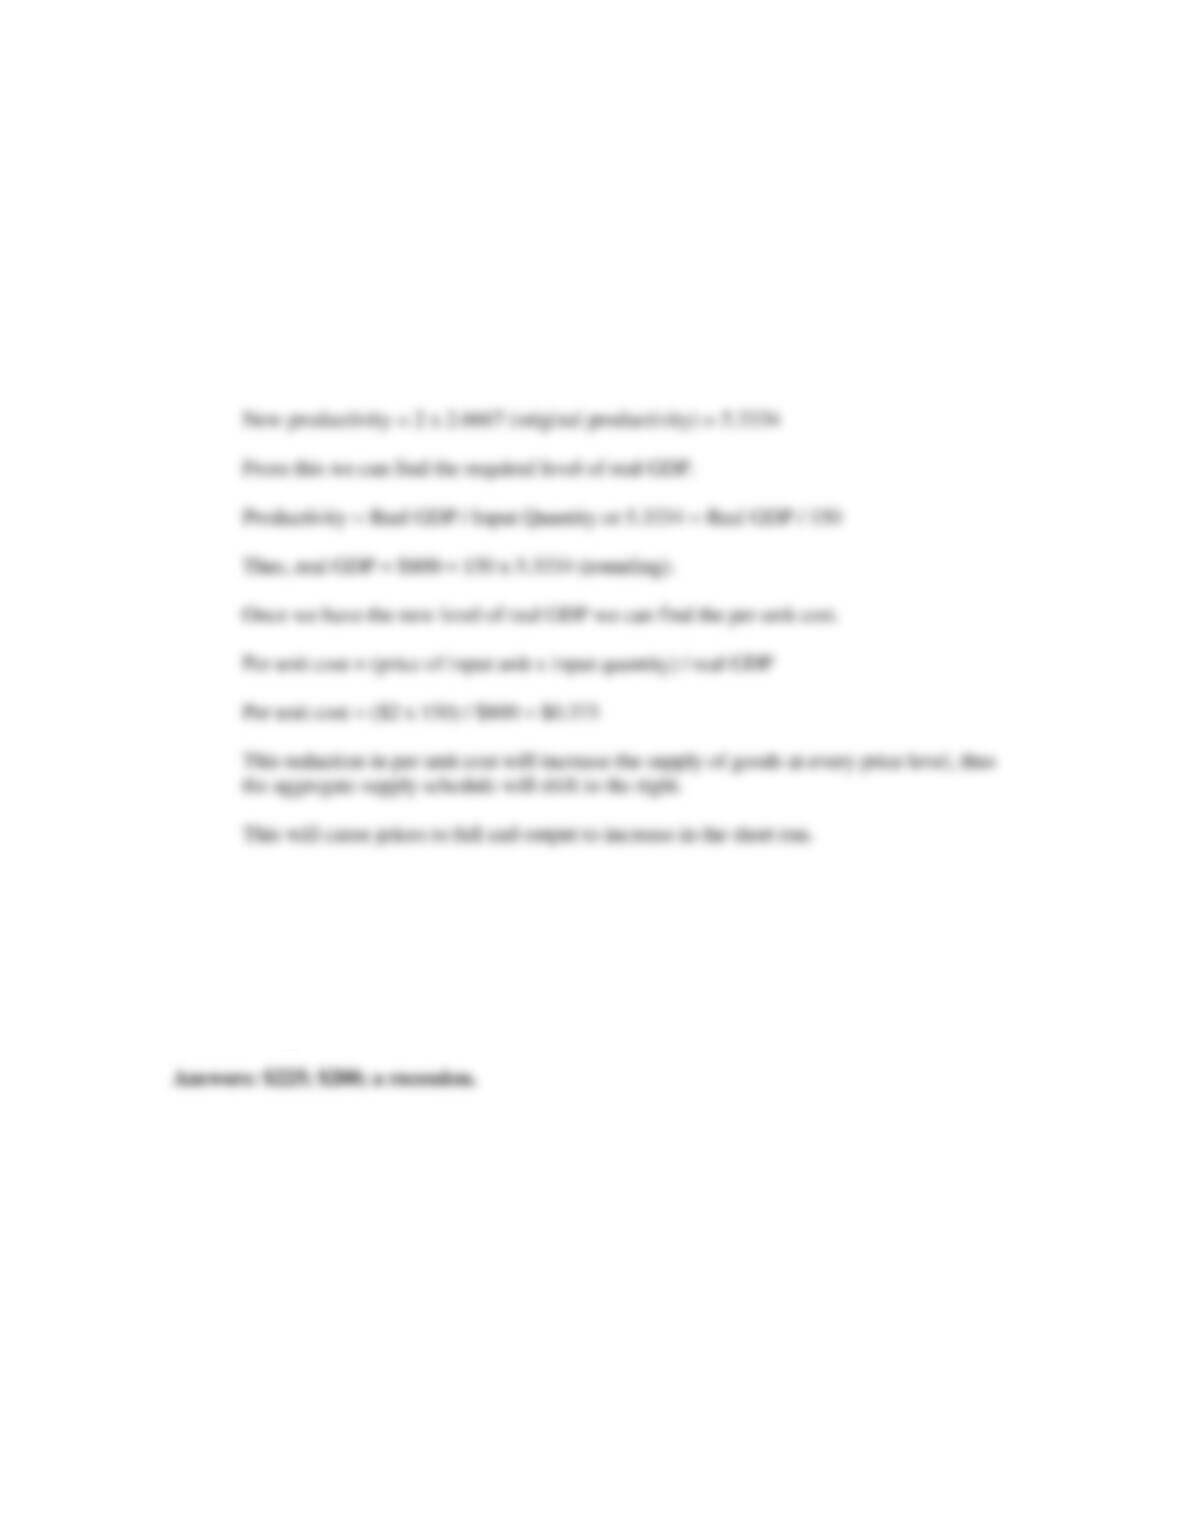
4. Suppose that the table below shows an economy’s relationship between real output and the
inputs needed to produce that output: LO3
a. What is productivity in this economy?
b. What is the per-unit cost of production if the price of each input unit is $2?
c. Assume that the input price increases from $2 to $3 with no accompanying change in
productivity. What is the new per-unit cost of production? In what direction would the $1
increase in input price push the economy’s aggregate supply curve? What effect would this shift
of aggregate supply have on the price level and the level of real output?
d. Suppose that the increase in input price does not occur but, instead, that productivity increases
by 100 percent. What would be the new per-unit cost of production? What effect would this
change in per-unit production cost have on the economy’s aggregate supply curve? What effect
would this shift of aggregate supply have on the price level and the level of real output?
$500 (=$300 + $200)
200
$700 (=$500 + $200)
100
Chapter 12 – Aggregate Demand and Aggregate Supply
12–11
Part a:
What is productivity in this economy?
Part b:
What is the per-unit cost of production if the price of each input unit is $2?
Part c:
Assume that the input price increases from $2 to $3 with no accompanying change in
productivity. What is the new per-unit cost of production? In what direction would the $1
increase in input price push the economy’s aggregate supply curve? What effect would
this shift of aggregate supply have on the price level and the level of real output?
Chapter 12 – Aggregate Demand and Aggregate Supply
12–12
Part d:
Suppose that the increase in input price does not occur but, instead, that productivity
increases by 100 percent. What would be the new per-unit cost of production? What
effect would this change in per-unit production cost have on the economy’s aggregate
supply curve? What effect would this shift of aggregate supply have on the price level
and the level of real output?
If productivity increases by 100%, this implies output will double at every input quantity.
Real GDP will now be $800 at the input quantity of 150.
5. Refer to the data in the table that accompanies Problem 2. Suppose that the present equilibrium
price level and level of real GDP are 100 and $225, and that data set B represents the relevant
aggregate supply schedule for the economy. LO4
a. What must be the current amount of real output demanded at the 100 price level?
b. If the amount of output demanded declined by $25 at the 100 price shown levels in B, what
would be the new equilibrium real GDP? In business cycle terminology, what would economists
call this change in real GDP?
Feedback: Consider the following example. Suppose that the present equilibrium price
level and level of real GDP are 100 and $225, and that data set B represents the relevant
aggregate supply schedule for the economy.
Chapter 12 – Aggregate Demand and Aggregate Supply
12–13
Part a:
What must be the current amount of real output demanded at the 100 price level?
Part b:
If the amount of output demanded declined by $25 at the 100 price shown levels in B,
what would be the new equilibrium real GDP? In business cycle terminology, what
would economists call this change in real GDP?
If output demanded fell by $25, the new level of demand is $200. Since the price level