Chapter 12 – Aggregate Demand and Aggregate Supply (+ Appendix)
12A-1
Chapter 12 Aggregate Demand and Aggregate Supply (+ Appendix)
QUESTIONS
1. Explain carefully: “A change in the price level shifts the aggregate expenditures curve but not
the aggregate demand curve.” LO5
Answer: A change in the price level does not shift the aggregate demand curve. It
simply represents a movement along the curve, because there is an inverse relationship
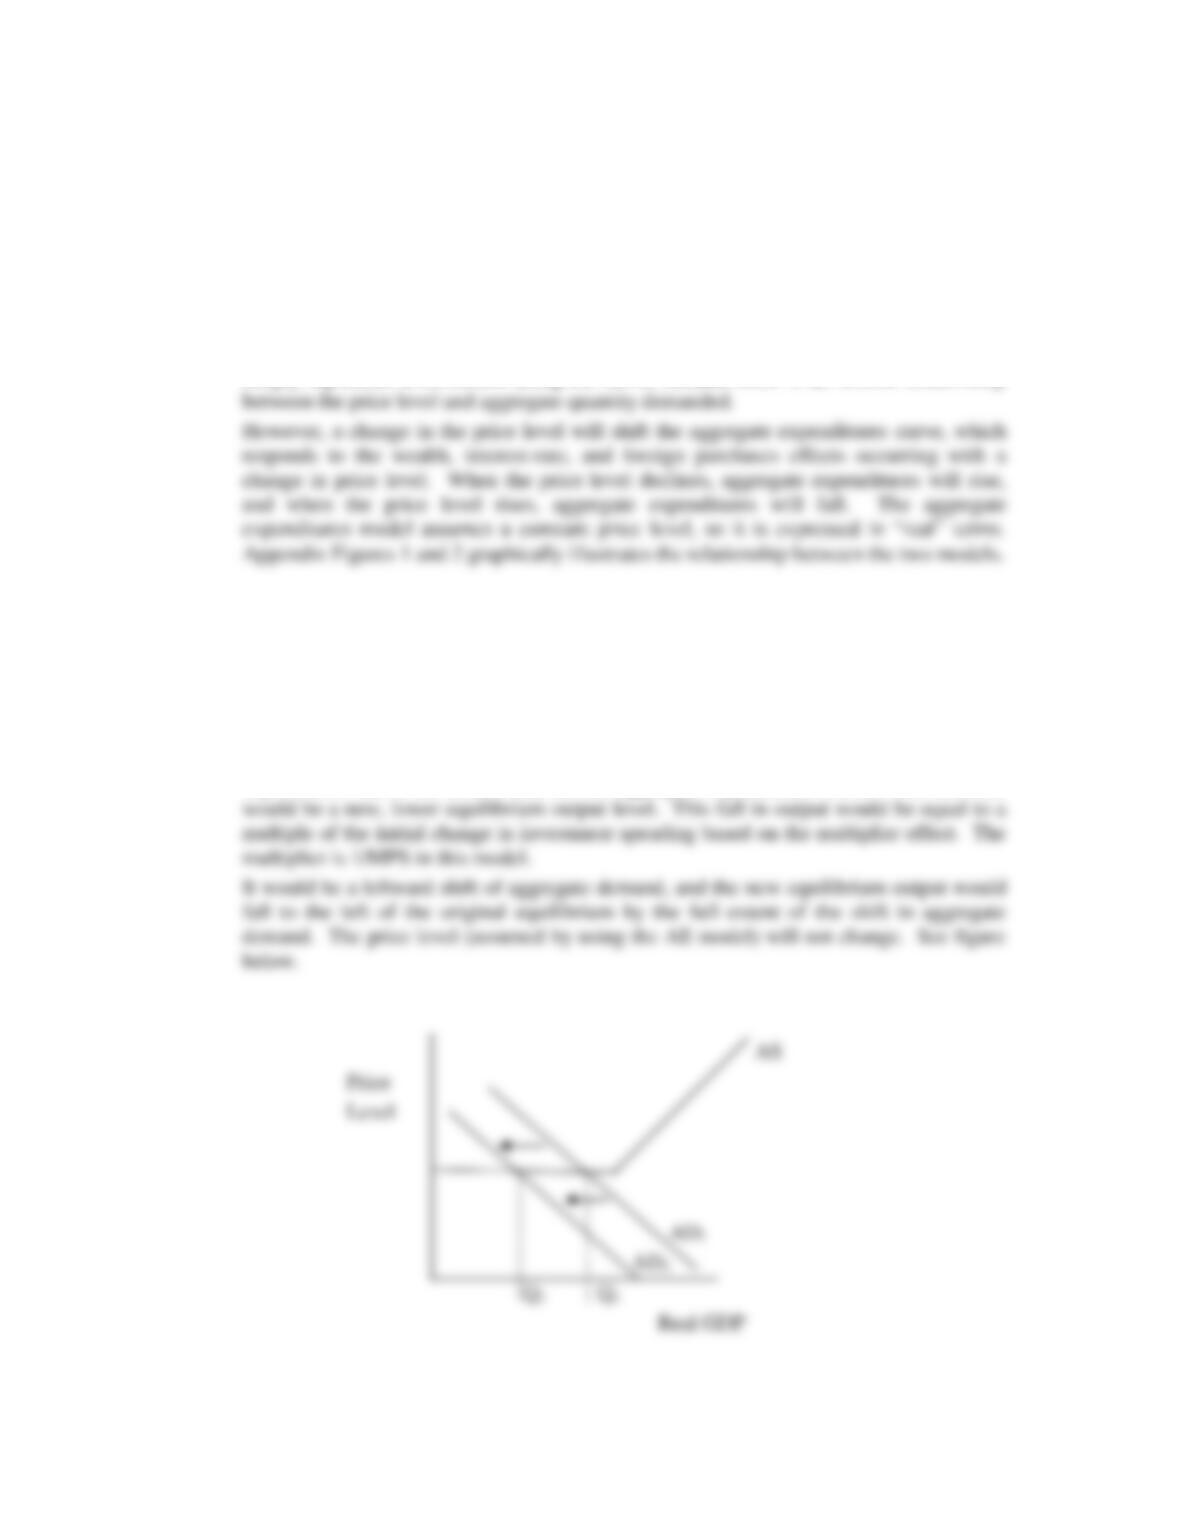
2. Suppose that the price level is constant and that investment decreases sharply. How would you
show this decrease in the aggregate expenditures model? What would be the outcome for real
GDP? How would you show this fall in investment in the aggregate demand–aggregate supply
model, assuming the economy is operating in what, in effect, is a horizontal section of the
aggregate supply curve? LO5
Answer: A decrease in investment spending represents a decrease in aggregate
expenditures and a downward shift in the aggregate expenditures curve. The outcome
Chapter 12 – Aggregate Demand and Aggregate Supply (+ Appendix)
12A-2
PROBLEMS
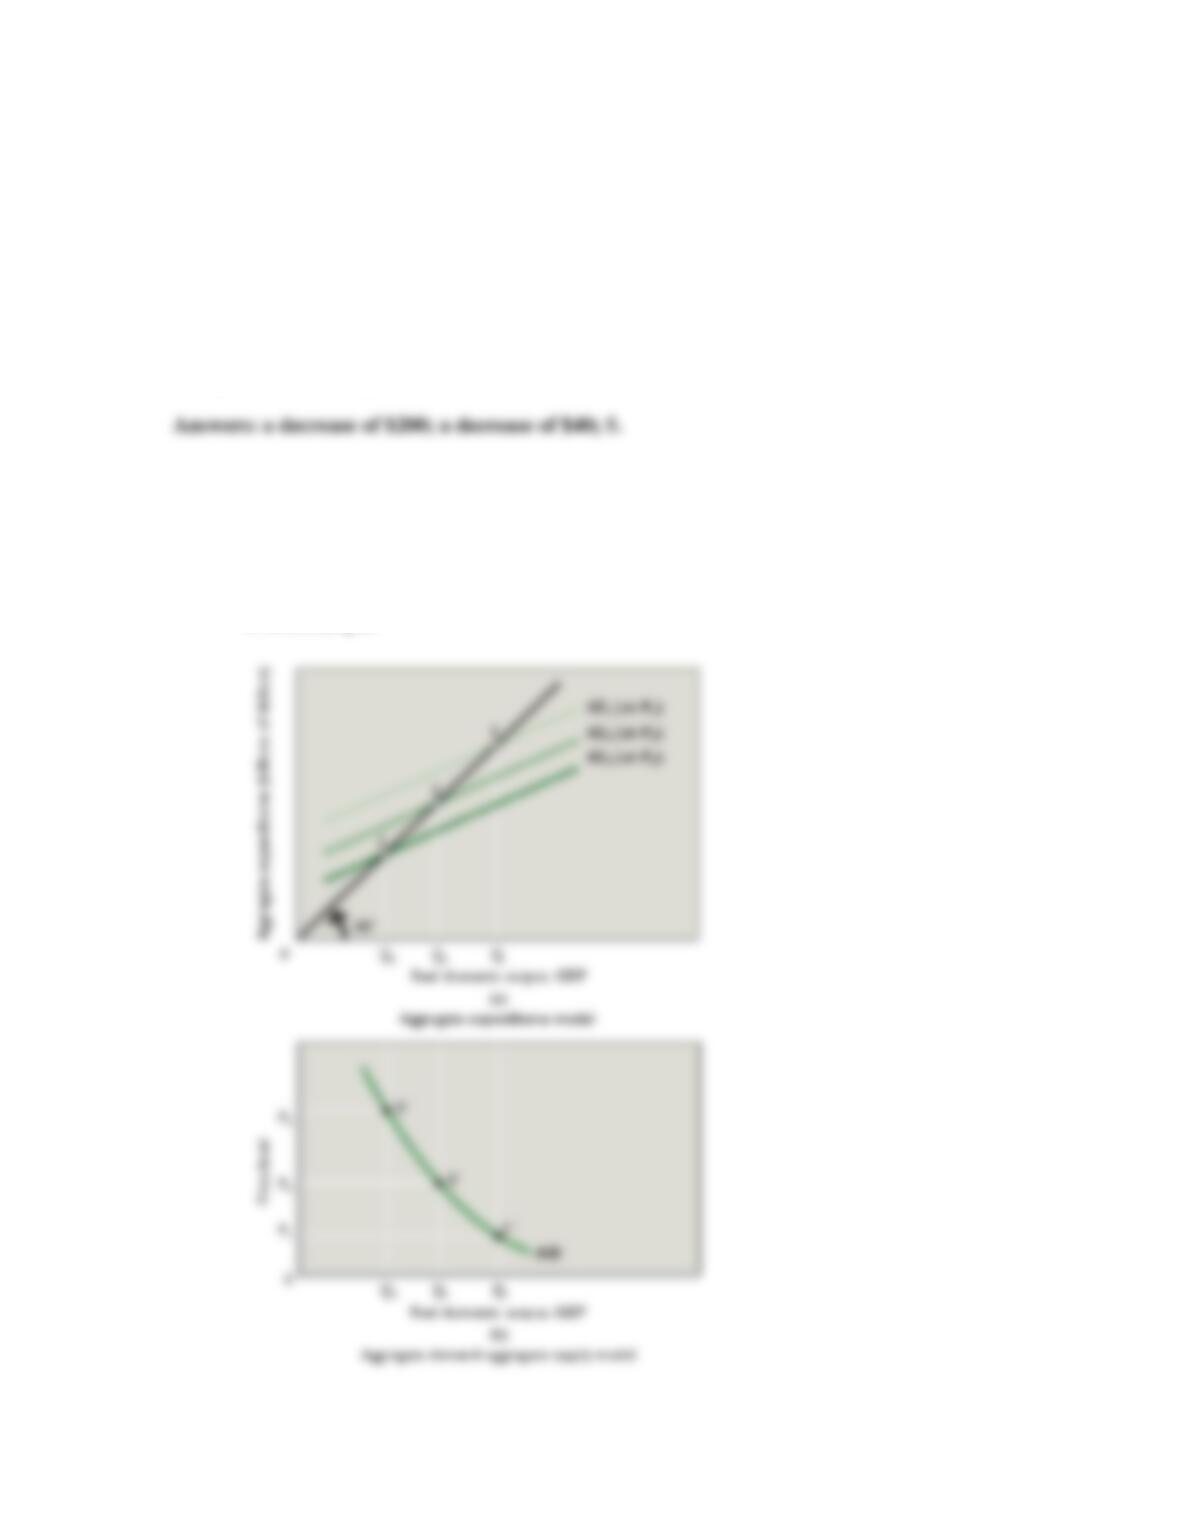
1. Refer to Figure 1a and 1b in the Appendix. Assume that Q1 is 300, Q2 is 200, Q3 is 100, P3 is
120, P2 is 100, and P1 is 80. If the price level increases from P1 to P3 in graph (b), in what
direction and by how much will real GDP change? If the slopes of the AE lines in Figure 1a are .8
and equal to the MPC, in what direction will the aggregate expenditures schedule in Figure 1a
need to shift to produce the previously determined change in real GDP? What is the size of the
multiplier in this example? LO5
Feedback: Consider the following example. Refer to Figure 1a and 1b in the Appendix.
Assume that Q1 is 300, Q2 is 200, Q3 is 100, P3 is 120, P2 is 100, and P1 is 80. If the
price level increases from P1 to P3 in graph (b), in what direction and by how much will
real GDP change? If the slopes of the AE lines in graph (a) are .8 and equal to the MPC,
in what direction will the aggregate expenditures schedule in graph (a) need to shift to
produce the previously determined change in real GDP? What is the size of the multiplier
in this example?
Chapter 12 – Aggregate Demand and Aggregate Supply (+ Appendix)
12A-3
If the price level increases from P1 to P3 in graph (b), in what direction and by how
much will real GDP change?
Real GDP will fall (movement along the AD schedule and a shift downward of the AE
If the slopes of the AE lines in graph (a) are .8 and equal to the MPC, in what direction
will the aggregate expenditures schedule in graph (a) need to shift to produce the
previously determined change in real GDP? What is the size of the multiplier in this
example?
The first step is to determine the multiplier for this problem. Given the MPC is 0.8 the
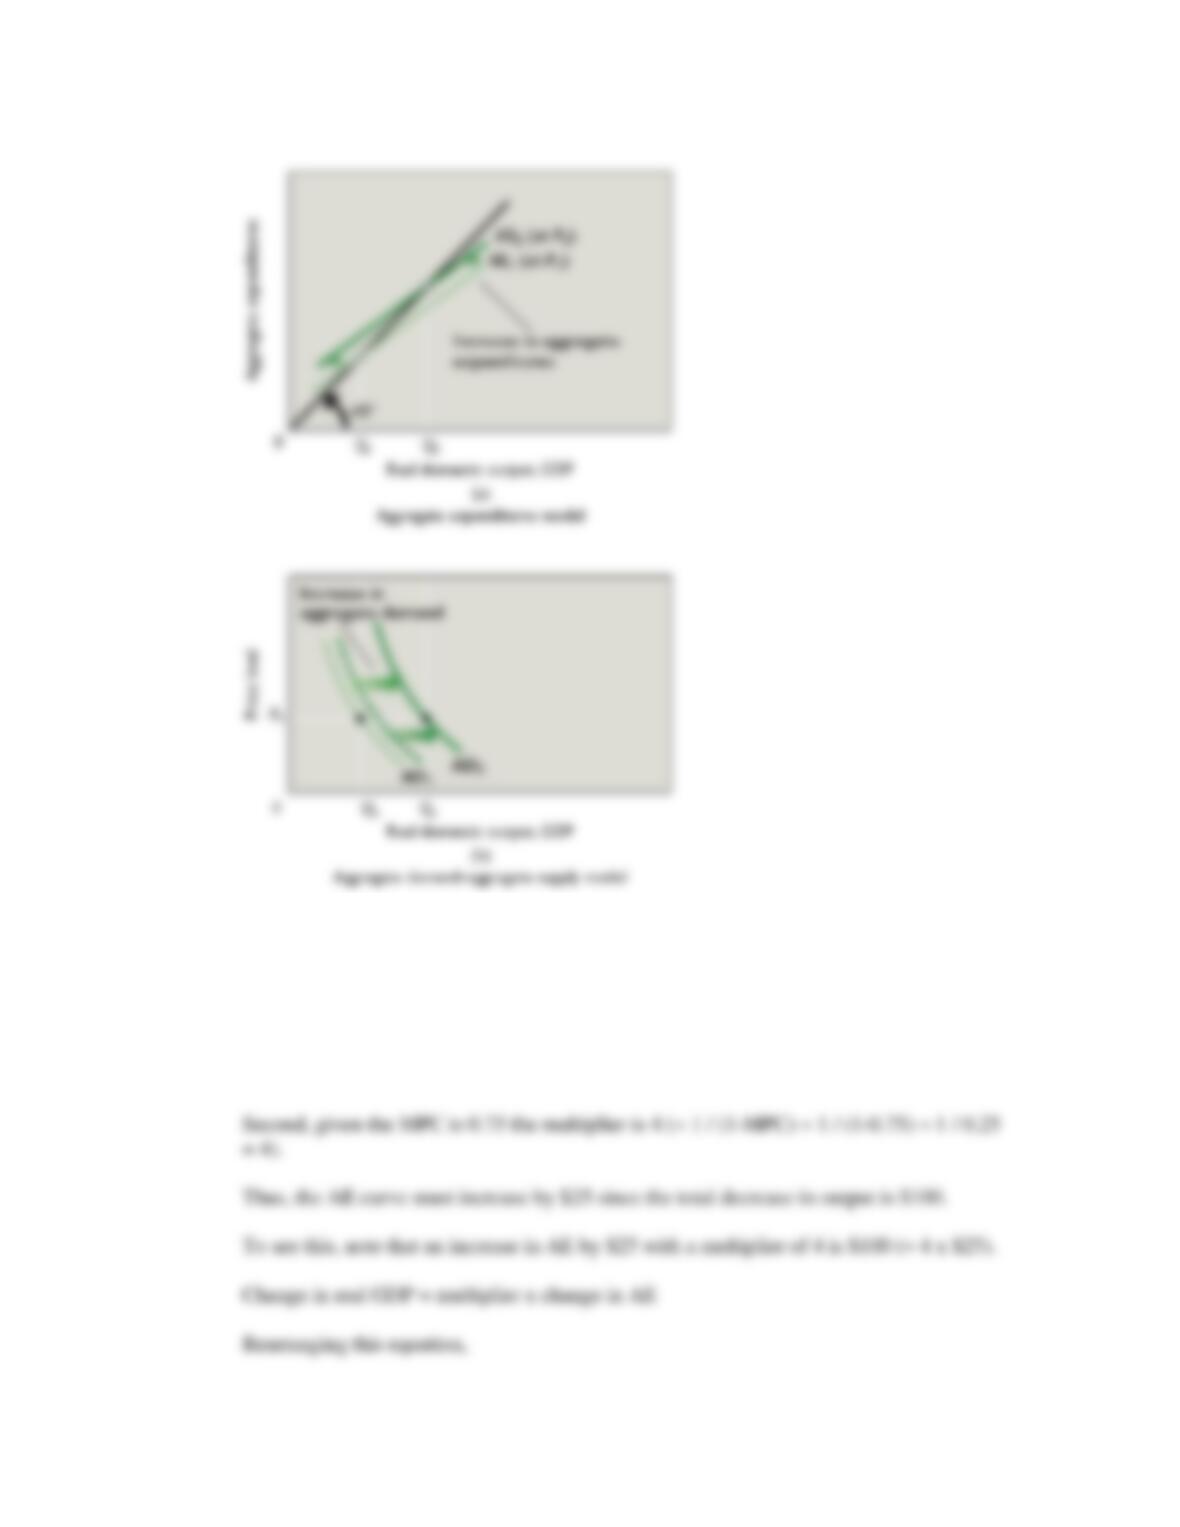
2. Refer to Figure 2 in the Appendix and assume that Q1 is $400 and Q2 is $500, the price level is
stuck at P1, and the slopes of the AE lines in Figure 2a are .75 and equal to the MPC. In what
direction and by how much does the aggregate expenditures schedule in Figure 2a need to shift to
move the aggregate demand curve in Figure 2b from AD1 to AD2? What is the multiplier in this
example? Given the multiplier, what must be the distance between AD1 and the broken line to its
right at P1? LO5
Feedback: Consider the following example. Refer to Figure 2 in the Appendix and
assume that Q1 is $400 and Q2 is $500, the price level is stuck at P1, and the slopes of
the AE lines in graph (a) are .75 and equal to the MPC. In what direction and by how
much does the aggregate expenditures schedule in graph (a) need to shift in order to shift
the aggregate demand curve in graph (b) from AD1 to AD2? What is the multiplier in this
example? Given the multiplier, what must be the distance between AD1 and the broken
line to its right at P1?
Chapter 12 – Aggregate Demand and Aggregate Supply (+ Appendix)
12A-4
Refer to Figure 2 in the Appendix and assume that Q1 is $400 and Q2 is $500, the price
level is stuck at P1, and the slopes of the AE lines in graph (a) are .75 and equal to the
MPC. In what direction and by how much does the aggregate expenditures schedule in
graph (a) need to shift in order to shift the aggregate demand curve in graph (b) from
AD1 to AD2? What is the multiplier in this example?
First, we note that the change in output is an increase of $100 (Q2 – Q1 = $500 – $400).
Chapter 12 – Aggregate Demand and Aggregate Supply (+ Appendix)
12A-5
Given the multiplier, what must be the distance between AD1 and the broken line to its
right at P1?
This distance is the initial shift following the increase in expenditure by $25 (the shift in