where MR “ MC and charges the highest price on
the demand curve at that quantity. So, the firm
can earn profits in the short run, like a mono poly.
However, because there are no barriers to
entry (as in perfect competition), there are zero
acts more like a competitive market. Because there
are no barriers to entry, profits are competed away,
and there are zero profits in the long run.
3. Recall that the most efficient scale of production
MR “ MC. At this point, P # MC, which means
there are still people willing to buy the unit for
more than the cost of production. So, the monop-
olistically competitive firm is producing too little
in terms of efficiency.
4. In the short run, it’s pos si ble for a monopolistic
Questions for Review
1. Product differentiation is necessary for monopo-
listic competition in order for each firm to have
some market power. This way, each firm faces a
downward- sloping demand curve.
restaurants, Chinese restaurants, steak houses, and
so forth. These restaurants all differ by the types
of food they serve. Even two restaurants that
serve the same type of food— say, Chinese— could
differ by location. A restaurant in the heart of the
Hints and Common Errors: Sometimes,
it’s useful to think about why assumptions exist
for dif fer ent markets and how they come into
play. This can help you keep the dif fer ent markets
straight. For example, to remember why product
differentiation exists in monopolistic competition
2. Monopolistic competition takes some aspects
from perfect competition and some aspects from
mono poly. In monopolistic competition, there are
several firms, but each firm faces a downward-
sloping demand curve (like a mono poly). Within
its own market, each firm acts like a small mono-
poly and has some market power. It produces
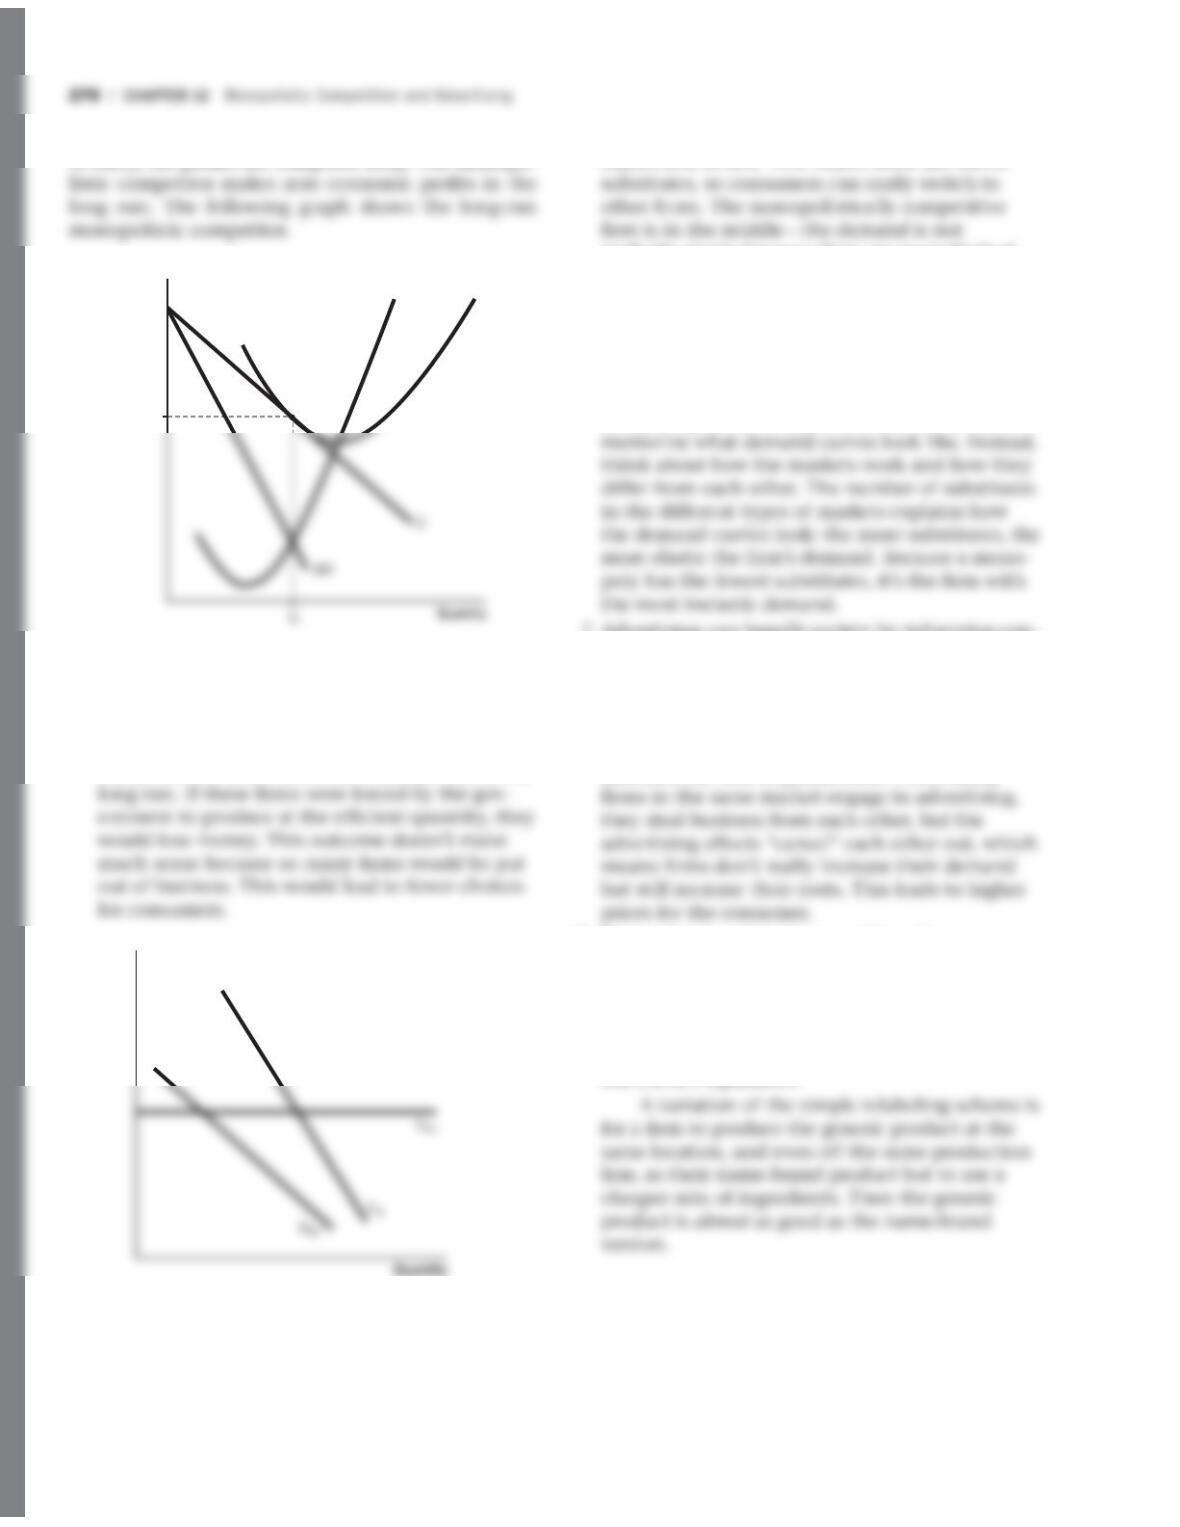
Solutions to Chapterfi12 Text Prob lems
Quantity
MR
D
Q
goods are homogeneous, and there are plenty of
perfectly elastic because there are more limited
substitutes for a firm’s product in comparison to
perfect competition. However, the demand is not
as inelastic as in a mono poly because there are
some substitutes in the market, even though they
aren’t perfect substitutes.
Hints and Common Errors: When
comparing dif fer ent types of markets, try not to
7. Advertising can benefit society by informing con-
sumers about products or product characteristics
that they wouldn’t other wise know about. This
gives consumers more information so they are
better able to make decisions about what to buy.
Advertising can be harmful because it
8. From a firm’s point of view, selling the same
product both under its own name and, more
cheaply, as a generic is an opportunity to practice
price discrimination by charging brand- conscious
customers a premium. Of course the firm will
want to keep quiet about this practice to protect
Study Prob lems
2. a. Local corn farmers would be considered a com-
petitive market, not monopolistic competition.
There are lots of sellers of corn, and this good
does not vary much from farm to farm.
However, in the long run, because there are no barriers
ELR
P = ATC
Price
ATCMC
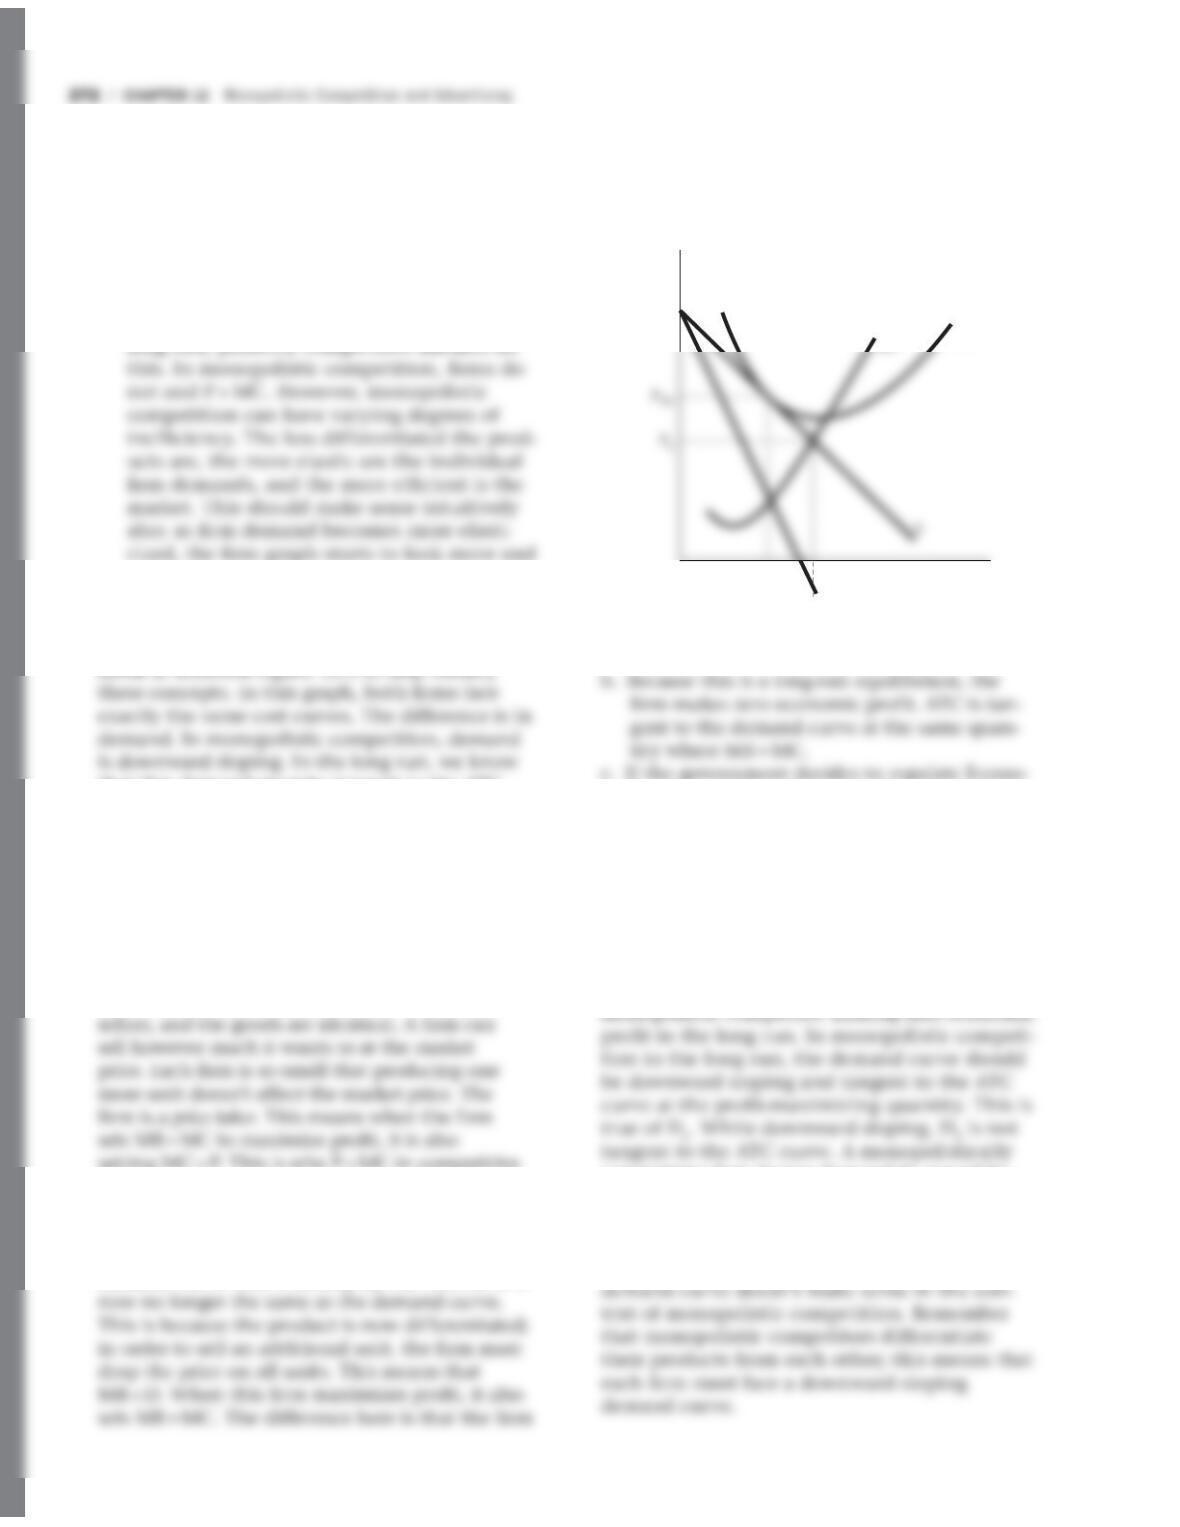
5. It’s true that monopolistic competition produces
an inefficient result, and monopolistically com-
petitive firms do not produce at a level where
P “ MC. However, because there are no barriers to
entry, none of these firms can make profits in the
6.
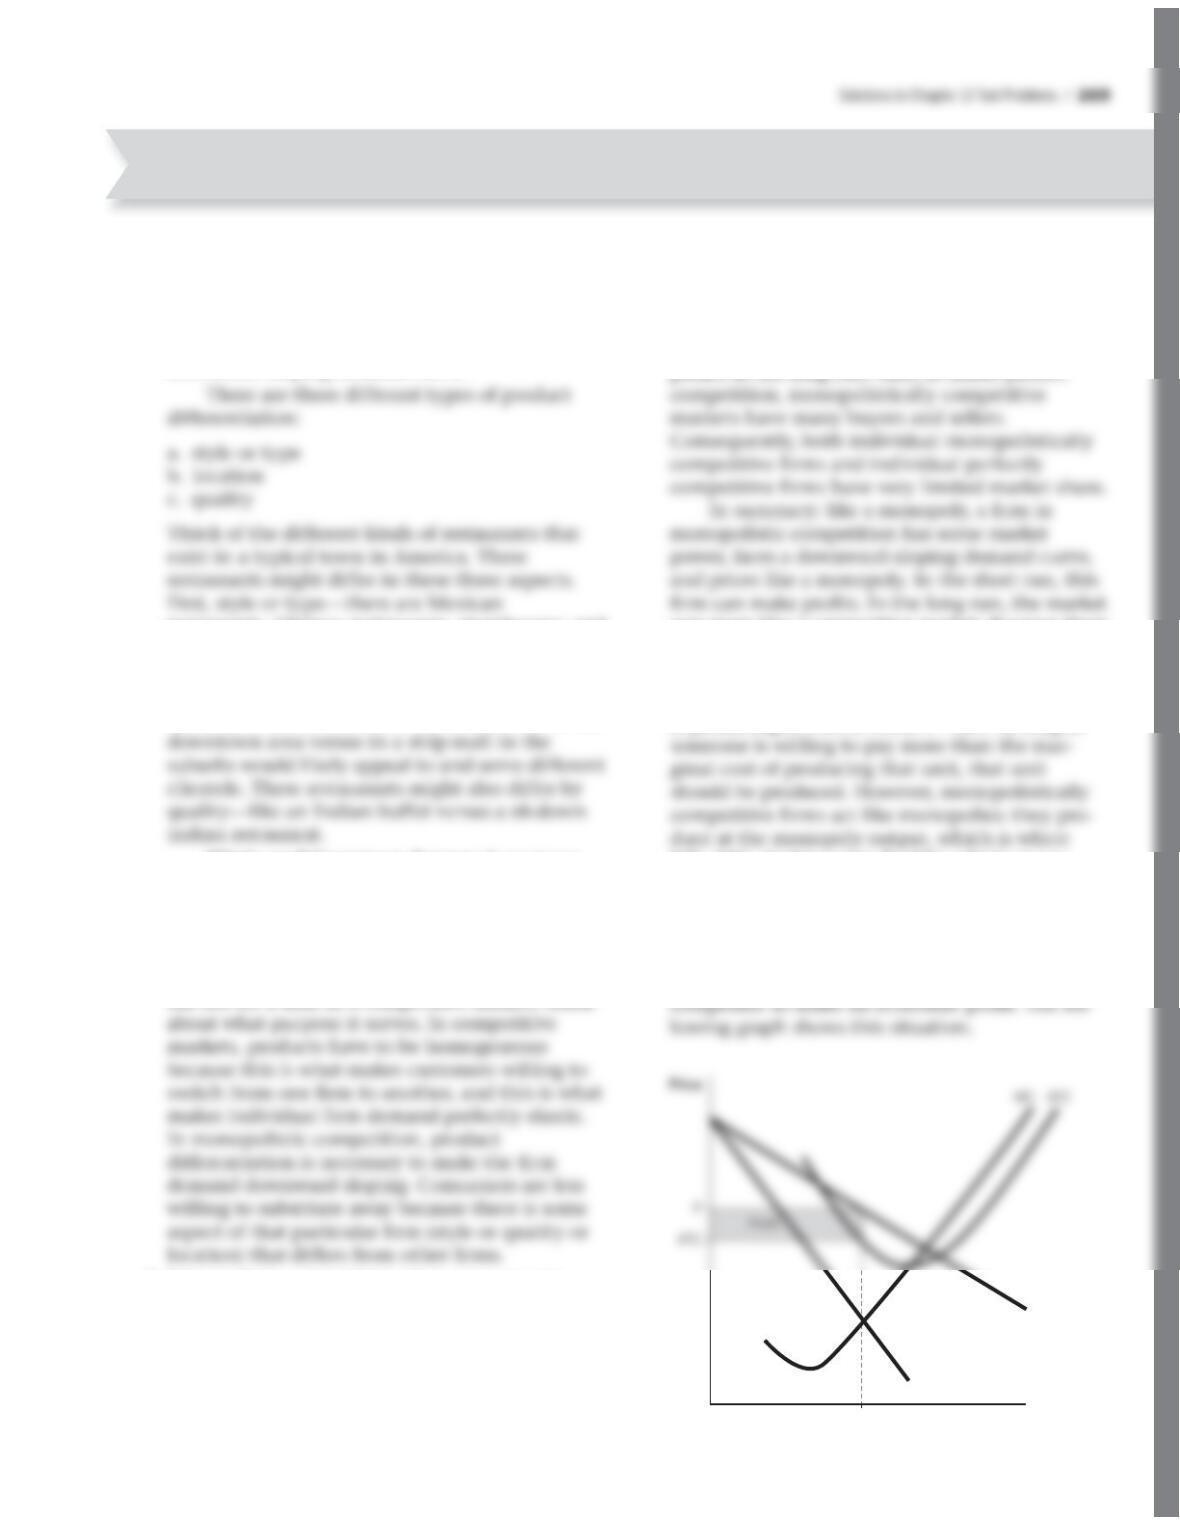
Price
The previous graph shows typical firm demand
curves for the three dif fer ent markets. The mono–
poly faces the most inelastic demand curve
because there are no good substitutes for the
product it produces. The perfectly competitive
firm faces the most elastic demand curve because
will be producing at the lowest point of the
ATC curve. This means it has no excess capac–
ity. A firm in monopolistic competition, in
contrast, does not produce at the minimum of
ATC. Because it faces this downward- sloping
listically competitive firm has excess capacity.
Because a monopolistically competitive firm
has excess capacity, this means that it is not
operating at the minimum of ATC. A perfectly
competitive firm, in contrast, operates at the
demand for that product in general might
increase, but demand for the par tic u lar firm’s
product won’t increase by much. In contrast,
it makes a lot more sense for a monopolisti-
cally competitive firm to advertise. If this firm
tricity com pany to compete against the TVA.
c. Pizza delivery can be considered monopolistic
competition. There are many dif fer ent firms
that produce slightly differentiated products.
There might be a local pizza joint that serves
Kroger, in contrast, is known for low prices.
Trader Joe’s, a specialty store, is known for its
frozen food and snack se lection. Each grocery
store has a dif fer ent style and may appeal to a
dif fer ent demographic.
3. a. The markup will be higher for a monopolisti-
cally competitive firm. Remember that the
markup is the difference between price and
marginal cost. Because a firm in monopolistic
competition faces a downward- sloping
charges the highest price it can, which comes
offof the demand curve. However, because
D # MR, this means P # MC at the profit–
maximizing point.
5. a.
QMC
QE
Econo burgers
MR
ATC
Price
Quantity
burgers and forces the firm to produce at the
efficient level, then it will force the firmto
produce Qe at price Pe. The price will be
lower, and the output will be higher. Also,
atthis point, the price the firm charges will
be lower than the average cost, which means
the firm will be earning a negative economic
profit.
7. D1 is the demand curve consistent with a
competitive firm facing demand D2 would be
making positive profits, which is pos si ble for the
firm only in the short run. Though D3 indicates
a firm that makes zero profits, D3 is a perfectly
elastic demand curve. A perfectly elastic
potential firms that this industry is popu lar,
and resources should be devoted here. Firms
enter, pushing down price and driving profits
to zero. This happens in both monopolistic
competition and perfect competition because
there are no barriers to entry.
g. Perfect competition is efficient; monopolistic
competition is not. Remember that an effi-
cient market produces where P “ MC. In the
more like perfect competition, which is
efficient.
Hints and Common Errors: All these
characteristics are easier to see graphically. Take
that this demand must be tangent to the ATC
curve. In perfect competition, demand is
perfectly elastic. In the long run, because there
are zero profits, this demand must equal the
minimum of ATC.
4. In both competitive markets and monopolistic
competition, firms maximize profits. They do this
by setting MR “ MC.
For competitive markets, P “ MR “ D for the
firms. This is because there are lots of buyers and
settingMC “ P. This is why P “ MC in competitive
markets.
Now let’s consider monopolistic competition.
A firm in monopolistic competition has some
market power and faces a downward- sloping
demand curve. Like a mono poly, the MR curve is
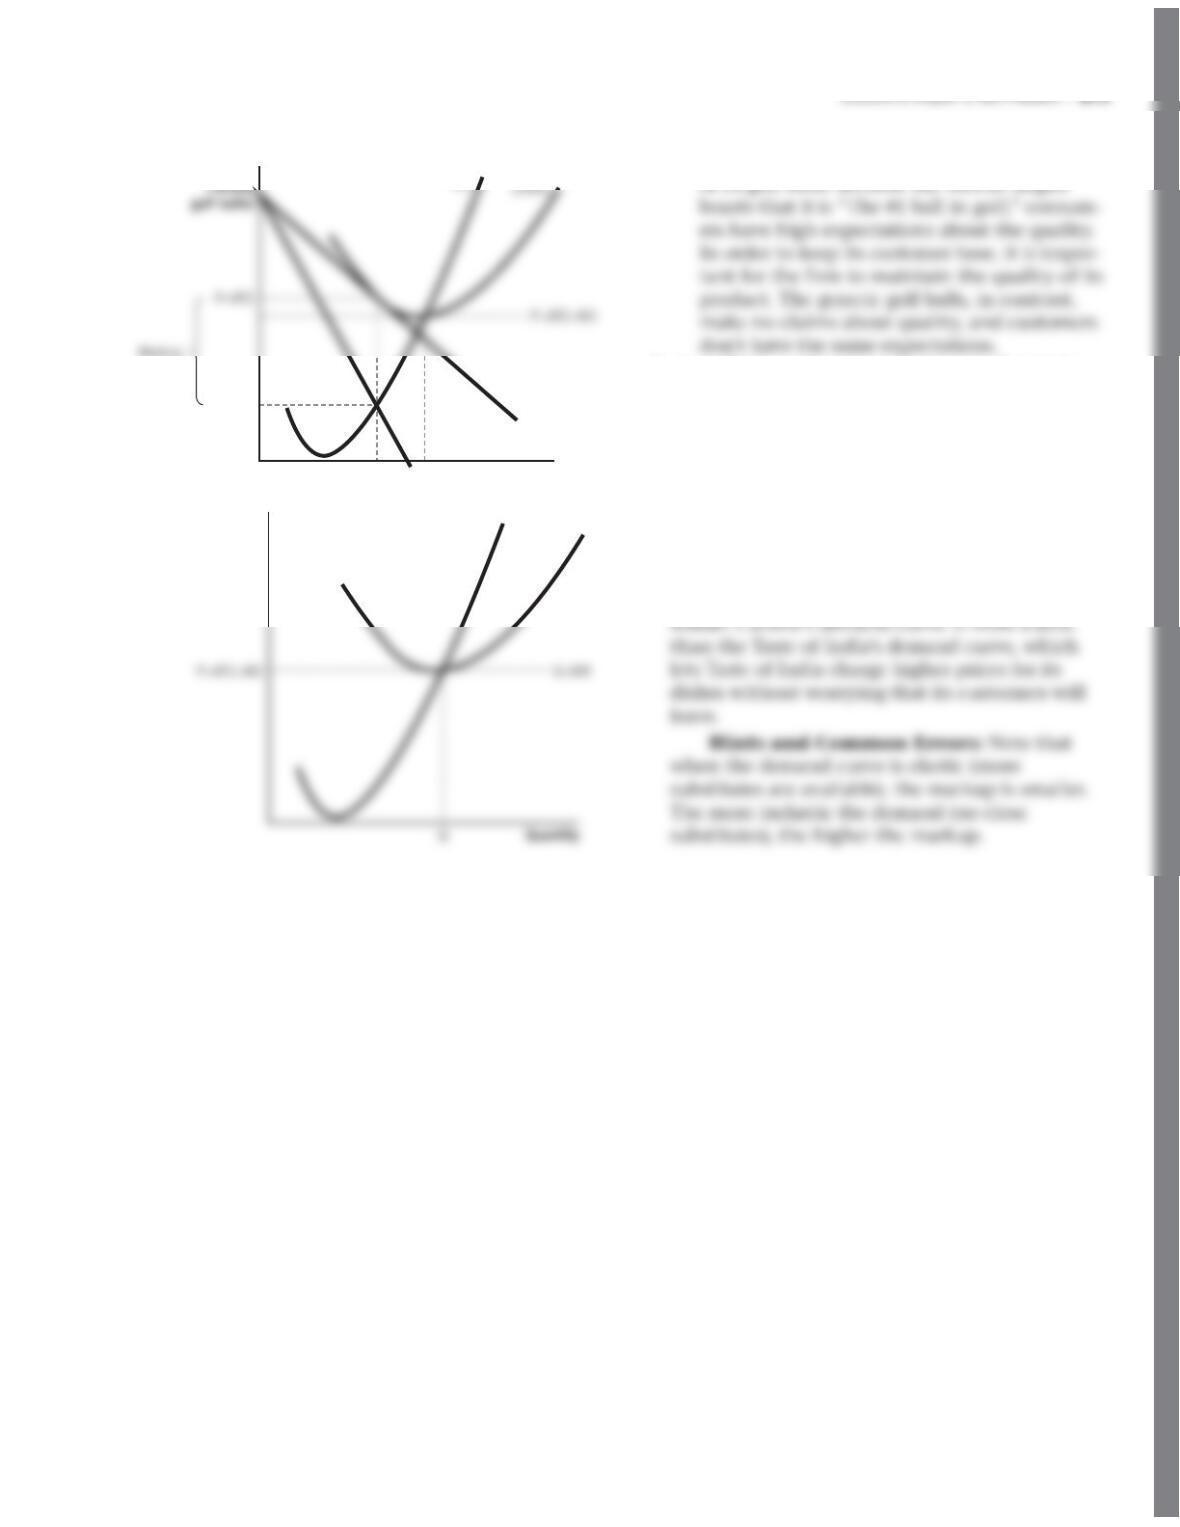
c. Titleist has a much stronger incentive to main-
tain quality control in the production pro cess
9. A small- town restaurant serves a small popula-
tion, whereas a restaurant in a large town enjoys
a higher demand since it has a larger population
to serve. As a result, there is not much incentive
for a business owner to open a restaurant in a
small town because he or she would evaluate its
competitors before entering the market. This lets
Taste of India act as a mono poly, or gives it more
market power. On the other hand, Indian Cuisine
in a large town faces competition as more and
more restaurants try to tap customers’ dollars. So
8. a.
D
MR
Q
MC
Price
Quantity
b.
Price
(generic
golf balls)
MC LRATC